Method and Apparatus for Analysing Data Representing Attributes of Physical Entities

a physical entity and attribute technology, applied in the field of electronic data analysis, can solve the problems of providing apparent comfort, not necessarily clear how to correct for any overfitting, and the range of observations that any modelling data contains, and achieve the effect of accurate prediction

Inactive Publication Date: 2012-12-13
TOWERS PERRIN CAPITAL
View PDF0 Cites 8 Cited by
  • Summary
  • Abstract
  • Description
  • Claims
  • Application Information

AI Technical Summary

Benefits of technology

[0024]This measure may enable a user to refine a model in a more accurately predictive manner. The present methods provide an adjustment to the results which make them more predictive of future outcomes by providing insulation from noise in the input data.
[0027]calculating the number and location of knots to include in the model to minimise the deviance measure.
[0031]The invention further provides a method for analysing input electronic data using an electronic processor, wherein the input data comprises, for each of a set of physical entities, attribute values representing attributes of the respective physical entity and an outcome value representing an observed outcome for the respective physical entity, the analysis generates a model for predicting the outcome value for a further physical entity on the basis of data comprising the attribute values associated with the further physical entity, and the method comprises the steps of:(a) receiving the input data via an input of the processor and storing it in electronic data storage;(b) retrieving the input data from the data storage and processing the input data with the processor using a statistical modelling method to generate an intermediate model based on the input data, the intermediate model comprising parameter estimates and a variance / covariance matrix;(c) calculating a case deleted estimate of the outcome value for each of the set of physical entities on the basis of the intermediate model using the processor; and(d) generating a noise reduced model comprising noise reduced parameters, a noise reduced variance / covariance matrix, and noise reduced case deleted estimates using an iterative process so as to minimise a measure of the deviance of the noise reduced case deleted estimates from the actual outcome values in the input data.
[0032]Accordingly, the estimates produced by the intermediate model are adjusted to make them more predictive. The outputs of the intermediate model are tempered by penalising uncertain parameters to the extent that they are only rewarded for improving the likelihood (reducing Deviance) of the estimates as measured against hold-out sample data.
[0035]calculating the number and location of knots to include in the noise reduced model to minimise the deviance measure.
[0050]With this method we can go further, and scale back the poor parameters effectively neutralising them from the model. Pruning processes may then operate to remove them altogether. This will allow the user to focus upon finding potential factors in the knowledge that unsuccessful attempts will not damage the output.

Problems solved by technology

This causes Chi Squared tests on nested models and F-Tests to accept parameters which would be rejected from a business perspective as spurious and over-parameterised.
This approach often, though, only provides apparent comfort as it is not clear what a good or bad “fit” looks like when judged on the hold-out sample.
Also when you detect a poor “fit” it will not necessarily be clear how to correct for any overfitting.
1.3.4 There is also the problem of the range of observations that any modelling data contains, be it due to the underwriting footprint strategy or the particular channel business is distributed in.
Underlying factor effects such as interactions may not be identified due to the lack of observed data.
1.4.2 The estimates from a pricing model are best estimates in the statistical sense and hence are subject to uncertainty.
In these circumstances the Winner's Curse operates as a powerful anti-selection effect which imposes a heavy penalty where the uncertainty randomly results in an estimate which is below the true value.
But in doing so there is an increased likelihood of overfitting which does present a real business dilemma.
In fact it is very likely that when one systematically reviews the inclusion of each term in a sophisticated model that a business sense argument can be made for each and every one, but it is likely when taking together there will be an element of overfitting.
1.4.6 The first is the tendency for over-parameterised models to replicate noise within the data which will not be repeated in future observations.
This noise is one source of estimate uncertainty.
The fringes of the domain which tend to be sparsely populated with observations resulting in greater levels of uncertainty.

Method used


Image

  • Method and Apparatus for Analysing Data Representing Attributes of Physical Entities
  • Method and Apparatus for Analysing Data Representing Attributes of Physical Entities
  • Method and Apparatus for Analysing Data Representing Attributes of Physical Entities

Examples


Embodiment Construction

2. Case Deletion

2.1 Elimination of Outliers by Case Deletion

[0063]2.1.1 Using a measure of residuals such as the Cook's Statistic, Outlier points can be excluded from the model based on their undue influence on the parameter estimates.

[0064]2.1.2 This technique is supported by leading statistical packages, but for datasets of the scale currently in use, deleting outliers is an onerous and unproductive task.

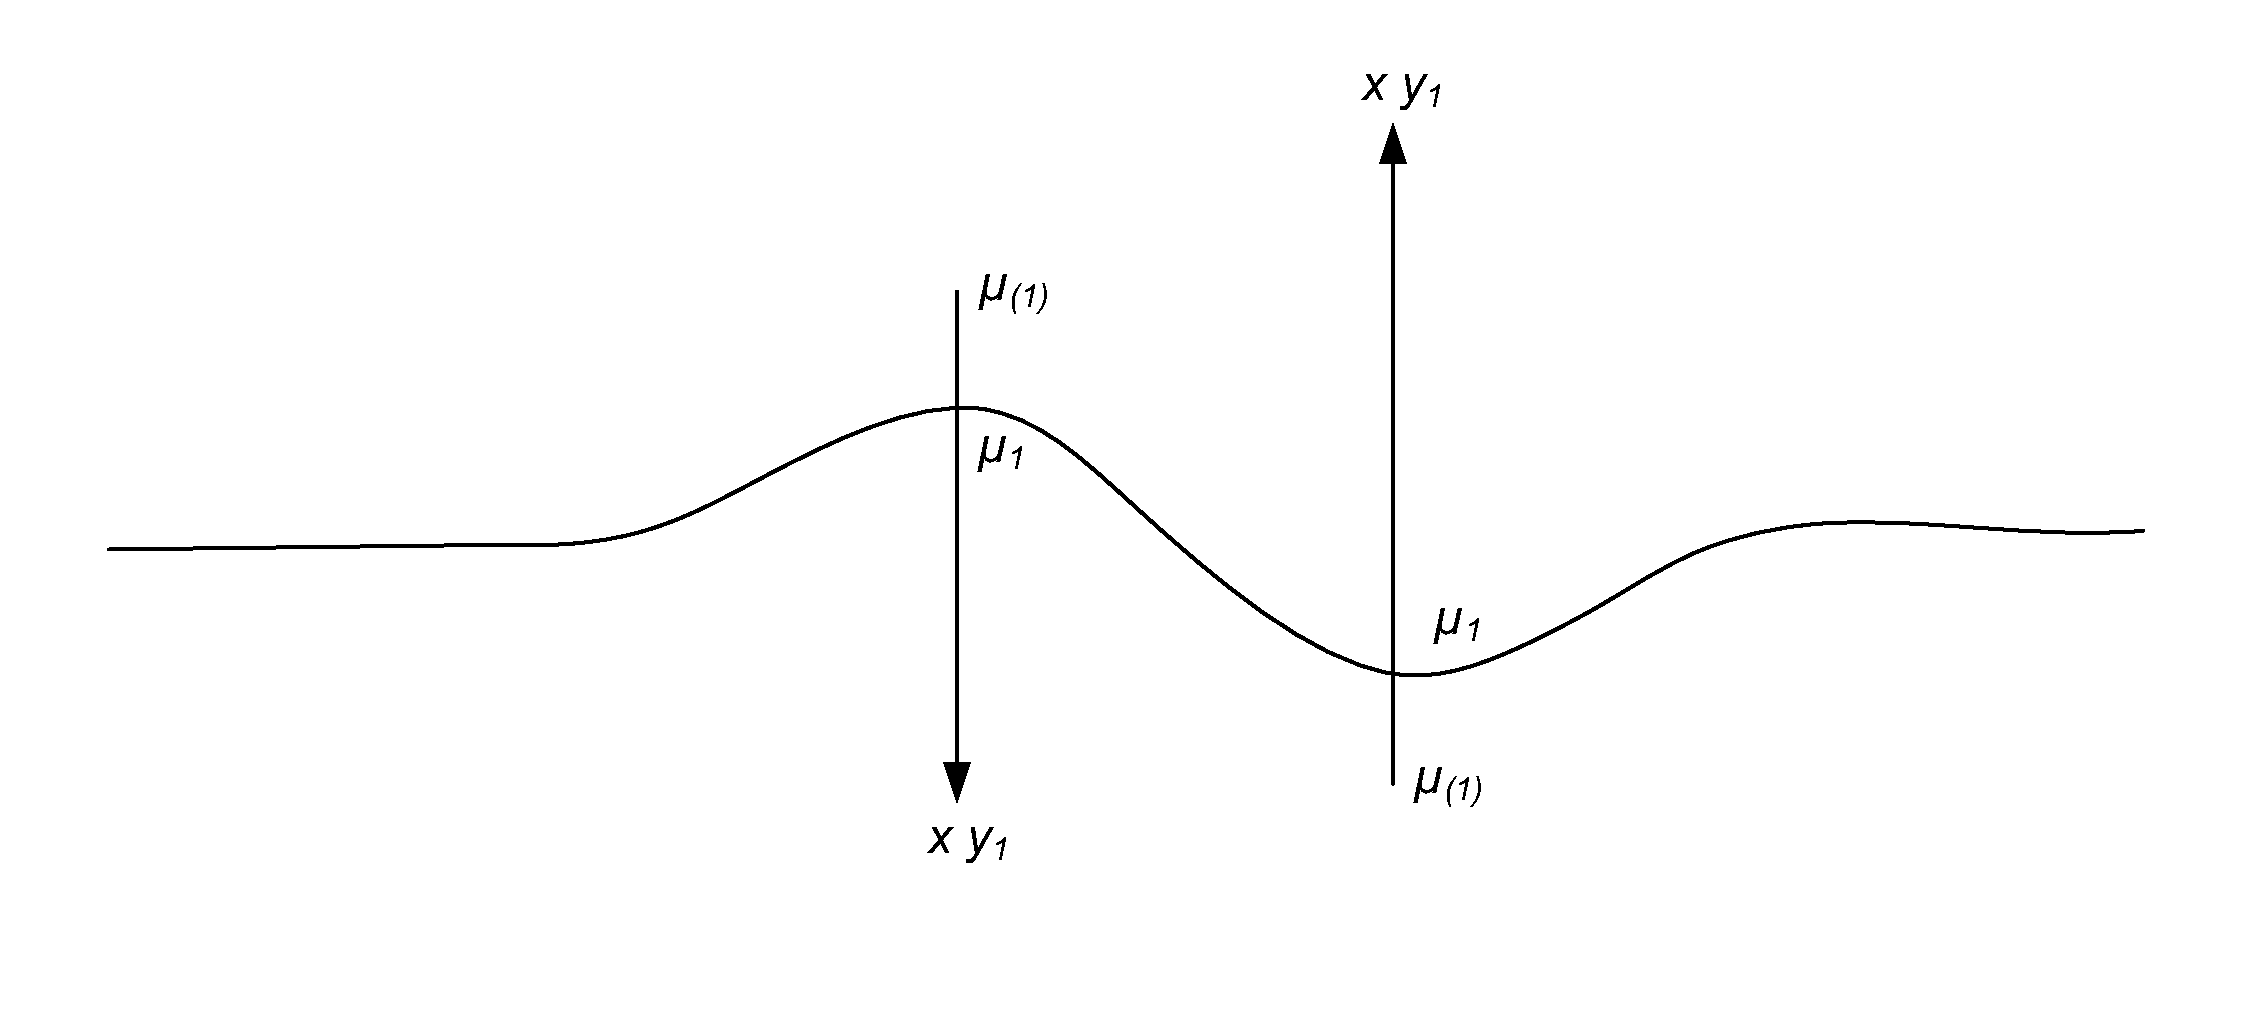
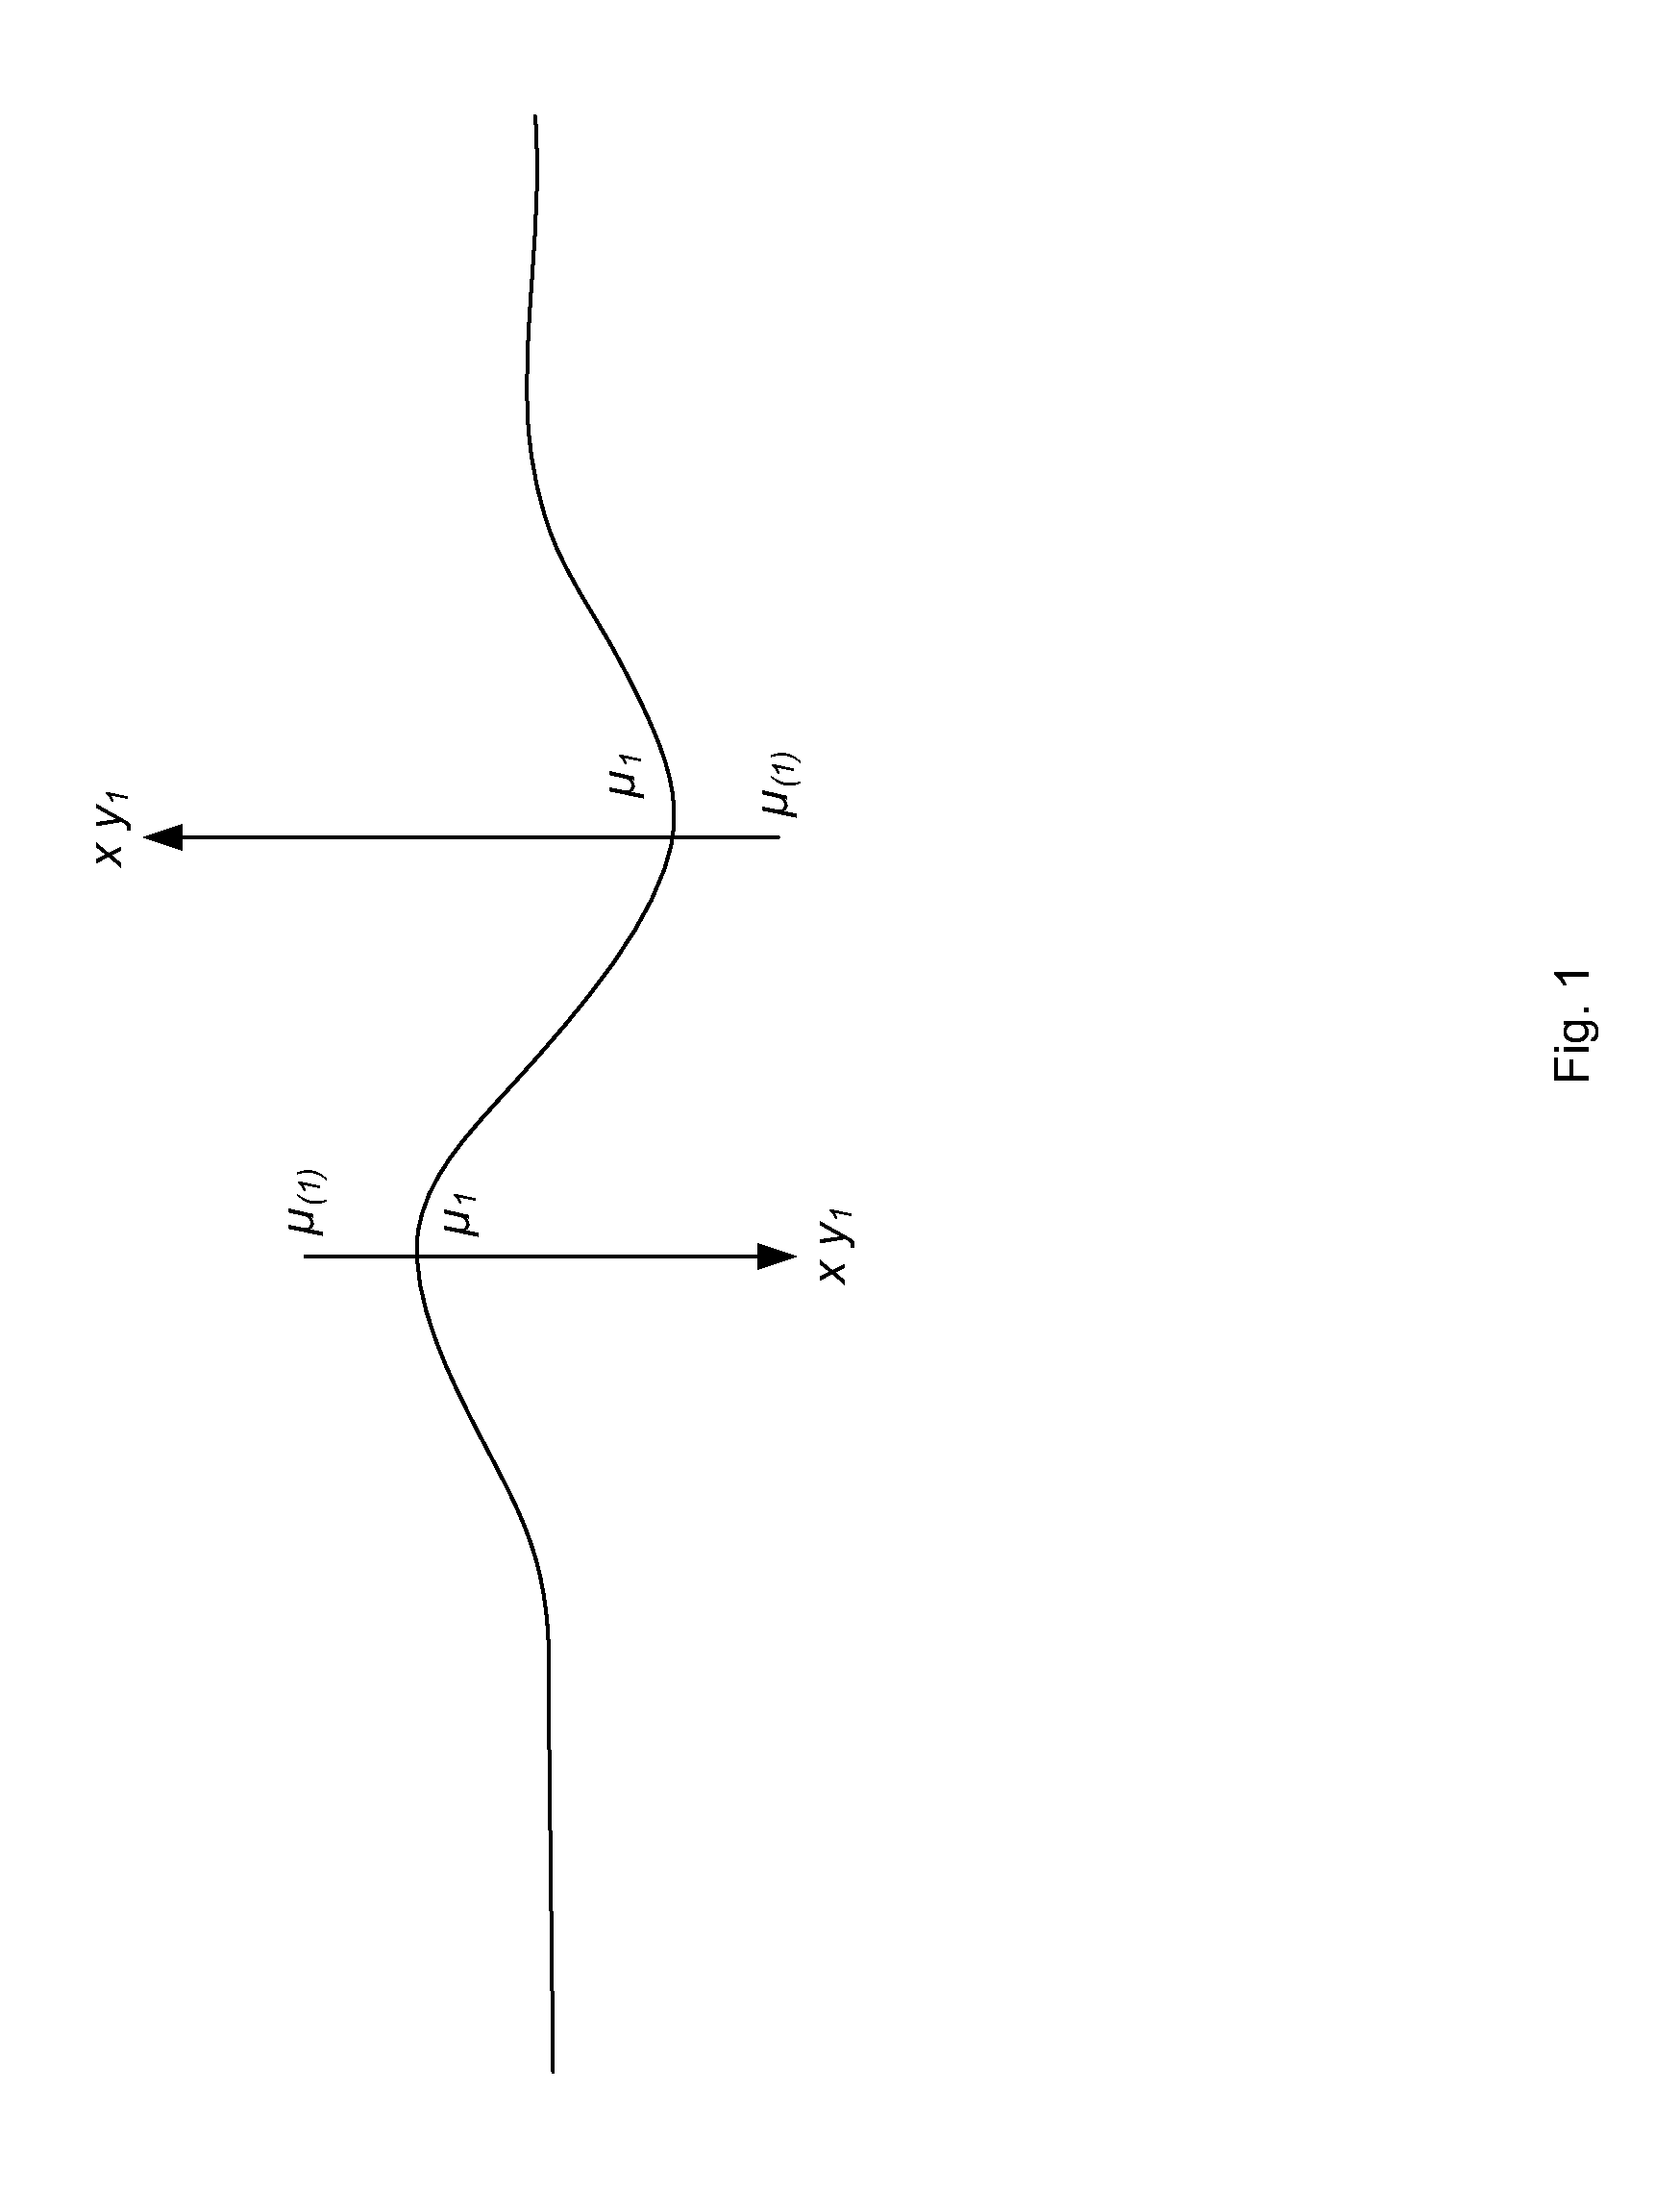
[0065]2.1.3 In essence each data point acts to pull the model towards itself, and the exclusion of that point and refitting the parameters will result in a new set of parameter values and hence new “Case Deleted” Estimate for that data point. By definition that estimate will lie further from the observed data point than the estimate produced by the full model. This is illustrated in FIG. 1, where yi are the original datapoints, μi are the estimates of those datapoints generated initially, and μ(i) are the “Case Deleted” Estimates.

3. Calculation of “Case Deleted” Estimates

3.1 Formu...


PUM


Abstract

Methods for analysis of electronic data which comprises, for each of a set of physical entities, attribute values representing attributes of the respective physical entity and an outcome value representing an observed outcome for the entity which may be used to generate a model for predicting the outcome value for another physical entity of the same type. The data is processed using a statistical modelling method to generate a model based on the data. The method then involves calculating a case deleted estimate of the outcome value for each of the set of physical entities using the processor; calculating a measure of the deviance of the case deleted estimates from the actual outcome values in the input data; and outputting the calculated deviance measure to the data storage for retrieval by a user.

Description

CROSS REFERENCE TO RELATED APPLICATIONS[0001]This application is a continuation under 35 U.S.C. §120 of International Application No. PCT / GB2011 / 052296, filed Nov. 23, 2011, and claims priority under 35 U.S.C. §119(a) to Great Britain Application No. 1020091.3, filed Nov. 26, 2010, the entire contents of each of which is hereby fully incorporated herein by reference.FIELD OF THE INVENTION[0002]The present invention relates to analysis of electronic data which comprises, for each of a set of physical entities, attribute values representing attributes of the respective physical entity and an outcome value representing an observed outcome for the respective physical entity. Such analysis is widely used to generate a model for predicting the outcome value (that is, the most likely outcome or value of a chosen metric) for another physical entity of the same type.BACKGROUND OF THE INVENTION1.1 Current Statistical Techniques[0003]1.1.1 Current modelling techniques use the generalised linea...

Claims


Application Information

Patent Timeline
Patent Type & Authority Applications(United States)
IPC IPC(8): G06F17/18
CPCG06F17/18G06F30/20
Inventor LOVICK, TONY
Owner TOWERS PERRIN CAPITAL
Why Eureka
Try Eureka