Method of determining active concentration

a bioanalyte and active concentration technology, applied in the direction of instruments, scientific instruments, measurement devices, etc., can solve the problems of uncertainty in the activity of the standard, no standard is available, many established methods for measuring protein concentration do not distinguish between active and inactive molecules, etc., and achieve the effect of convenient implementation

Inactive Publication Date: 2014-05-29
CYTIVA SWEDEN AB
View PDF3 Cites 11 Cited by
  • Summary
  • Abstract
  • Description
  • Claims
  • Application Information

AI Technical Summary

Benefits of technology

[0018]The method of the invention may conveniently be implemented by software run on an electrical data processing device, such as a computer. Such software may be provided to the computer on any suitable computer-readable medium, including a record medium, a read-only memory, or an electrical or optical signal which may be conveyed via electrical or optical cable or by radio or other means.

Problems solved by technology

In many cases, however, no standard is available or the activity of the standard is uncertain.
However, many established methods for measurement of protein concentration do not distinguish between active and inactive molecules.
This approach although efficient in many cases has several limitations.
Firstly, the degree of transport limitation is highly dependent on the immobilization level where too low immobilization levels result in data with too little transport limitation, and too high immobilization levels may lead to hook effects (i.e. the response is reduced above a certain immobilization level).
Secondly, the dynamic range, i.e. the concentration range over which the assay is useful, is limited.
Further, the method is time-consuming since two cycles / sample concentration are required.

Method used


Image

  • Method of determining active concentration
  • Method of determining active concentration
  • Method of determining active concentration

Examples


example 1

[0085]A procedure for determining active concentration by the method of the present invention using, for example, a modified Biacore® T200 system may be performed as follows:

[0086](Note that this description is focused on the CFCA experiment itself and that other assay development steps, such as selection of immobilization method, buffer conditions and regeneration conditions, have already been performed.)

1) Immobilize the ligand on discrete spots / channels on the sensor surface using a suitable immobilization technique (amine coupling, thiol coupling, biotinylation and capture on streptavidin or by immobilizing other tag or domain specific capture reagents). Note the immobilization levels.

2) Leave one spot without immobilized ligand for referencing.

3) Prepare serial dilutions (typically in steps of two to five) of the sample.

4) Use the Method Builder software to set up the assay with the following assay steps:

a) startup cycles used for conditioning of the system Startuo cycles are t...

example 2

Simulations of Initial Binding Rates

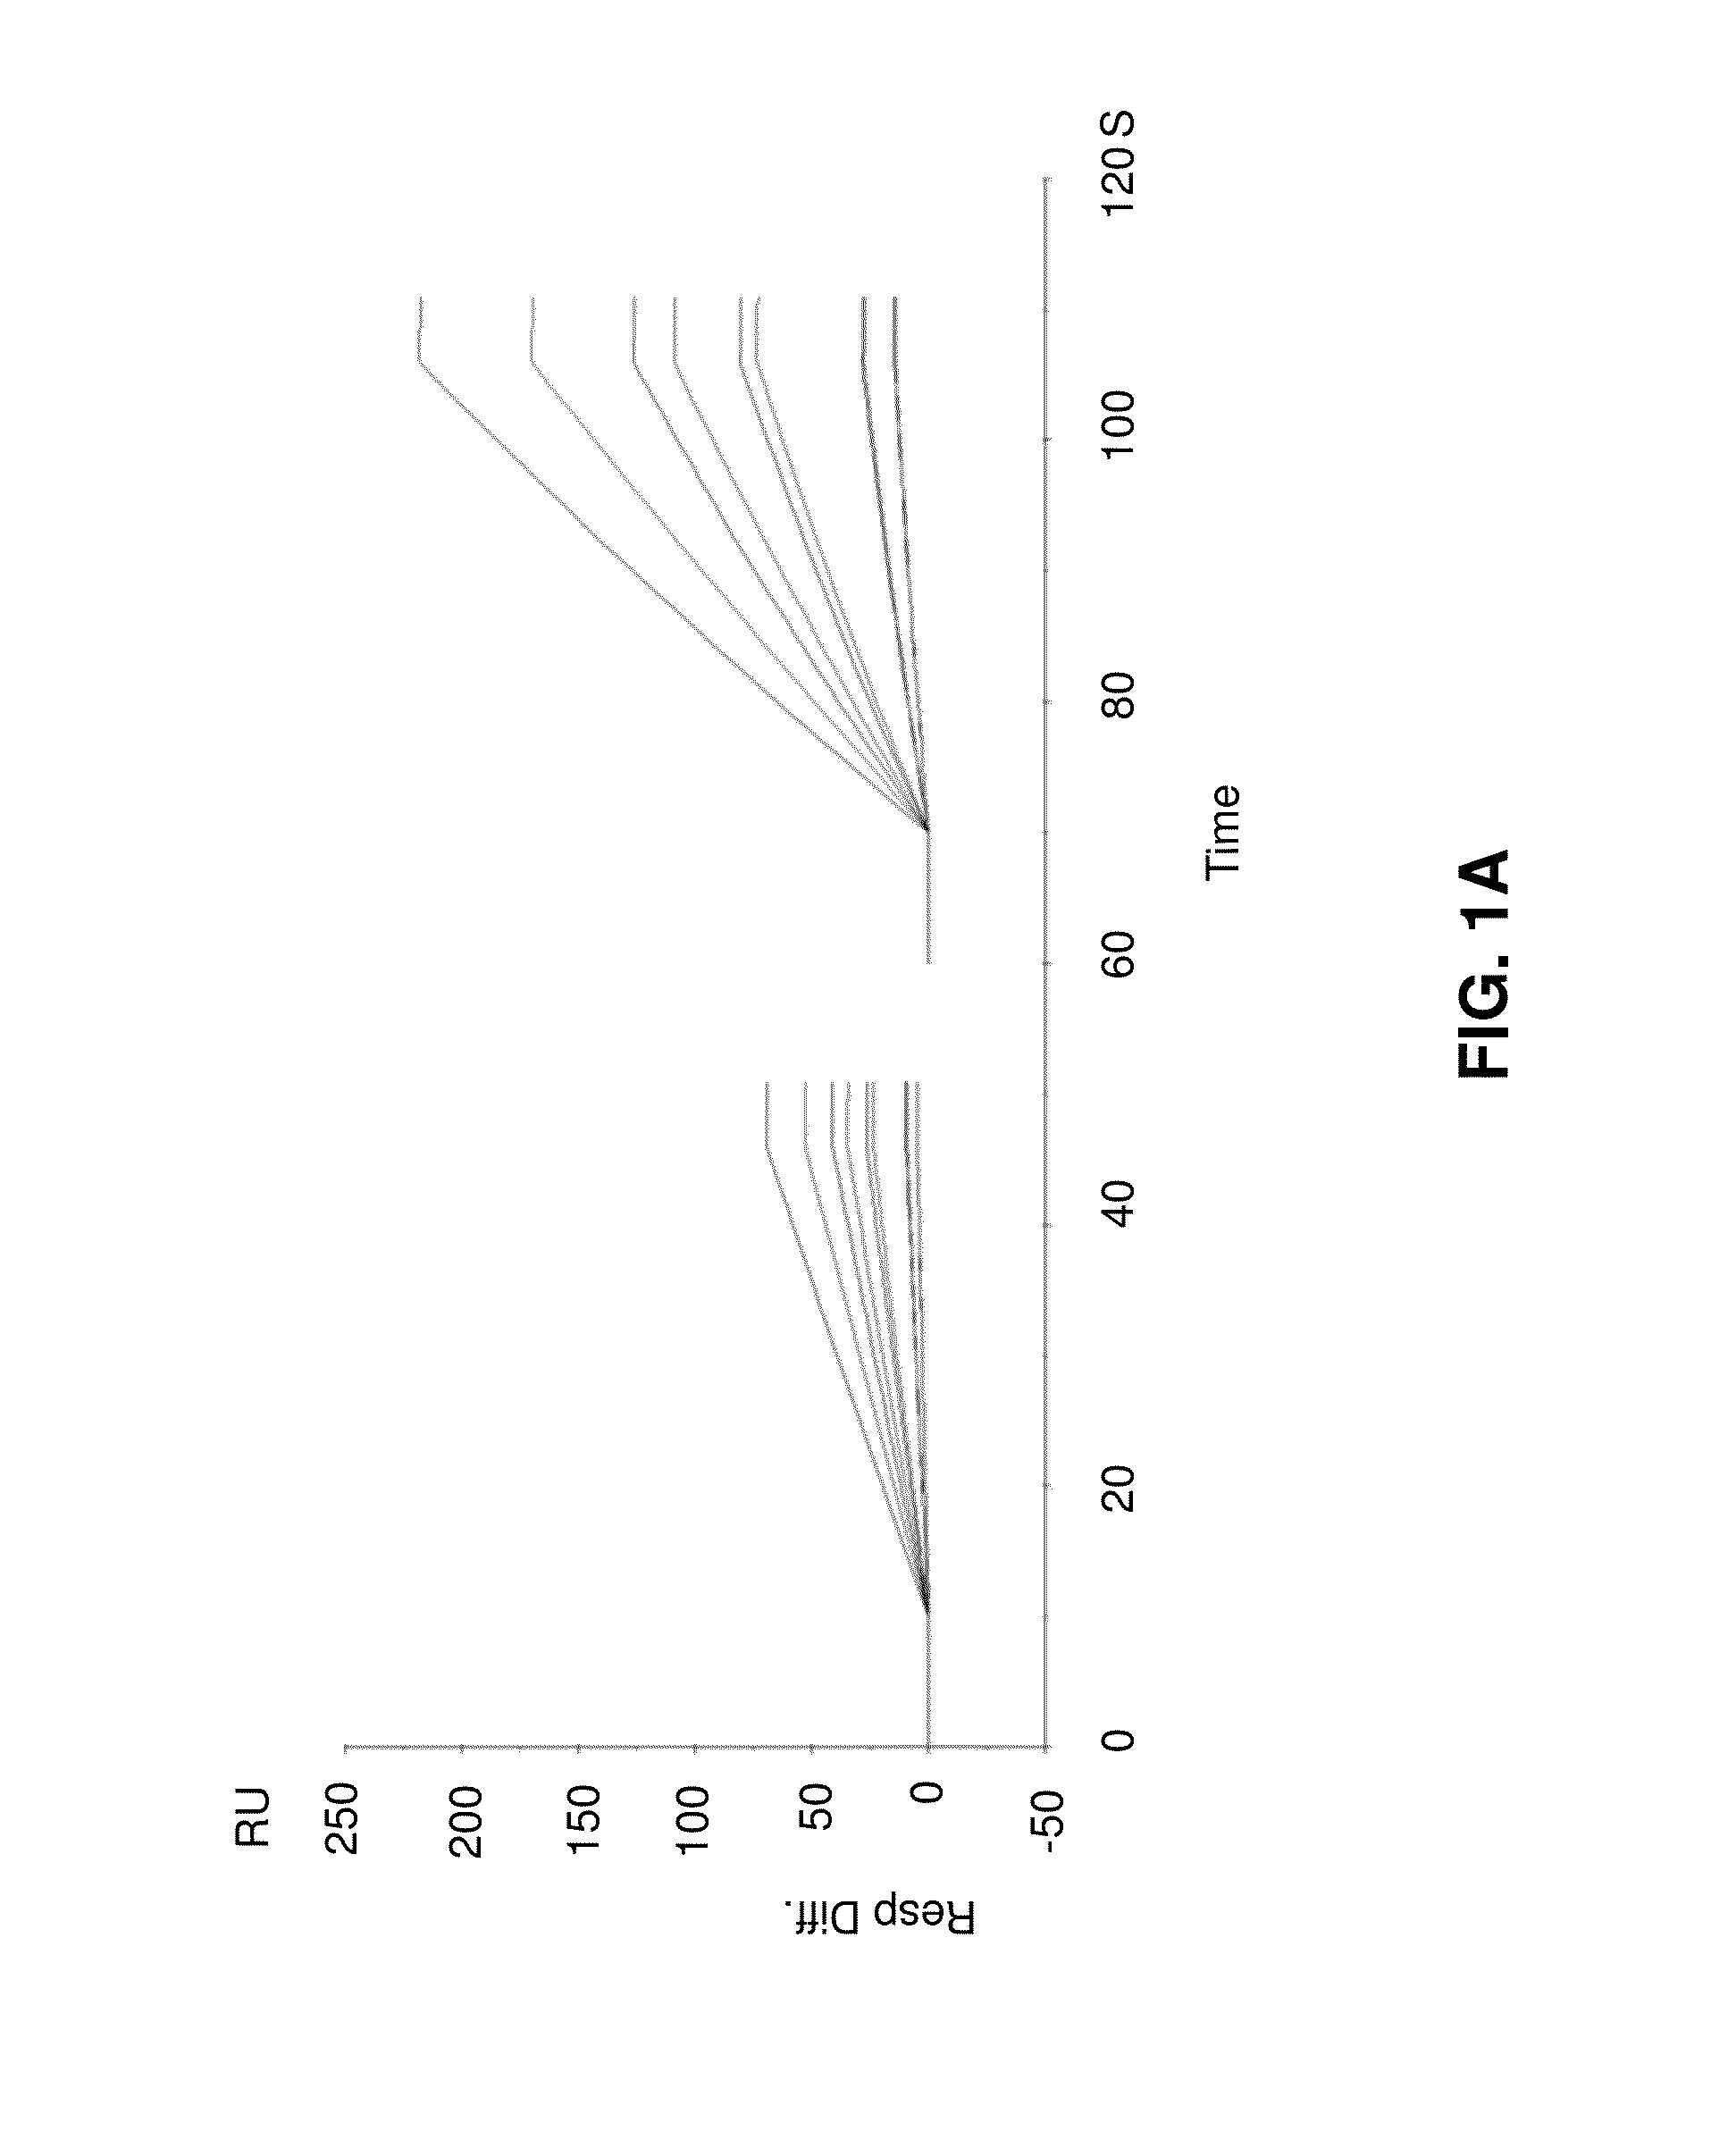
[0096]In the following, example data from simulations of initial binding rates will be described with reference to FIGS. 1A to 1D.

[0097]FIG. 1A shows overlay plots of simulated data. In the left panel, the concentration is 3 nM (dilution factor 10). Ligand levels giving rise to binding capacities of 50, 100, 300, 500 and 1000 RU, ka 1e6, kd 1e-3, kt 1e9 (red) or 2e9 (blue). In the right panel, the concentration is 10 nM (dilution factor 3). All other parameters are as in the left panel.

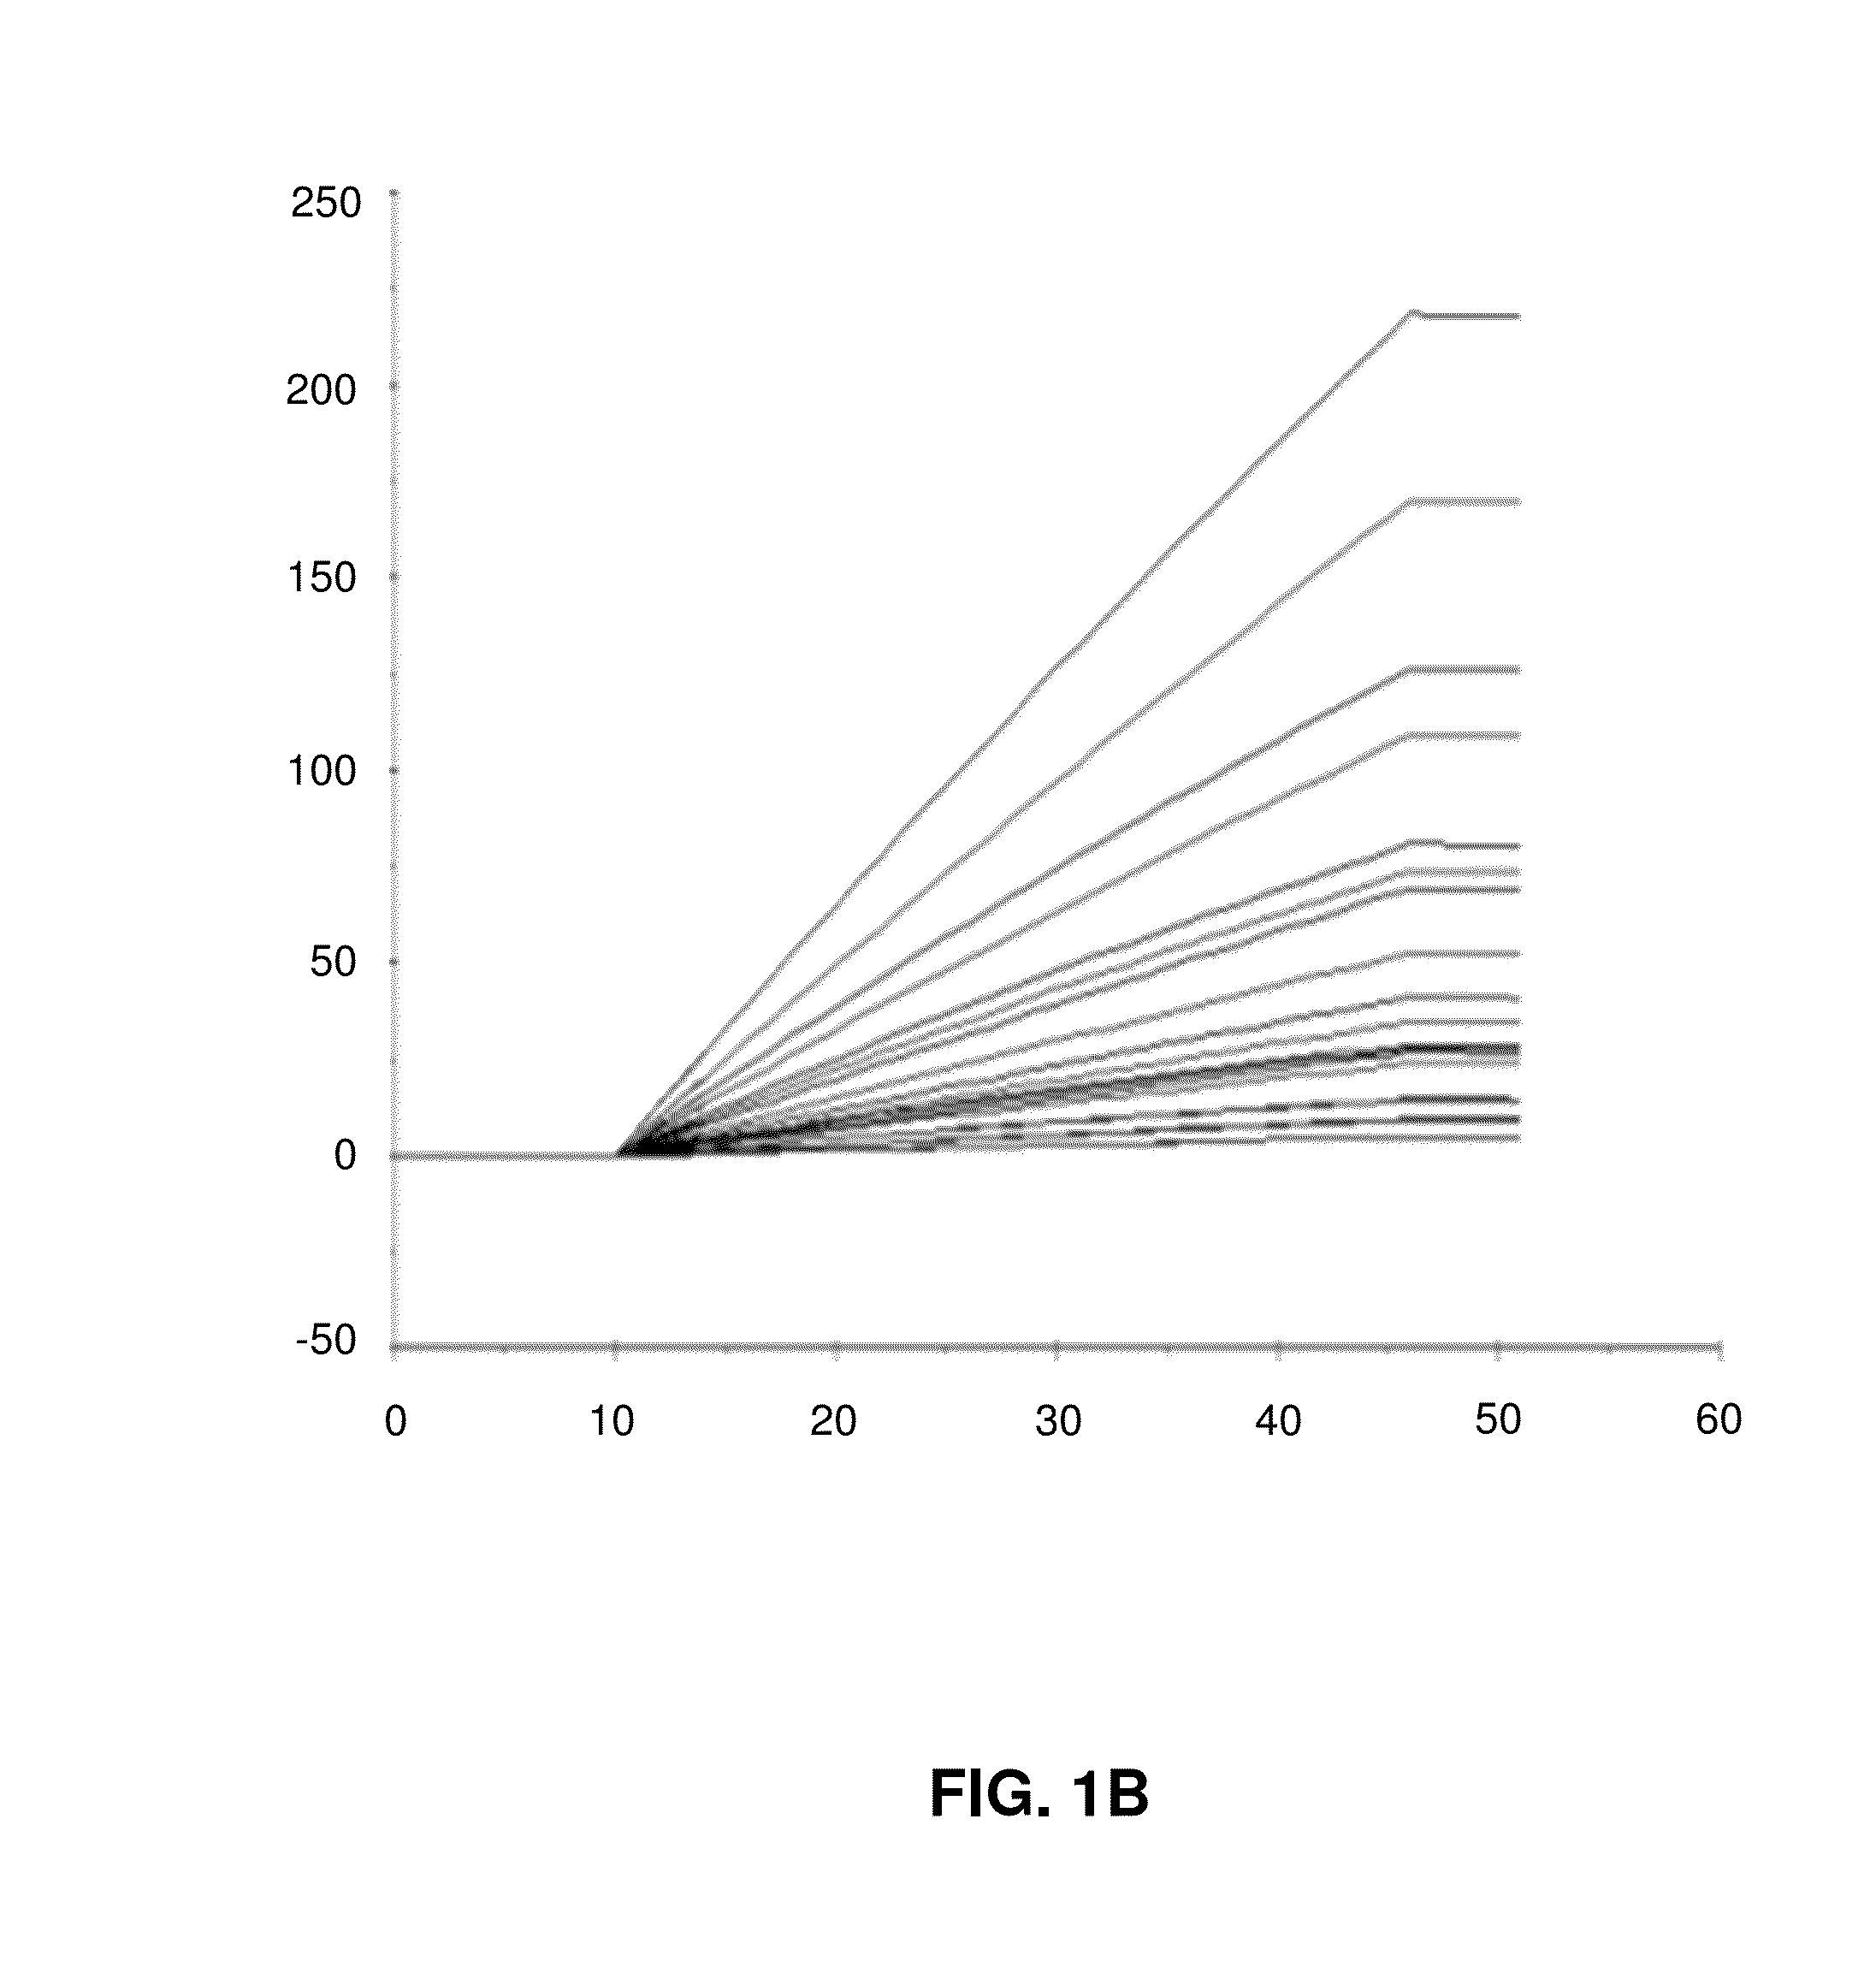
[0098]FIG. 1B shows a linear fit of binding data with a 3 seconds window 1 to 4 seconds into the injection.

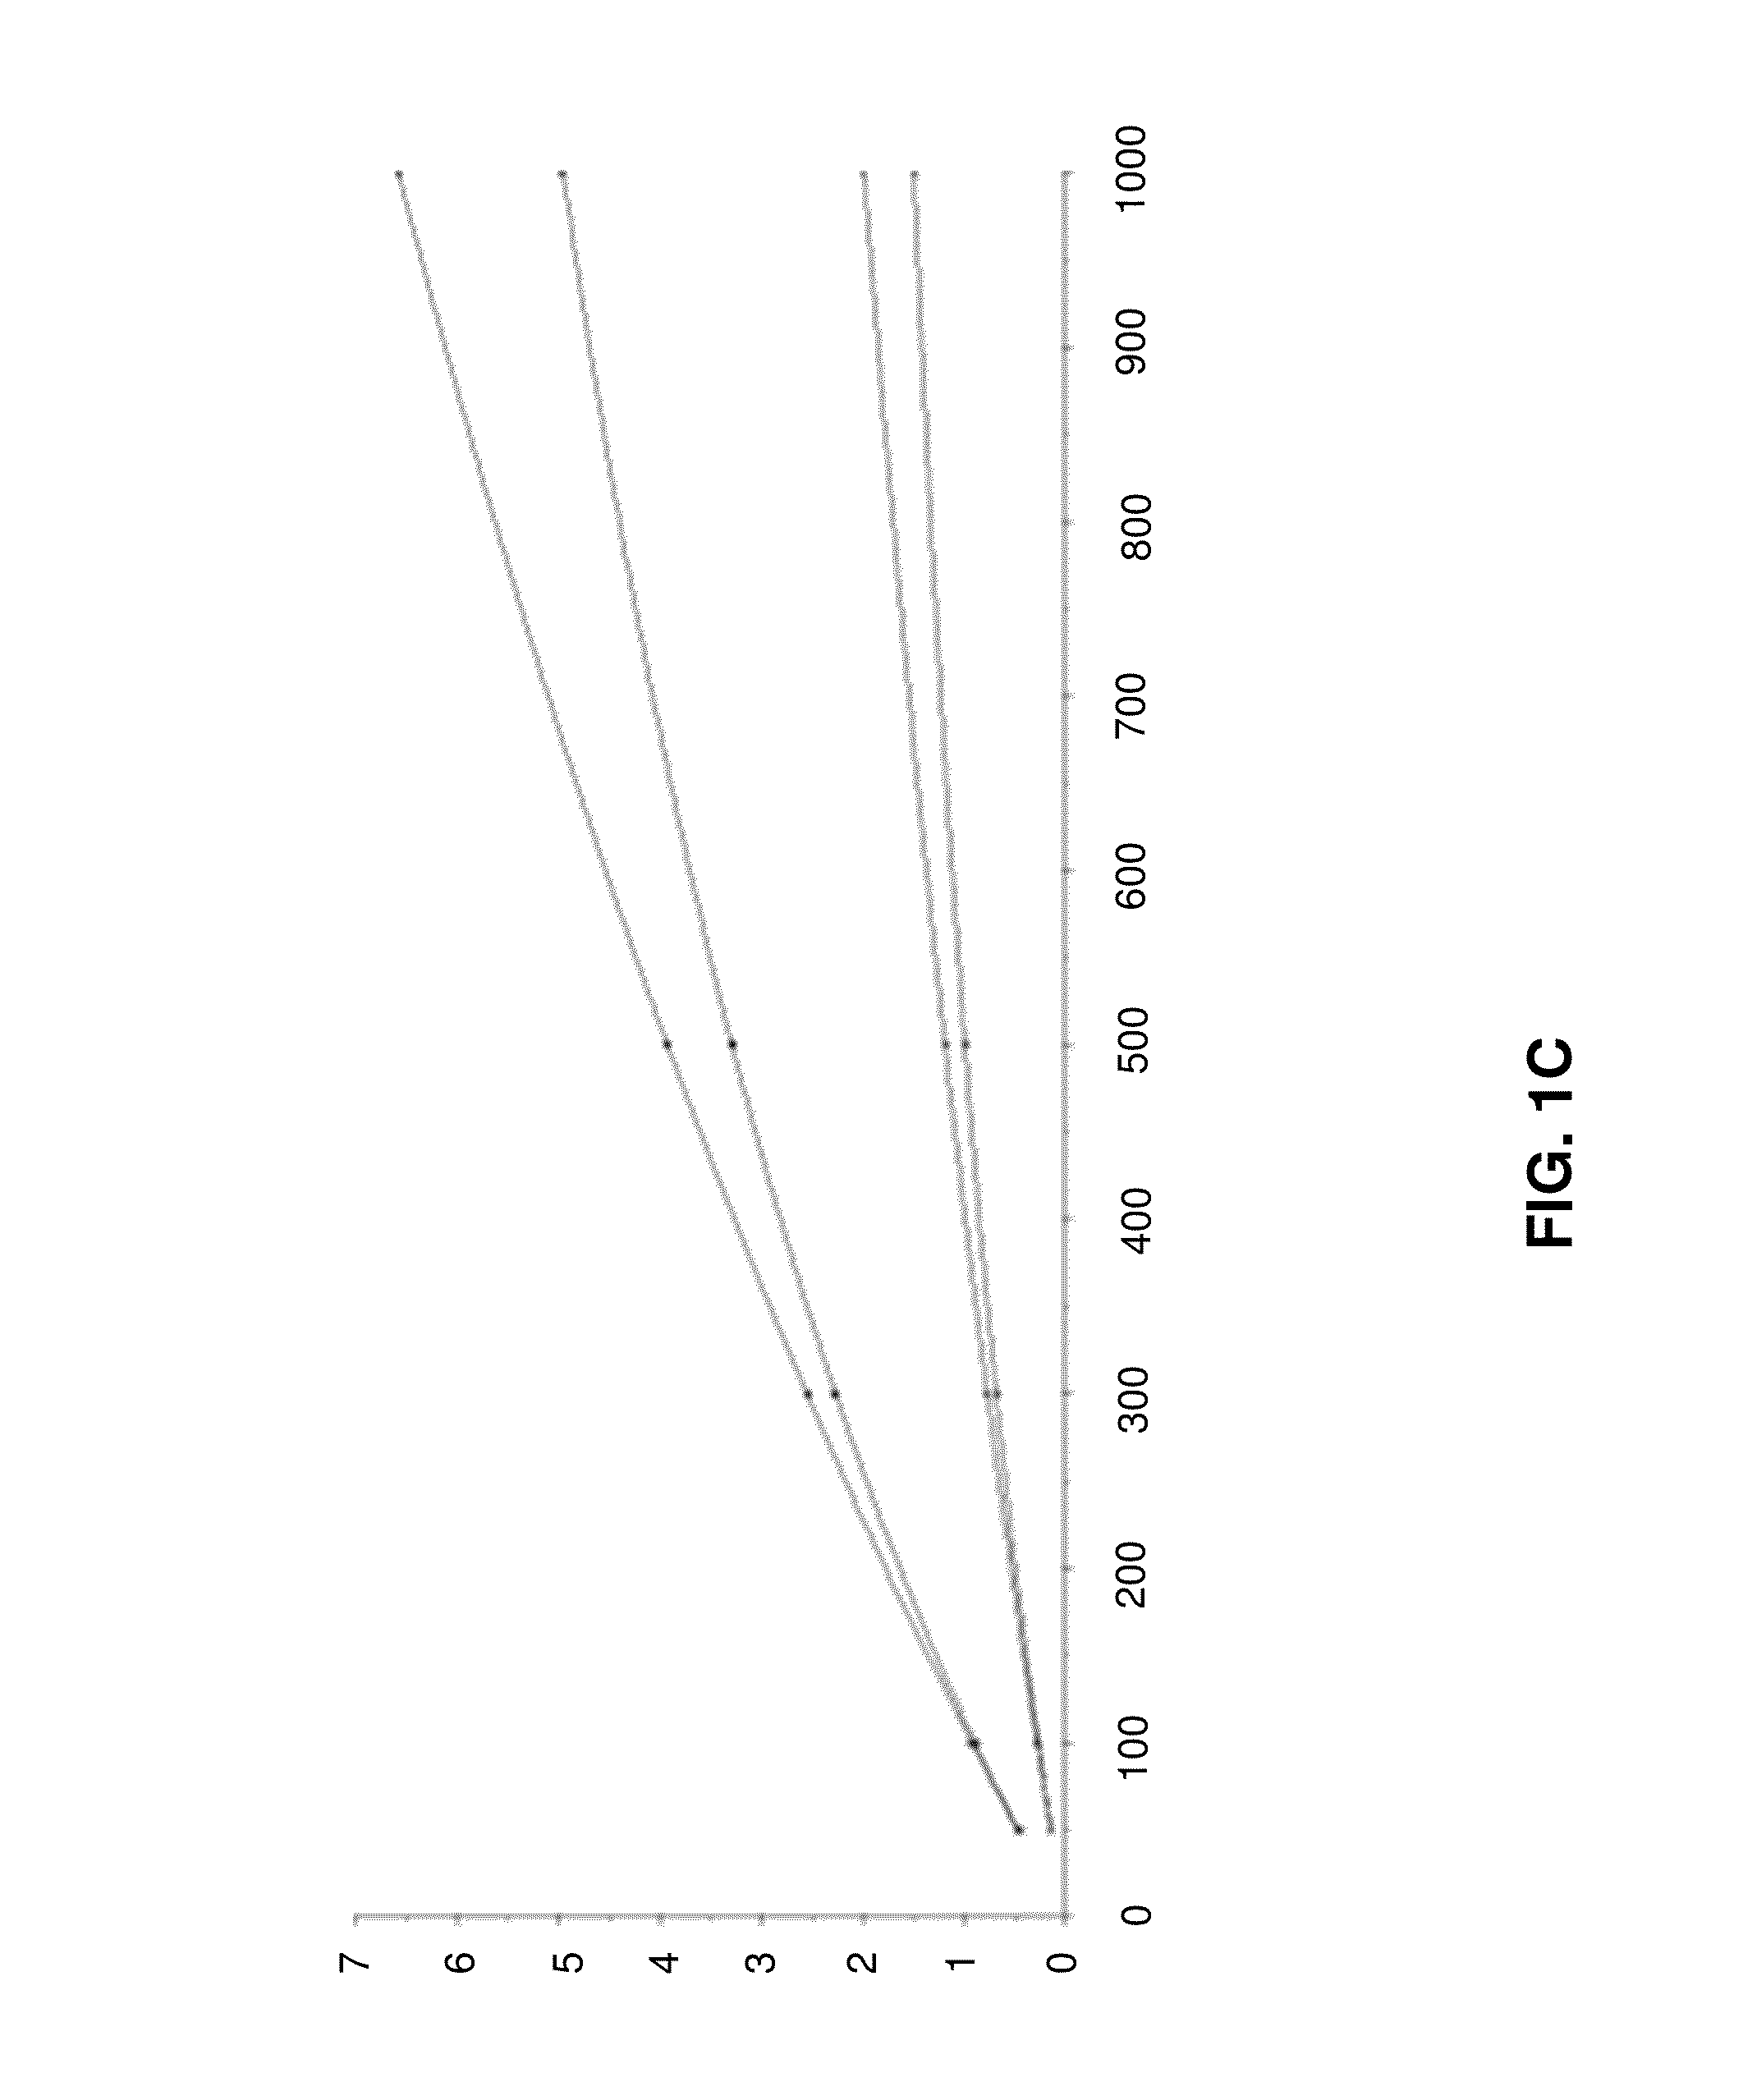
[0099]FIG. 1C shows a global fit using a modified 4-parameter equation. Binding rates for each concentration at both flow rates are plotted versus ligand density (Rmax). Data returned by analysis: Rhi, Chî2, concentration of undiluted sample 302,62E-06 30 nM.

[0100]FIG. 1D shows binding rate ratio plotted versus ligand density (Rmax). Note that data overlap. Rh...

example 3

Analysis of Binding Data Obtained with Immobilized Anti Beta-2-Microglobulin Antibody and Beta-2-Microglobulin

[0101]In this example the antibody was immobilized at eight different binding levels (ranging from 435 to 13300 RU), and one concentration of beta-2-micro-globulin was injected at a flow rate of 5 μl / min. The binding data and a linear fit to data over a 5 s window are demonstrated in FIG. 2.

[0102]The initial binding rates (dR / dt) were plotted versus immobilization level (1 mm) and a fit of the data using equation (15) is illustrated in FIG. 3.

[0103]The concentration of beta 2 microglobulin was determined by dividing Rhi (in this case 4.81 RU / s with the relevant kt value 4, 9e8 RU / (M*s) giving an active concentration of 9.9 nM.

[0104]Data obtained at immobilization levels 4200 and 10400 RU were analysed at two flow rates as illustrated in FIG. 4. In this experiment the flow rate was initially five μl / min, and 15 seconds into the injection it is changed to 100 μl / min. An offset...


PUM

PropertyMeasurementUnit
flow rateaaaaaaaaaa
flow rateaaaaaaaaaa
flow rateaaaaaaaaaa

Abstract

A method of determining active concentration of an analyte in a sample comprises the steps of:
(a) contacting a laminar flow of the sample with a plurality of solid phase surfaces or surface area supporting a ligand capable of specifically binding the analyte, each surface or surface area having a different ligand density,
(b) determining the initial binding rate (dR/dt) of analyte to the ligand at each ligand-supporting surface or surface area,
(c) from the determined initial binding rates determining the initial binding rate corresponding to transport-limited interaction at the surfaces or surface areas, and
(d) from the initial binding rate determined in step (c) determining the active analyte concentration.

Description

FIELD OF THE INVENTION[0001]The present invention relates to the determination of the concentration of a bioanalyte, such as a protein, and more particularly to the determination of the active concentration of the bioanalyte.BACKGROUND OF THE INVENTION[0002]There are numerous ways to determine the concentration of proteins and other biomolecules, the majority of the methods involving comparison of the sample to a standard preparation. In many cases, however, no standard is available or the activity of the standard is uncertain.[0003]Many times it is also of importance to know the active concentration of bioanalytes rather than the total concentration which may include functionally inactive molecules. This is, for instance, the case in the development and production of biotherapeutics. However, many established methods for measurement of protein concentration do not distinguish between active and inactive molecules.[0004]Thus, whereas the total concentration of e.g. a protein is typi...

Claims


Application Information

Patent Timeline
Patent Type & Authority Applications(United States)
IPC IPC(8): G01N33/543
CPCG01N21/553G01N21/77G01N33/54373G01N33/54306
Inventor KARLSSON, ROBERTROOS, HAKAN
Owner CYTIVA SWEDEN AB
Why Eureka
Try Eureka