Urine component analysis device and urine component analysis method

Active Publication Date: 2014-07-24
OMRON HEALTHCARE CO LTD +1
1 Cites 0 Cited by

AI-Extracted Technical Summary

Problems solved by technology

However, the method in Patent Document 1 (Japanese Patent Publication No. 3823039) has a problem that when measurement is performed every day over a long period of time, a subject is required to collect a part of urine every time the subject discharges urine, thus causing a nuisance to the subject.
For example, it is quite a nuisance and difficult to practice on a daily basis that a subject goes out with a container and collects urine at a place of visit.
Also, the method in Patent Document 2 (Japanese Patent Publication No. 4329...

Benefits of technology

[0023]According to a urine component analysis device and a urine component analysis method of the present invention, an excretio...

Abstract

A urine component analysis device with a correlation storage section stores data indicating a correlation between a measured concentration of a specific component in human urine and measured concentration of the specific urine component in one day. A data input section inputs data indicating concentration of the specific component in one subject's urine. A concentration of the specific component in total urine of the subject in one day is determined by conversion using the correlation storage section based on the concentration of the specific component in the urine. A total urine amount acquirement section acquires total amount of urine excreted by the subject in one day based on conversion or database. An excretion amount of the specific component in total urine of the subject in one day is calculated by multiplying the concentration of the specific component in total urine in one day, by the acquired total urine amount.

Application Domain

Biological testingSpecial data processing applications +1

Technology Topic

UrologyUrine output +3

Image

  • Urine component analysis device and urine component analysis method
  • Urine component analysis device and urine component analysis method
  • Urine component analysis device and urine component analysis method

Examples

  • Experimental program(4)

Example

First Embodiment
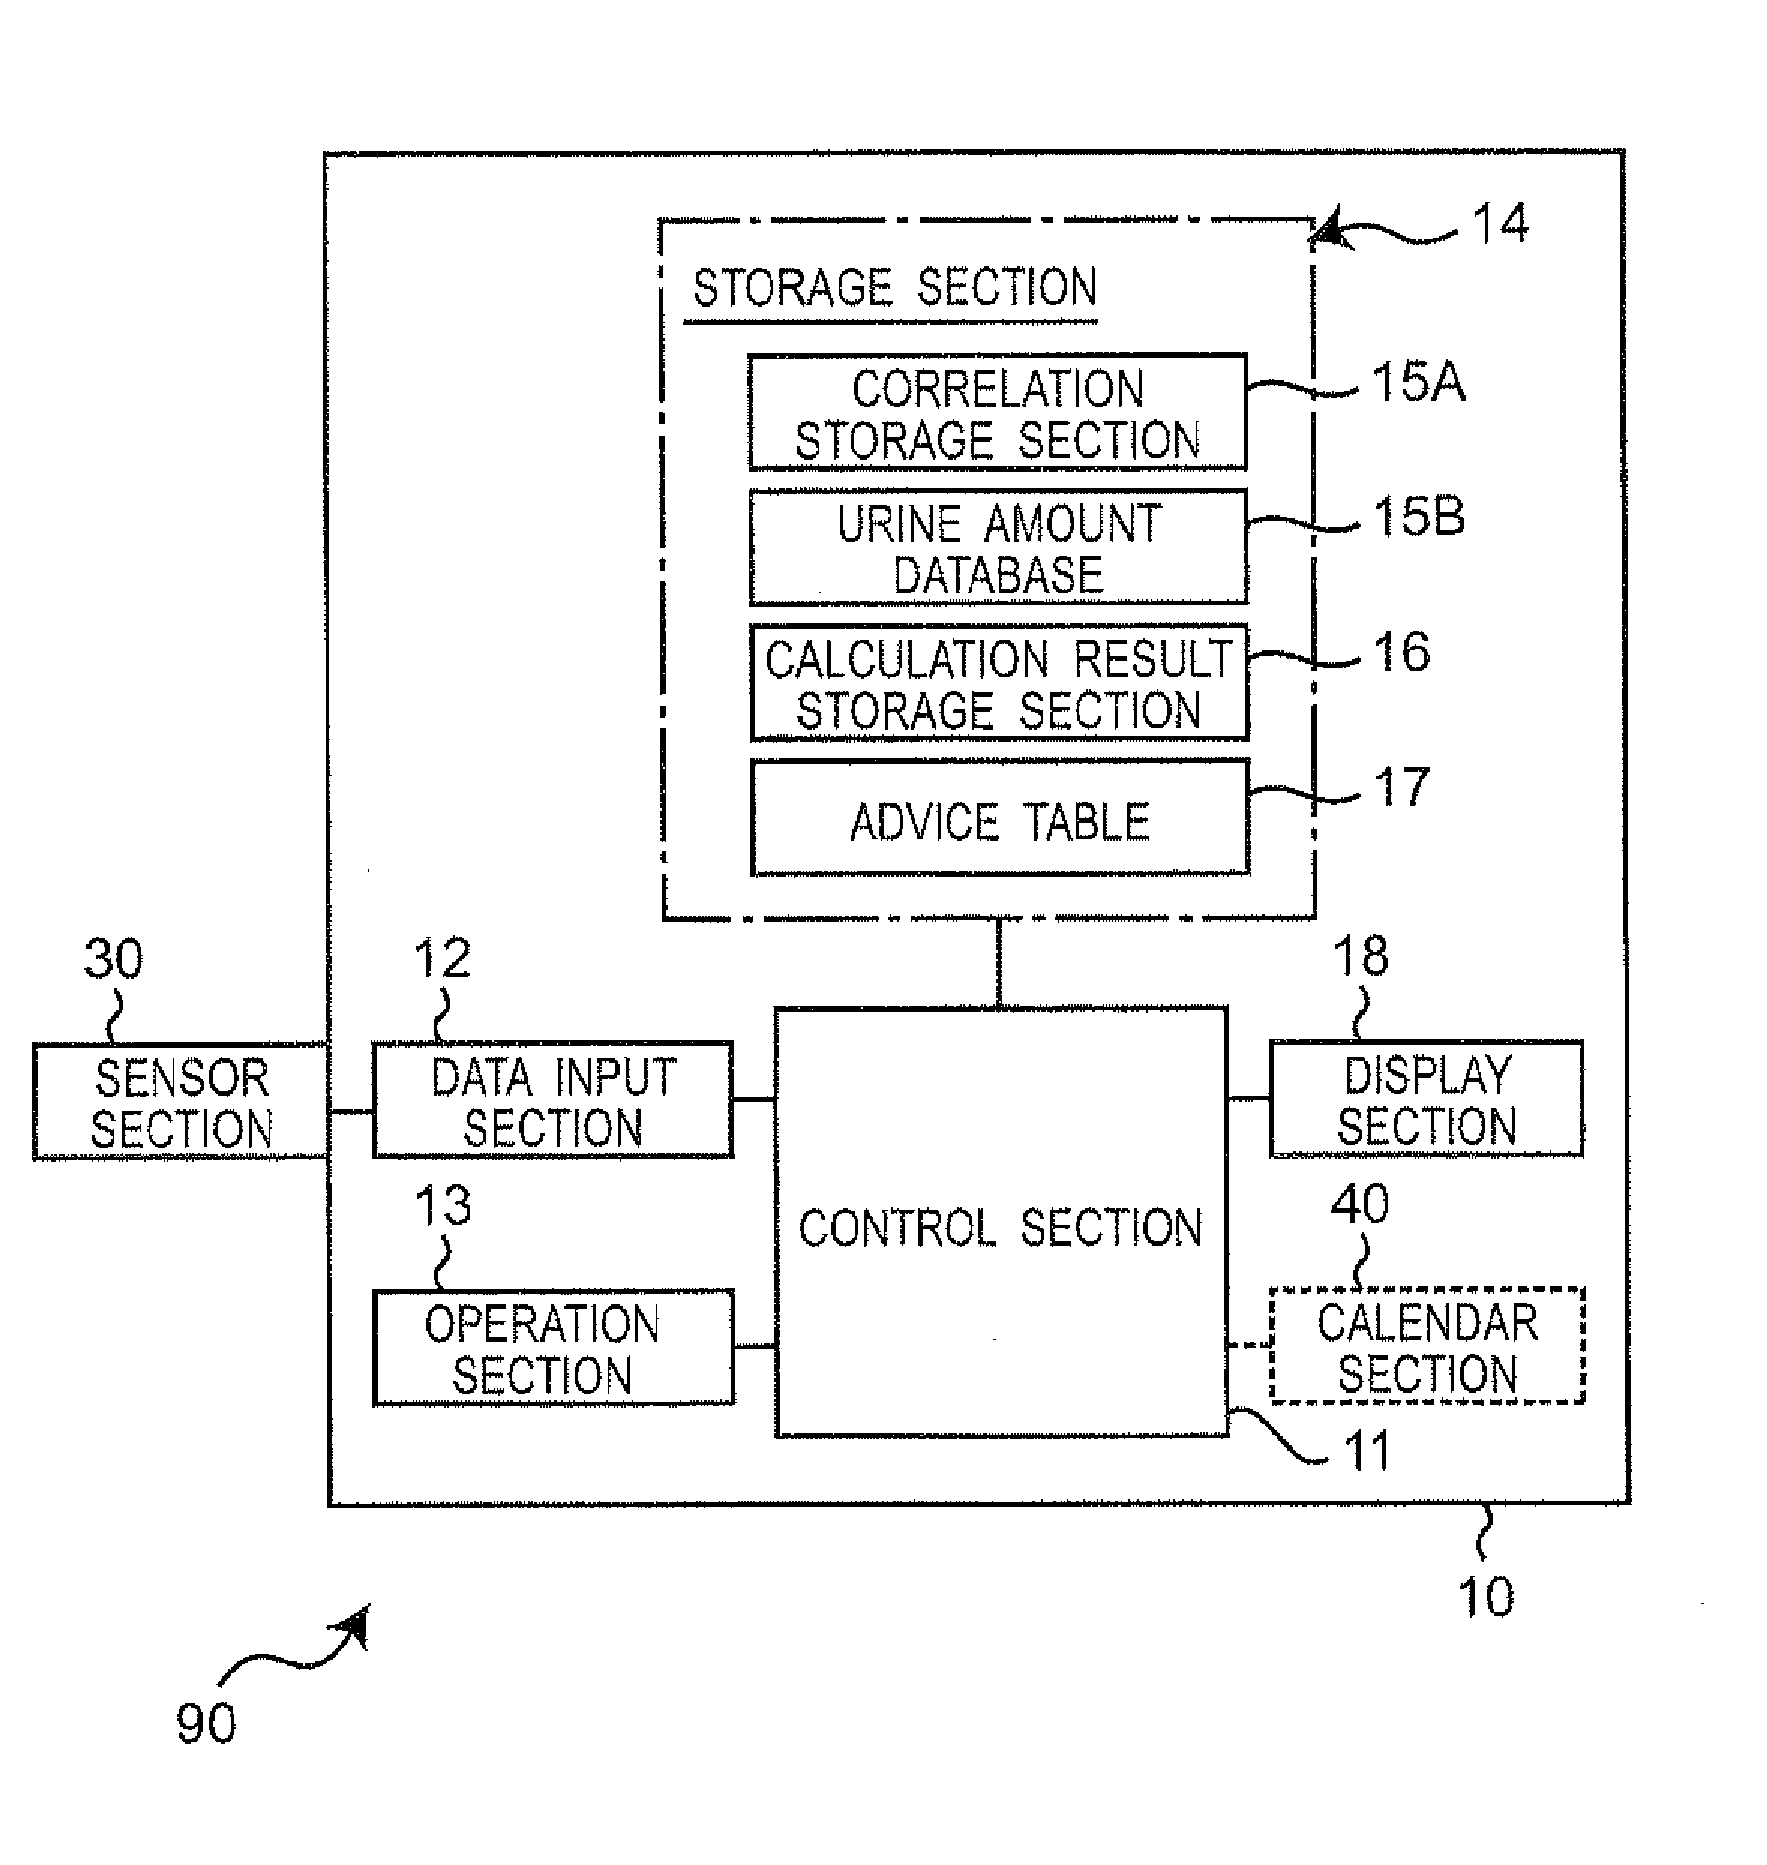
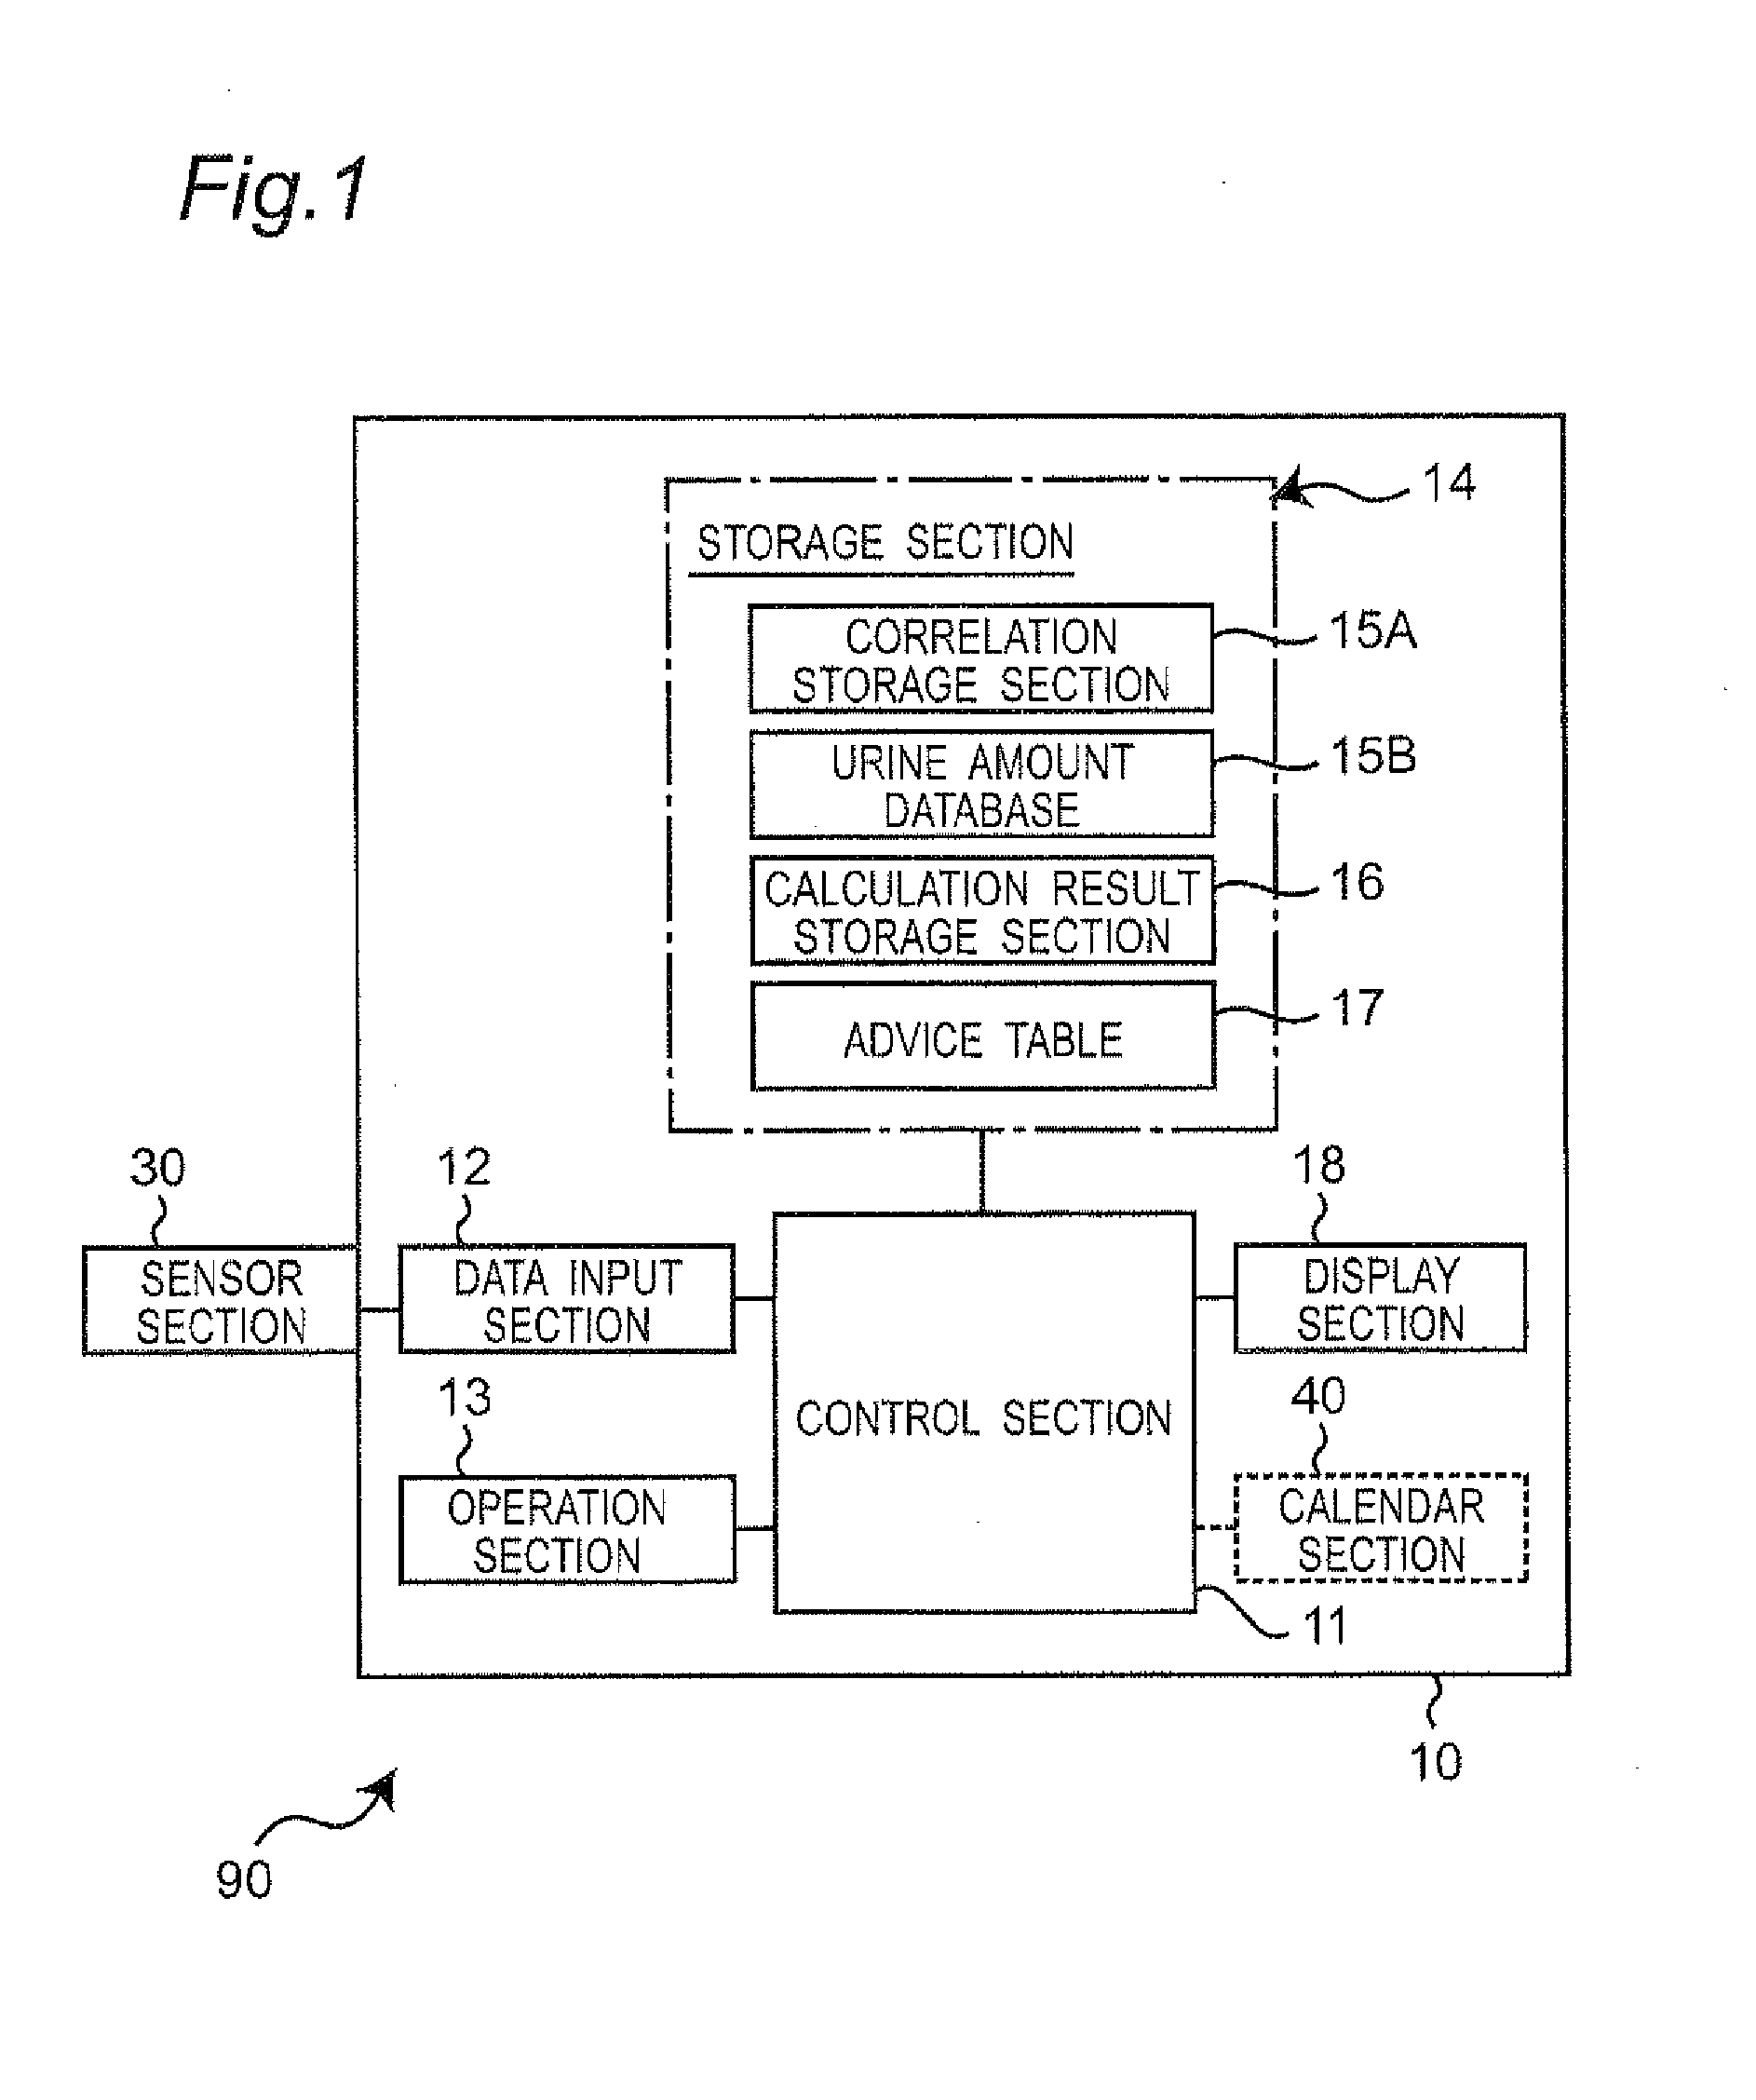
[0047]FIG. 1 shows a block configuration of a urine component analysis device (denoted by symbol 90 as a whole) of one embodiment of the present invention.
[0048]The urine component analysis device 90 includes a housing 10, a control section 11 mounted and stored in the housing 10, a data input section 12, an operation section 13, a storage section 14 and a display section 18 as a notification section. Further, the urine component analysis device 90 includes a sensor section 30 attached to the housing 10 so as to be projected to outside from the housing 10.
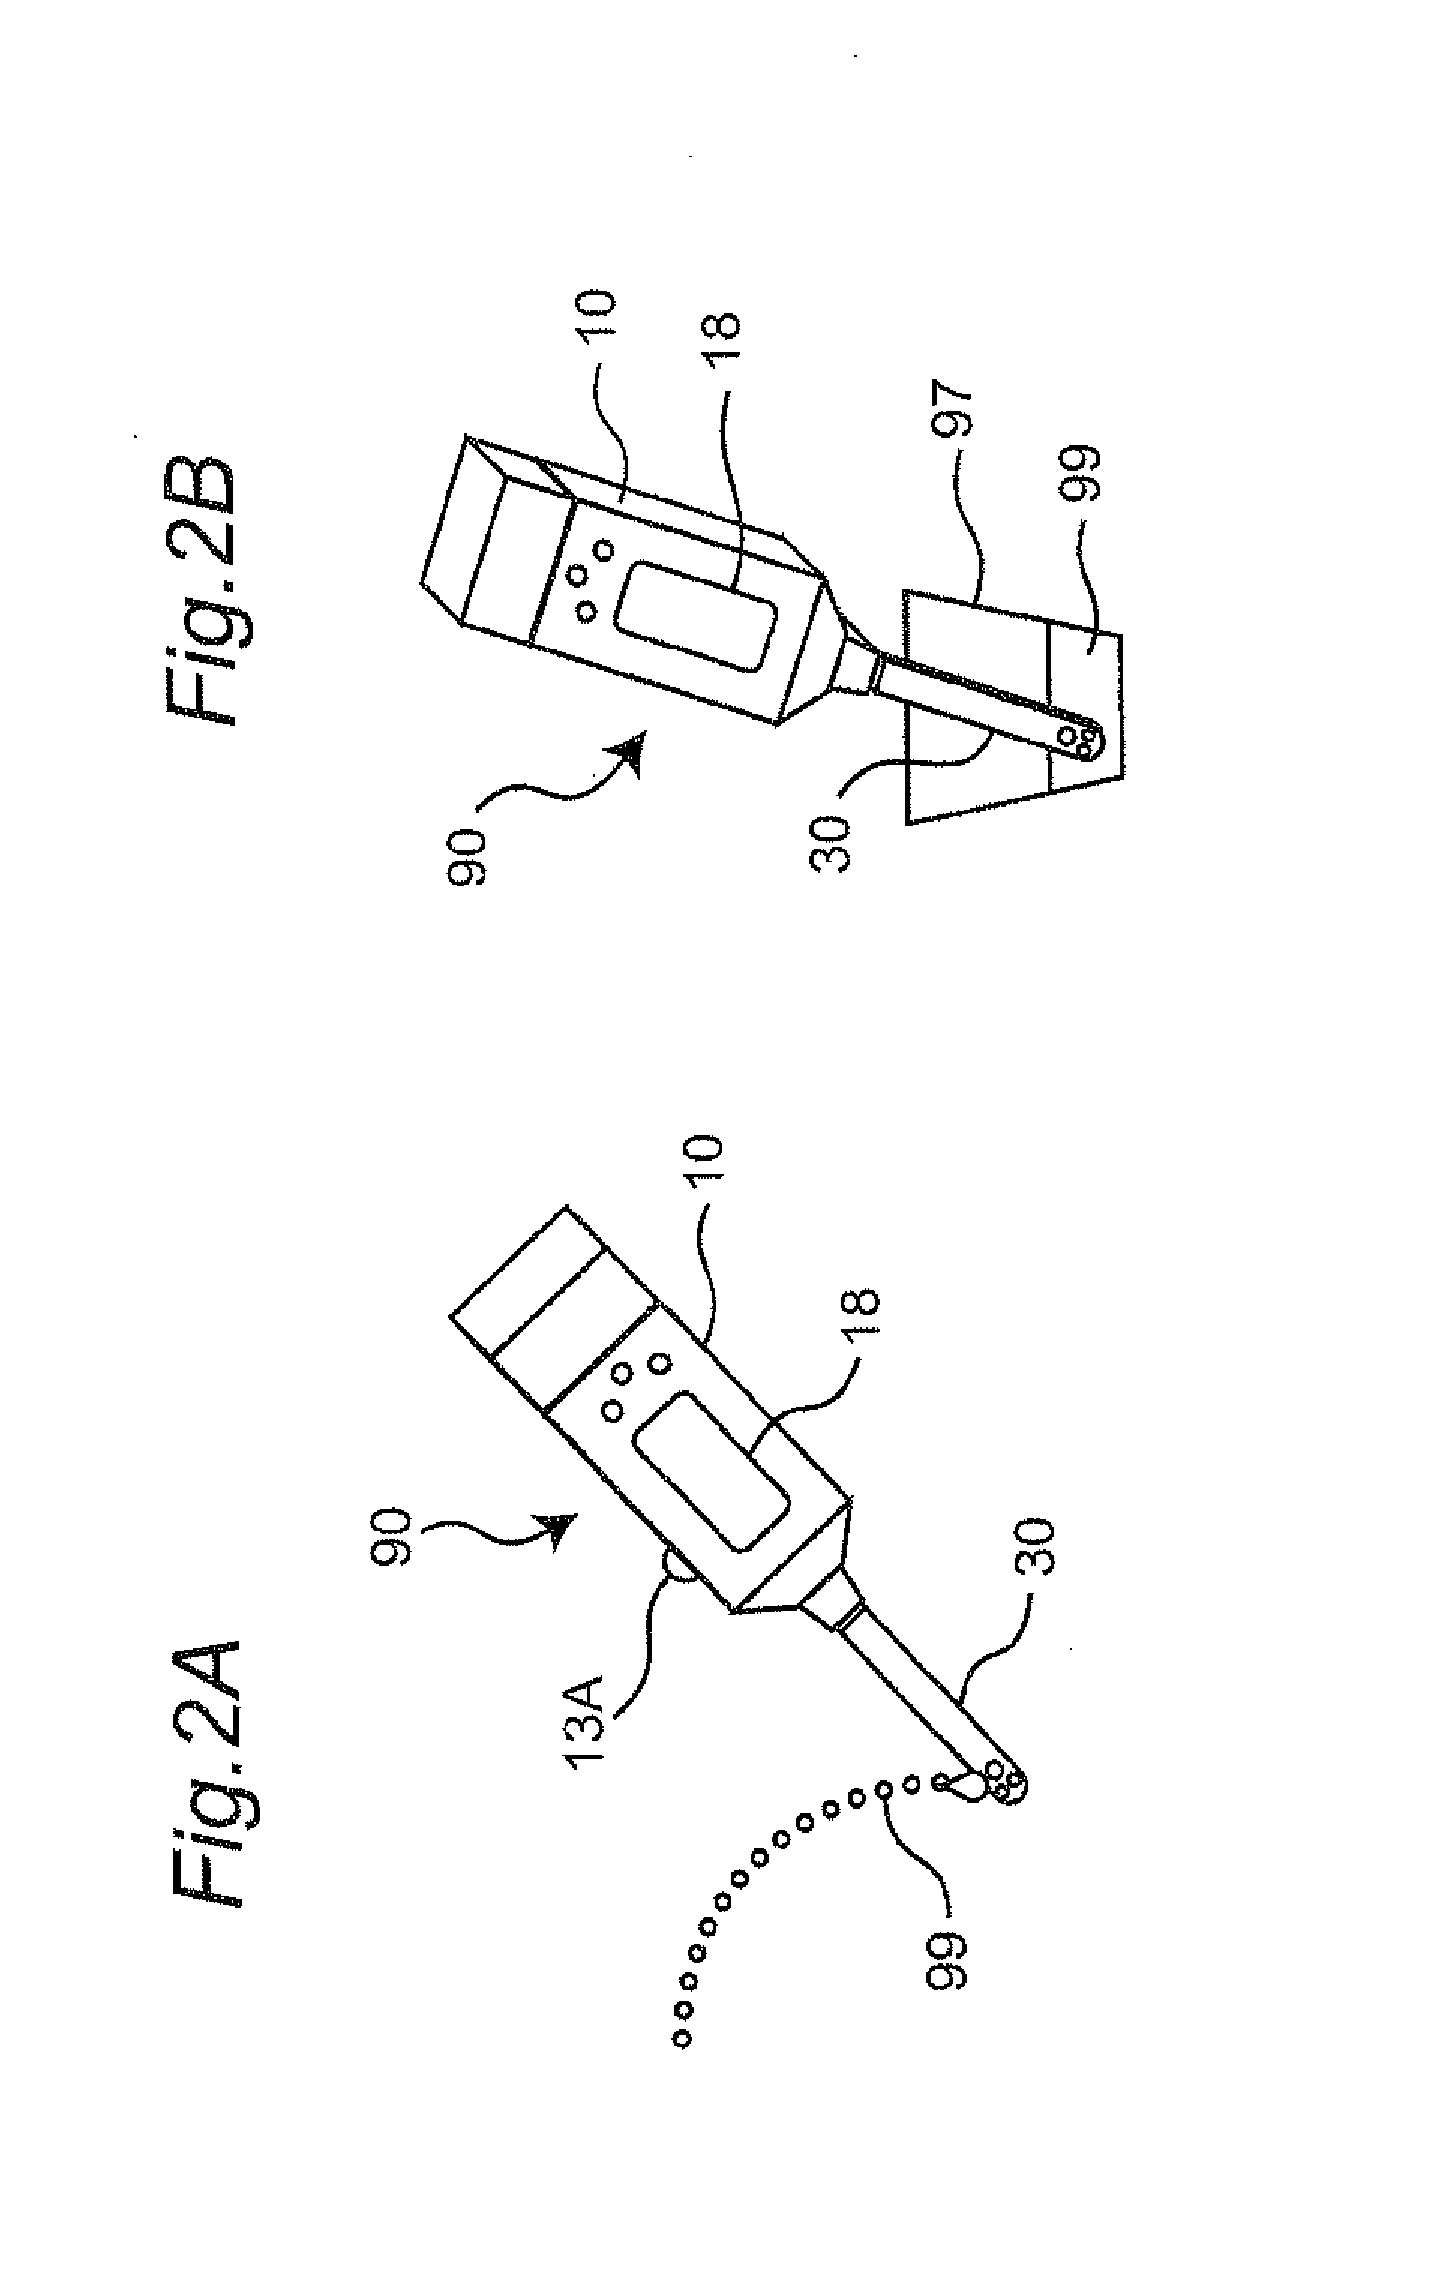
[0049]In this example, the housing 10 has a narrow and long prism-like external shape so that the housing is held by the user's hand as shown in FIG. 2A. The sensor section 30 is attached at one end of the housing 10 and has a narrow and long rod-like external shape. As a result, the urine component analysis device 90 is formed as a hand-held type urine component analysis device that is used by a user with the housing 10 held in the hand.
[0050]The sensor section 30 is one publicly known, and it comes into contact with urine 99 excreted by the subject to acquire data about a concentration of a specific component in the urine. In this example, the specific component is salt (NaCl. Referred to as “salinity” as appropriate). In this example, the sensor section 30 may acquire data indicating a NaCl concentration (or Na concentration) in one urine 99.
[0051]For example, when the hand-held type urine component analysis device 90 is used, urine is spritzed on the sensor section 30 as shown in FIG. 2A with the housing 10 held in the hand when the subject as a user discharges urine. In this way, the sensor section 30 can come into contact with urine excreted by the subject to acquire data about a NaCl concentration.
[0052]Alternatively, when the subject as a user discharges urine, the subject may collect a part of one urine 99 in a disposable paper cup 97, and immerse the sensor section 30 in the urine 99 in the paper cup 97 with the housing 10 held in the hand as shown in FIG. 2B.
[0053]Alternatively, when the subject as a user discharges urine, the subject may infiltrate a part of one urine into a sheet of toilet paper (not illustrated), and bring the sensor section 30 into contact with the urine infiltrated in the sheet of toilet paper with the housing 10 held in the hand.
[0054]In any case, according to the hand-held type urine component analysis device, a later-described calculation result is obtained by simple operations.
[0055]The control section 11 shown in FIG. 11 includes a CPU (central processing unit) operated by software, and acts as a first calculation section and a second calculation section etc. to execute various kinds of processing.
[0056]The data input section 12 inputs, in real time in this example, data about a concentration of a specific component in the urine acquired by the sensor section 30.
[0057]The operation section 13 includes a scroll button 13A shown in FIG. 2A, and acts to input various kinds of information from the user. Examples of information to be input include urine specification information indicating whether urine to be measured is the first urine after wake-up or the second urine after wake-up or the urine just before sleep, and information indicating a sex, an age, a blood pressure and a EMI (body mass index) of the subject. When urine specification information is input, the operation section 13 acts as a urine specification section.
[0058]The storage section 14 includes an EEPROM (an electrically rewritable nonvolatile memory) in this example, and includes a correlation storage section 15A, a urine amount data base 15B, a calculation result storage section 15 and an advice table 17.
[0059]As shown in, for example, FIGS. 5A and 5B, the correlation storage section 15A stores data indicating a correlation between a measured NaCl concentration in one urine and a measured NaCl concentration in total urine in one day (dots in the figure each represent measured data). Specifically, FIG. 5A shows a case where a relationship between a measured NaCl concentration in the first urine after wake-up (abscissa x, unit: [g/L]) and a measured NaCl concentration in total urine in one day (ordinate y, unit: [g/L]) is approximated by a straight line (shown by a solid line in FIG. 5A), and an expression of the straight line is stored as data indicating a correlation. In this case, it is shown that there is a high correlation with the correlation coefficient being r=0.78. FIG. 5B shows a case where a relationship between a measured NaCl concentration in the second urine after wake-up (abscissa x, unit: [g/L]) and a measured NaCl concentration in total urine in one day (ordinate y, unit: [g/L]) is similarly approximated by a straight line (shown by a solid line in FIG. 5B), and an expression of the straight line is stored as data indicating a correlation. In this case, it is shown that the correlation coefficient is r=0.81.
[0060]A case where an expression approximated by a straight line is stored as data indicating a correlation has been described as an example, but the present invention is not limited to this example. The correlation storage section 15A may store other functions, conversion databases and the like.
[0061]The measured NaCl concentration (or Na concentration) and later-described NaCl excretion amount (or Na excretion amount) in total urine of a subject are measured after all the urine excreted by the subject is gathered into one volume (stored-urine method; the same hereinafter).
[0062]The urine amount database 153 stores data indicating a total urine amount per day of a human in accordance with sex and age as shown in, for example, FIG. 6. In FIG. 6, the abscissa represents age (years) and the ordinate represents a total urine amount per day (average urine amount by age) (L), where dots in the figure each represent measured data. For the male, a case is shown where a relationship between age and a total urine amount per day is approximated by a straight line (shown by a solid line M in FIG. 6), and an expression of the straight line is stored as data indicating a correlation. In this case, the dispersion is R2=0.2243. For the female, a case is shown where a relationship between age and a total urine amount per day is approximated by a straight line (shown by a solid line F in FIG. 6), and an expression of the straight line is stored as data indicating a correlation. In this case, the dispersion is R2=0.1882. It is apparent that when conditions of sex and age are specified (input), a total urine amount per day of a human can be acquired by referring to the urine amount database 15B. Data in FIG. 6 is data measured by the present inventor.
[0063]The advice table 17 stores a salinity amount (NaCl amount) in correspondence with advices appropriate to the salinity amount for the subject as shown in, for example, FIG. 19. For example, the advice of “Ideal salinity intake” corresponds to a salinity amount falling within a range of 0 to 3 g. The advice of “Successful in salinity reduction” corresponds to a salinity amount falling within a range of 3 to 6 g. The advice of “Goal will be achieved with a little effort” corresponds to a salinity amount falling within a range of 6 to 7.5 g. The advice of “Salinity intake high and reduce salinity intake” corresponds to a salinity amount falling within a range of 7.5 to 9 g. The advice of “Salinity intake so high and take care of your dietary life” corresponds to a salinity amount of 9 g or more. The value range segmentation of the salinity amount in the advice table 17 is one example, and it is also possible to make a setting with the value range segmentation changed.
[0064]The calculation result storage section 16 shown in FIG. 1 sequentially stores calculation results (later-described NaCl concentration or Na concentration) in total urine of a subject in one day) from the control section 11 in correspondence with measurement dates and times, respectively. For example, the user can easily know a tendency of daily change in NaCl concentration (or Na concentration) in total urine of the subject in one day by reading the contents of the calculation result storage section.
[0065]The display section 18 includes an LCD (liquid crystal display device) (see FIG. 2A) in this example, and displays various kinds of information such as a calculation result from the control section 11.
[0066]The urine component analysis device 90 is operated under control by the control section 11 generally in accordance with a flow shown in, for example, FIG. 3.
[0067]i) First, for example when a user turns on a power switch (not illustrated), a urine specification mode is started as shown in Step S101 in FIG. 3.
[0068]In this example, the control section 11 acts as a urine specification section to display options of “first urine after wake-up”, “second urine after wake-up” and “urine just before sleep” etc. on the display section 18 in the urine specification mode. When the user rotates a scroll button 13A as these options are displayed, options of “first urine after wake-up”, “second urine after wake-up” and “urine just before sleep” etc. are sequentially highlighted as a selection candidate. For example, when the user depresses the scroll button 13A while “first urine after wake-up” is highlighted, “first urine after wake-up” is input as the urine to be measured. In a manner described above, the user inputs, via the operation section 13, urine specification information indicating whether urine to be measured is the first urine after wake-up or the second urine after wake-up or the urine just before sleep. When input of urine specification information is completed, a urine measurement mode is started.
[0069]If urine to be measured is always limited to, for example, “first urine after wake-up”, the urine specification mode (Step S101) can be skipped.
[0070]ii) Next, in the urine measurement mode, the user spritzes the urine 99 on the sensor section 30 as shown in, for example, FIG. 2A, and depresses the scroll button 13A. Then, as shown in Step S102 in FIG. 3, the sensor section 30 acquires data indicating a NaCl concentration in one urine 99, and the data input section 12 inputs in real time the data indicating a NaCl concentration in this example.
[0071]When this data input is completed, a first calculation mode is started.
[0072]iii) Next, in the first calculation mode, as shown in Step S103 in FIG. 3, the control section 11 acts as a first calculation section to determine a NaCl concentration for Na concentration) in total urine in one day when all the urine excreted by the subject in the one day is gathered into one volume, by performing conversion using a correlation (the correlation shown in FIG. 5A) stored in the correlation storage section 15, based on the NaCl concentration (Na concentration) in one urine 99 of the subject which is obtained via the data input section 12.
[0073]When the object to be converted is one associated with “second urine after wake-up”, the correlation shown in FIG. 5B is accordingly used.
[0074]When the conversion is completed, a total urine amount acquirement mode is started.
[0075]iv) Next, in total urine amount acquirement mode, a total amount of urine excreted by the subject in one day is acquired based on conversion or a urine amount database as shown in Step S104 in FIG. 3.
[0076]In a first total urine amount acquirement method, a total amount of urine excreted by the subject in one day is acquired based on the urine amount database 15B.
[0077]In this case, first the user inputs the sex and age of the subject via the operation section 13 as shown in Step S111 in FIG. 4A.
[0078]Specifically, the control section 11 acts as a condition input section to display on the display section 18 options of “male” and “female” as sex. When the user rotates the scroll button 13A as these options are displayed, options of “male” and “female” are sequentially highlighted as a selection candidate. For example, when the user depresses the scroll button 13A while “male” is highlighted, “male” is input as sex of the subject. When input of sex is completed, a mode of input of “age” is started.
[0079]In the mode of input of “age”, values indicating input candidates of age are displayed on the display section 18 in the ascending or descending manner when the user rotates the scroll button 13A. When the user depresses the scroll button 13A, a value displayed at this time is input as an age of the subject.
[0080]When input of age is completed, process proceeds to Step S112 in FIG. 4A, the control section 11 acts as a total urine amount acquirement section to acquire a total amount of urine excreted by the subject in one day, by referring to the urine amount data base 158, based on the input sex and age.
[0081]In this case, for acquiring a total urine amount excreted by the subject in one day, the user (or subject) should only input several conditions. Thus, time and labor for measuring a urine amount by the subject can be saved.
[0082]In a second total urine amount acquirement method, unlike the first total urine amount acquirement method, a total amount of urine excreted by the subject in one day is acquired based on conversion.
[0083]In this case, a total amount of urine (e.g. 3.9 [L]) excreted by the subject over a sampling period of one day or longer (e.g. three days) is measured beforehand.
[0084]First, the user inputs a number of days in the sampling period (three days in the above example) and a total urine amount in the sampling period (3.9 [L] in the above example) via the operation section 13 as shown in Steps S121 and S122 in FIG. 4B. The specific input process via the operation section 13 is similar to the foregoing input process of “age”.
[0085]Next, as shown in Step S123 in FIG. 45, the control section 11 acts as a total urine amount acquirement section to determine a total amount of urine excreted by the subject in one day by a division: (total urine amount in sampling period)/(number of days in sampling period). In the above example, the total amount of urine excreted by the subject in one day is determined as 3.9 [L]/3 days=1.3 [L/day].
[0086]In this case, the subject should measure a urine amount only during a sampling period. Thus, time and labor for measuring a urine amount by the subject can be reduced when measurement is continued over a long period of time.
[0087]When acquirement of a total urine amount is completed, a second calculation mode is started.
[0088]Steps S101 to S103 and Step S104 in FIG. 3 may be replaced with each other.
[0089]v) Next, in the second calculation mode, as shown in Step S105 in FIG. 3, the control section 11 acts as a second calculation section to determine a NaCl excretion amount in total urine of the subject in one day by multiplying the NaCl concentration in total urine in one day, which is determined in Step S103, by the total urine amount in one day acquired in Step S104.
[0090]vi) Then, as shown in Step S106, the NaCl excretion amount obtained by conversion is stored in a calculation result storage section 16 in correspondence with a measurement date and time. At the same time, the NaCl excretion amount obtained by conversion is displayed on the display section 18.
[0091]vii) As shown in Step S107, the control section 11 acts as an advice section to select an advice appropriate to the NaCl excretion amount (salinity amount) obtained by conversion, by referring to the advice table 17 (FIG. 19), and display on the display section 18 the advice along with the NaCl excretion amount (salinity amount) obtained by conversion.
[0092]For example, if the NaCl excretion amount (salinity amount) is 2 g, the numerical value and the advice of “Ideal value” are displayed.
[0093]Thus, In the urine component analysis device 90, a total urine amount excreted by a subject in one day is acquired based on conversion or a database, and therefore time and labor for performing urine amount measurement by the subject can be reduced or saved. Moreover, a NaCl concentration in total urine in one day when all the urine excreted by the subject in the one day is gathered into one volume is determined by performing conversion using the correlation stored in the correlation storage section 15A, based on the input NaCl concentration in one urine of the subject. As a result, accuracy of calculation of a NaCl excretion amount can be enhanced.
[0094]FIGS. 7A and 7B each show a result of examining a NaCl excretion amount in total urine in one day, which is obtained by conversion using one urine as described above, by using a measured NaCl excretion amount in total urine in one day, under the condition that a total amount of urine excreted by the subject in one day is acquired by the first total urine amount acquirement method (see urine amount database 15B). Specifically, FIG. 7A shows, for three or more subjects, a result of examining a state of correlation by matching a NaCl excretion amount ratio in total urine in one day (abscissa, unit: [g/day]), which is obtained by conversion using the first urine after wake-up, with a measured NaCl excretion amount in total urine in one day (ordinate, unit: [g/day]). In this result, a correlation is not so clearly shown because data of three or more subjects are not discriminated from one another. FIG. 7B shows, for subjects No. 2 and No. 6, results of determining a correlation coefficient by matching a NaCl excretion amount ratio in total urine in one day (abscissa x, unit: [g/day]), which is obtained by conversion using the first urine after wake-up, with a measured NaCl excretion amount in total urine in one day (ordinate y, unit: [g/day]). When the data of subject No. 2 is approximated by a straight line L2, the dispersion R2 is 0.2204. When the data of subject No. 6 is approximated by a straight line L6, the dispersion R2 is 0.6423. Thus, it has become apparent that when the data of subjects are discriminated from one another, a NaCl excretion amount in the urine excreted by the subject can be accurately determined.
[0095]FIG. 8A shows, for subject No. 2, a result of examining a daily NaCl excretion amount in total urine (data connected by a dashed line in the figure), which is obtained by conversion using one urine (first urine after wake-up), by using a measured daily NaCl excretion amount in total urine (data connected by a solid line in the figure), under the condition that the total urine amount in one day is acquired by the first total urine amount acquirement method (see urine amount database 153). FIG. 8B shows, for subject No. 6, a result of examining a daily NaCl excretion amount in total urine (data connected by a dashed line in the figure), which is obtained by conversion using one urine (first urine after wake-up), by using a measured daily NaCl excretion amount in total urine (data connected by a solid line in the figure), under the condition that the total urine amount in one day is acquired by the first total urine amount acquirement method (see urine amount database 15B).
[0096]In the result of examination for subject No. 6 in FIG. 8B, the daily NaCl excretion amount and the increase/decrease pattern thereof are substantially consistent between the converted value and the measured value. On the other hand, in the result of examination for subject No. 2 in FIG. 8A, the level of the converted value of the daily NaCl excretion amount is generally higher than the level of the measured value of the daily NaCl excretion amount. The reason for this may be that the actual total amount of urine excreted by subject No. 2 is shifted with respect to the total urine amount in one day acquired by referring to the urine amount database 15B for subject No. 2. However, the increase/decrease pattern of the daily NaCl excretion amount is substantially consistent between the converted value and the measured value. Therefore, the NaCl excretion amount obtained by conversion can be used as a criterion for improvement of life habits such as dietary life.
[0097]FIGS. 9A and 9B, 10A and 10B and 11A and 11B show, for the subject No. 2, results of examination when the method for acquiring a total amount of urine excreted by the subject in one day is variously changed.
[0098]Specifically, like FIG. 8A, FIG. 9A shows a result of examining a daily NaCl excretion amount in total urine, which is obtained by conversion using one urine, by using a measured daily NaCl excretion amount in total urine, under the condition that a total amount of urine excreted by the subject in one day is acquired by the first total urine amount acquirement method (see urine amount database 15B). FIG. 10A shows a result of examining a daily NaCl excretion amount in total urine, which is obtained by conversion using one urine, by using a measured daily NaCl excretion amount in total urine, under the condition that the total urine amount in one day is acquired by the second total urine amount acquirement method (converting the total urine amount during a sampling period by a number of days). FIG. 11A shows a result of examining a daily NaCl excretion amount in total urine, which is obtained by conversion using one urine, by using a measured daily NaCl excretion amount in total urine, under the condition that the total urine amount in one day (every day) is acquired by performing measurement. FIGS. 9B, 10B and 11B show average values obtained by averaging, respectively, the converted value and the measured value in FIGS. 9A, 10A and 11A for each week.
[0099]In FIGS. 9A and 9B, the level of the converted value of the NaCl excretion amount is generally higher than the level of the measured value of the NaCl excretion amount like the case described for FIG. 8A. In FIGS. 10A and 10B, the level of the converted value of the NaCl excretion amount is substantially consistent with the level of the measured value of the NaCl excretion, amount in general. The reason for this may be that for subject No. 2, the total urine amount in one day acquired by the first total urine amount acquirement method (see urine amount database 15B) is 1.3 [L], while the total urine amount in one day acquired by the second total urine amount acquirement method (converting the total urine amount during the sampling period is converted by a number of days) is 0.9 [L]. That is, it is considered that as accuracy of the total urine amount in one day acquired by the second total urine amount acquirement method is enhanced, accuracy of the NaCl excretion amount obtained by conversion is enhanced. When comparing FIGS. 10A and 10B with FIGS. 11A and 11B, the NaCl excretion amount obtained by conversion under the condition that the total urine amount in one day is obtained by the second total urine amount acquirement method (converting the total urine amount during the sampling period is converted by a number of days) is substantially comparable to the NaCl excretion amount obtained by conversion under the condition that the total urine amount in one day (every day) is acquired by performing measurement. Thus, it could be confirmed that an excretion amount of the specific component in total urine of the subject in one day can be accurately determined under the condition that the total urine amount in one day is acquired by the second total urine amount acquirement method (converting the total urine amount during a sampling period by a number of days).
[0100]For example, when the user continuously depresses the scroll button 13A for 3 or more seconds subsequent to turning on the power switch, the control section 11 may display on the display section 18 an option of which information of “urine specification”, “sex”, “age”, “blood pressure”, “BMI”, “stature”, “body weight”, “season”, “day”, “atmospheric temperature” and “humidity” etc. is to be input. When the user rotates the scroll button 13A as these options are displayed, options of “urine specification”, “sex”, “age”, “blood pressure” and “BMI” etc. are sequentially highlighted as a selection candidate. For example, when the user depresses the scroll button 13A while “blood pressure” is highlighted, a mode of input of “blood pressure” is started. In the mode of input of “blood pressure”, values indicating input candidates of blood pressure (maximum blood pressure or minimum blood pressure) are displayed on the display section 18 in the ascending or descending manner when the user rotates the scroll button 13A. When the user depresses the scroll button 13A, a value displayed at this time is input as a blood pressure (maximum blood pressure or minimum blood pressure) of the subject. Other options such as BMI can be inputted in the same manner as in the case of the blood pressure.
[0101]In this case, when not only the advice appropriate to the salinity amount but also advices appropriate to the blood pressure and BMI are stored in the advice table 17 as shown in FIG. 20, a more appropriate advice can be given to the subject. In the example in FIG. 20, advices are stored while being classified in correspondence with a maximum blood pressure/minimum blood pressure of “less than 135/85 mmHg” and a BMI of “less than 25”, a maximum blood pressure/minimum blood pressure of “135/85 mmHg or more” and a BMI of “25 or more” and a maximum blood pressure/minimum blood pressure of “135/25 mmHg or more” and a BMI of “less than 25” for each of salinity amount ranges of “0.0 to 3.0 g”, “3.0 to 6.0 g”, “6 to 7.5 g”, “7.5 to 9.0 g” and “9.0 g or more”.
[0102]For example, the advice of “Goal achieved for salinity reduction. You need weight reduction/exercise and medication” is stored for the salinity amount range of “3.0 to 6.0 g” and the maximum blood pressure/minimum blood pressure of “135/85 mmHg or more” and the BMI of “25 or more”.
[0103]The advice of “Salinity amount so high. Take enough care of your dietary life. You need weight reduction/exercise and medication” is stored for the salinity amount range of “9.0 g or more” and the maximum blood pressure/minimum blood pressure of “135/85 mmHg or more” and the BMI of “25 or more”.
[0104]When such an advice table is provided, a precise and more appropriate advice can be given to the subject.
[0105]When the user can operate the scroll button 13A to input “stature”, “body weight”, “season”, “day”, “atmospheric temperature” and “humidity” etc. in addition to “sex” and “age” of the subject, the urine amount database 15B may store data indicating a total urine amount per day of the human for each of conditions such as “stature”, “body weight”, “season”, “day”, “atmospheric temperature” and “humidity” etc. in addition to “sex” and “age”. In this way, when a total urine amount of the subject in one day is acquired by the first total urine amount acquirement method (see urine amount database 15B), accuracy of the total urine amount in the one day can be enhanced. As a result, accuracy of the NaCl excretion amount obtained conversion can be enhanced.
[0106]According to the document (Katsumi Shibata, “Studies on Construction of Evidence for Modification of Diet Intake Standard of Japanese-Resolution of Balance between Micronutrient and Macronutrient Intakes-8. Variation in Human Urine Output by Age”, 2007, General and Divisional Research Report, [Search: 25 May 2011], Internet ), “the daily urine amount of the healthy human was 671±223 ml/day for the elementary school student, 823±341 ml/day for the university student and 1731±610 ml/day for the aged”; and “when the daily urine amount is determined as a value per body weight, it is approximately 18.8 ml/kg for the elementary school student, 14.9 ml/kg for the university student and 29.0 ml/kg for the aged.” The total urine amount per day of the human can be known in accordance with “age” or “body weight”.
[0107]When the urine amount database 15B includes data indicating a total urine amount per day of the human by “season” and “day”, a calendar section 40 that counts a date may be further provided as shown in FIG. 1, so that a season and a day when the subject excreted one urine or plural urines is automatically set by an output from the calendar section. In this way, the number of conditions to be input by the user is reduced to save time and labor of the user.

Example

Second Embodiment
[0108]In the first embodiment described above, a NaCl concentration in total urine in one day is determined by performing conversion based on a NaCl concentration in one urine excreted by a subject, but the present invention is not limited thereto. A Na concentration (or NaCl concentration) in total urine in one day may be each determined by performing conversion based on a Na concentration (or Ned concentration) in plural urines (two urines in this example) excreted by the subject over plural days.
[0109]In this case, as shown in, for example, FIG. 13A, data indicating a correlation between an average Na concentration obtained using two urines (first and second urines after wake-up) and a measured Na concentration in total urine in one day is stored in a correlation storage section 15. Specifically, FIG. 13A shows a case where a relationship between an average Na concentration obtained by averaging the measured Na concentration in the first urine after wake-up and a measured Na concentration in the second urine after wake-up (abscissa x, unit: [mmol/L]) and a measured Na concentration in total urine in one day (ordinate y, unit: [mmol/L]) is approximated by a straight line (shown by a solid line in FIG. 13A), and an expression of the straight line is stored as data indicating a correlation. In this case, it is shown that the correlation coefficient is r=0.82.
[0110]Alternatively, place of the correlation in FIG. 13A or in addition to the correlation in FIG. 13A, data indicating a correlation between an average Na concentration obtained using two urines (urine just before sleep and first urine after wake-up) and a measured Na concentration in total urine in one day is stored as shown in, for example, FIG. 13B. Specifically, FIG. 13B shows a case where a relationship between an average Na concentration obtained by averaging the measured Na concentration in the urine just before sleep and a measured Na concentration in the first urine after wake-up (abscissa x, unit: [mmol/L]) and a measured Na concentration in total urine in one day (ordinate y, unit: [mmol/L]) is approximated by a straight line (shown by a solid line in FIG. 13B), and an expression of the straight line is stored as data indicating a correlation. In this case, it is shown that the correlation coefficient is r=0.83.
[0111]In this case, a urine component analysis device 90 is operated under control by a control section 11 generally in accordance with a flow shown in, for example, FIG. 12.
[0112]i) First, for example when a user turns on a power switch (not illustrated), a first urine specification mode is started as shown in Step S201 in FIG. 12.
[0113]In this example, in the first urine specification mode, the user inputs, via an operation section 13, urine specification information indicating that urine to be measured is the urine just before sleep. When input of urine specification information is completed, a first urine measurement mode is started.
[0114]ii) in the first urine measurement mode, the user spritzes urine 99 on a sensor section 30 as shown in, for example, FIG. 2A, and depresses a scroll button 13A. Then, as shown in Step S202 in FIG. 12, the sensor section 30 acquires data indicating a Na concentration in one urine 99, and a data input section 12 inputs in real time the data indicating a Na concentration in this example.
[0115]In this example, a calculation mode is not started here, and the user turns off a power switch (not illustrated).
[0116]iii) Next, when the user turns on a power switch (not illustrated), a second urine specification mode is started as shown in Step S203 in FIG. 12.
[0117]In this example, in the second urine specification mode, the user inputs, via the operation section 13, urine specification information indicating that urine to be measured is the first urine after wake-up. When input of urine specification information is completed, a second urine measurement mode is started.
[0118]iv) In the second urine measurement mode, the user spritzes the urine 99 on a sensor section 30 again as shown in, for example, FIG. 2A, and depresses a scroll button 13A. Then, as shown in Step S204 in FIG. 12, the sensor section 30 acquires data indicating a Na concentration in one urine 99, and the data input section 12 inputs in real time the data indicating a Na concentration in this example.
[0119]When this second data input is completed, a first calculation mode is started.
[0120]v) In the first calculation mode, as shown in Step S205 in FIG. 12, the control section 11 acts as a first calculation section to determine an average Na concentration by averaging the Na concentration in two urines (urine just before sleep and first urine after wake-up in this example) excreted by the subject. That is, an average Na concentration is obtained by averaging the measured Na concentration in the urine just before sleep and a measured Na concentration the first urine after wake-up. The average Na concentration is an object to be converted.
[0121]vi) Next, as shown in Step S206 in FIG. 12, the control section 11 determine a Na concentration in total urine in one day when all the urine excreted by the subject in the one day is gathered into one volume, by performing conversion using a correlation (the correlation shown in FIG. 13B in this example) stored in a correlation storage section 15, based on the obtained average Na concentration.
[0122]When the object to be converted is one associated with “first urine after wake-up” and “second spot urine after wake-up”, the correlation shown in FIG. 13A is accordingly used.
[0123]When the conversion is completed, a total urine amount acquirement mode is started.
[0124]vii) In the total urine amount acquirement mode, a total amount of urine excreted by the subject in one day is acquired based on conversion or a urine amount database as shown in Step S207 in FIG. 12.
[0125]In this example, second total urine amount acquirement method shown in FIG. 4B is used, i.e. a total amount of urine excreted by the subject in one day is acquired based on conversion.
[0126]In this case, a total amount of urine (e.g. 9.1 [L]) excreted by the subject over seven days as a sampling period is measured beforehand.
[0127]First, the user inputs a number of days in the sampling period (seven days in the above example) and a total urine amount in the sampling period (9.1 [L] in the above example) via the operation section 13 as shown in Steps S121 and S122 in FIG. 4B.
[0128]Next, as shown in Step S123 in FIG. 45, the control section 11 acts as a total urine amount acquirement section to determine a total amount of urine excreted by the subject in one day by a division: (total urine amount in sampling period)/(number of days in sampling period). In the above example, the total amount of urine excreted by the subject in one day is determined as 9.1 [L]/7 days 1.3 [L/day].
[0129]In this case, the subject should measure a urine amount only during a sampling period. Thus, time and labor for measuring a urine amount by the subject can be reduced when measurement is continued over a long period of time.
[0130]When acquirement of a total urine amount is completed, a second calculation mode is started.
[0131]Steps S201 to S206 and Step S207 in FIG. 12 may be replaced with each other.
[0132]viii) In the second calculation mode, as shown in Step S208 in FIG. 12, the control section 11 acts as a second calculation section to determine a Ma excretion amount in total urine of the subject in one day by multiplying the Na concentration in total urine in one day, which is determined in Step S206, by the total urine amount in one day acquired in Step S207.
[0133]ix) Then, as shown in Step S209, the Na excretion amount obtained by conversion is stored in a calculation result storage section 16 in correspondence with a measurement date and time. At the same time, the Na excretion amount obtained by conversion is displayed on the display section 18.
[0134]x) As shown in Step S210, the control section 11 acts as an advice section to select an advice appropriate to the Na excretion amount (salinity amount) obtained by conversion, by referring to the advice table 17 (e.g. FIG. 19), and display on the display section 18 the advice along with the Na excretion amount (salinity amount) obtained by conversion.
[0135]FIG. 14B shows results of examining a Na excretion amount (abscissa) in total urine in one day, which is obtained by conversion using two urines (urine just before sleep and first urine after wake-up in this example), by using a measured Na excretion amount (ordinate) in total urine per day. For comparison, FIG. 14A shows results of examining a Na excretion amount (abscissa) in total urine in one day which is obtained by conversion using one spot urine (first urine after wake-up in this example), by using a measured Na excretion amount (ordinate) in total urine per day. Here, the correlation coefficient is r=0.69 in FIG. 14A, whereas the correlation coefficient is r=0.76 in FIG. 14B.
[0136]Thus, it has become apparent that when a Na concentration (or NaCl concentration) in total urine in one day is determined by performing conversion based on a Na concentration (or NaCl concentration) in two urines, a high correlation (correlation coefficient) is obtained between the converted value and the measured value, and resultantly a Na excretion amount in total urine of the subject in one day can be accurately determined.
[0137]When a Na concentration in one urine or an average Na concentration in two urines is used as an object to be converted, it is desirable that which is to be used should be determined in consideration of accuracy of conversion and ease of performing urine measurement by the subject. As for the order of accuracy, generally, a combination of “first urine after wake-up” and “second urine after wake-up” is ranked first, a combination of “urine just before sleep” and “first urine after wake-up” is ranked second, “second urine after wake-up” is ranked third, and “first urine after wake-up” is ranked fourth (one ranked first and one ranked second are comparable in accuracy). When the subject goes to work immediately after measuring a Na concentration in the first urine after wake-up at home, it is difficult in practice to measure a Na concentration in the “second urine after wake-up” at the workplace. Therefore, in this case, it is desirable to use a combination of “urine just before sleep” and “first urine after wake-up”.

Example

Third Embodiment
[0138]In the embodiments described above, an excretion amount of Na (or NaCl) in total urine in one day is determined by conversion, but an average value per day of the excretion amount of Na (or NaCl) may be determined based on a excretion amount of Na (or NaCl) obtained for each day.
[0139]Specifically, a control section 11 acts as a second calculation section to read a daily excretion amount of Na (or NaCl) stored in a calculation result storage section 16 and calculate an average value per day.
[0140]FIGS. 15A and 15B and FIGS. 16A and 16B each show a result of examining an average value per day of the Na excretion amount obtained for each day, by using an average value per day of the measured Na excretion amount in total urine, while variously changing a period (number of days) d for which the average value is calculated.
[0141]Specifically, FIG. 15A shows a result of examining a Na excretion amount in total urine in one day (d=1), which is obtained by conversion using one urine (first urine after wake-up), by using a measured Na excretion amount in total urine in one day. FIG. 152 shows a result of examining an average value over three days (d=3) of the Na excretion amount in total urine in one day, which is obtained by conversion using one urine (first urine after wake-up), by using an average value per day of the measured Na excretion amount in total urine over three days. FIG. 16A shows a result of examining an average value over five days (d=5) of the Na excretion amount in total urine in one day, which is obtained by conversion using one urine (first urine after wake-up), by using an average value per day of the measured Na excretion amount in total urine over five days. FIG. 16B shows a result of examining an average value over seven days (d=7) of the Na excretion amount in total urine in one day, which is obtained by conversion using one urine (first urine after wake-up), by using an average value per day of the measured Na excretion amount in total urine over seven days. Here, the correlation coefficient is r=0.69 in FIG. 15A, whereas the correlation coefficient is r=0.79 in FIG. 15B, the correlation coefficient is r=0.81 in FIG. 16A, and the correlation coefficient is r=0.83 in FIG. 16B.
[0142]Thus, it has become apparent that when the period (number of days) d is increased, a high correlation (correlation coefficient) is obtained between the converted value and the measured value, and resultantly a Na excretion amount in total urine of the subject in one day can be accurately determined.
[0143]Similarly, FIGS. 17A and 17B and FIGS. 18A and 18B each show a result of examining an average value per day of the Na excretion amount obtained for each day, by using an average value per day of the measured Na excretion amount in total urine, while variously changing a period (number of days) d for which the average value is calculated.
[0144]Specifically, FIG. 17A shows a result of examining a Na excretion amount in total urine in one day (d=1), which is obtained by conversion using two urines (urine just before sleep and first urine after wake-up), by using a measured Na excretion amount in total urine in one day. FIG. 17B shows a result of examining an average value over three days (d=3) of the Na excretion amount in total urine in one day, which is obtained by conversion using two urines (urine just before sleep and first urine after wake-up), by using an average value per day of the measured Na excretion amount in total urine over three days. FIG. 18A shows a result of examining an average value over five days (d=5) of the Na excretion amount in total urine in one day, which is obtained by conversion using two urines (urine just before sleep and first urine after wake-up), by using an average value per day of the measured Na excretion amount in total urine over five days. FIG. 18B shows a result of examining an average value over seven days of the Na excretion amount in total urine in one day, which is obtained by conversion using two urines (urine just before sleep and first urine after wake-up), by using an average value per day of the measured Na excretion amount in total urine over seven days (d=7). Here, the correlation coefficient is r=0.76 in FIG. 17A, whereas the correlation coefficient is r=0.86 in FIG. 17B, the correlation coefficient is r=0.90 in FIG. 18A, and the correlation coefficient is r=0.91 in FIG. 18B.
[0145]Also in this case, it has become apparent that when the period (number of days) d is increased, a high correlation (correlation coefficient) is obtained between the converted value and the measured value, and resultantly a Na excretion amount in total urine of the subject in one day can be accurately determined.
[0146]As a whole, for the number of times and the period (number of days) in which data about a concentration of a specific component the urine excreted by the subject is measured, one urine or plural urines per day may be measured ever plural days. When the number of measurements and the number of measurement days are increased, accuracy of the Na excretion amount (or NaCl excretion amount) obtained by conversion can be enhanced. The subject is not required to perform measurement every day during the measurement period. For example, measurement may be performed only six times during a measurement period of seven days.
[0147]In the embodiments described above, the user inputs, via an operation section 13, urine specification information indicating whether urine to be measured is the first urine after wake-up or the second urine after wake-up or the urine just before sleep, but the present invention is not limited thereto. The control section 11 may act as a urine determination section to determine whether the one urine or the plural urines excreted by the subject are the first urine after wake-up or the second urine after wake-up or the urine just before sleep, in accordance with a time at which data about a Na concentration (NaCl concentration) is input. In this way, time and labor of inputting urine specification information by the user can be saved.
[0148]In the embodiments described above, the display section 18 is provided as a notification section, but the present invention is not limited thereto. For example, the notification section may include a speaker in addition to the display section 18 or in place of the display section 18. In this case, the user can be notified of a Na excretion amount (NaCl excretion amount) calculated by the control section 11 and an advice appropriate to the Na excretion amount (or NaCl excretion amount) by voice through the speaker.

PUM

no PUM

Description & Claims & Application Information

We can also present the details of the Description, Claims and Application information to help users get a comprehensive understanding of the technical details of the patent, such as background art, summary of invention, brief description of drawings, description of embodiments, and other original content. On the other hand, users can also determine the specific scope of protection of the technology through the list of claims; as well as understand the changes in the life cycle of the technology with the presentation of the patent timeline. Login to view more.

Similar technology patents

Curved toothbrush

InactiveUS20170156482A1easy and convenient
Owner:KIM JUNG HAE

Filtering type strong transient electromagnetic pulse protection structure

ActiveCN113438034Acompact structureeasy and convenient
Owner:SHENZHEN SUPERLINK TECH CO LTD

Streamline Storage System

ActiveUS20180105223A1easy and convenient
Owner:HESSOM NICHOLAS DALE +2

Classification and recommendation of technical efficacy words

  • easy and convenient
  • accurately determine

Process for subtitling streaming video content

InactiveUS20140068687A1easy and convenient
Owner:TITLES ON

Charger

InactiveUS20100117598A1easy and convenient
Owner:CHENG UEI PRECISION IND CO LTD

Machining work piece automatic loading device

InactiveCN103203654AReasonable structureeasy and convenient
Owner:潘旭华

Embroidery machine fabric holder

InactiveUS6109194Aeasy and convenient
Owner:FARB DEBORAH G

Elastic abrasive cloth and abrasive wheel

InactiveCN101209543AImprove fitting accuracyeasy and convenient
Owner:厦门致力金刚石工具有限公司
Why Eureka
Try Eureka