Evaluation method, evaluation device, program, and recording medium
- Summary
- Abstract
- Description
- Claims
- Application Information
AI Technical Summary
Benefits of technology
Problems solved by technology
Method used
Image
Examples
example 1
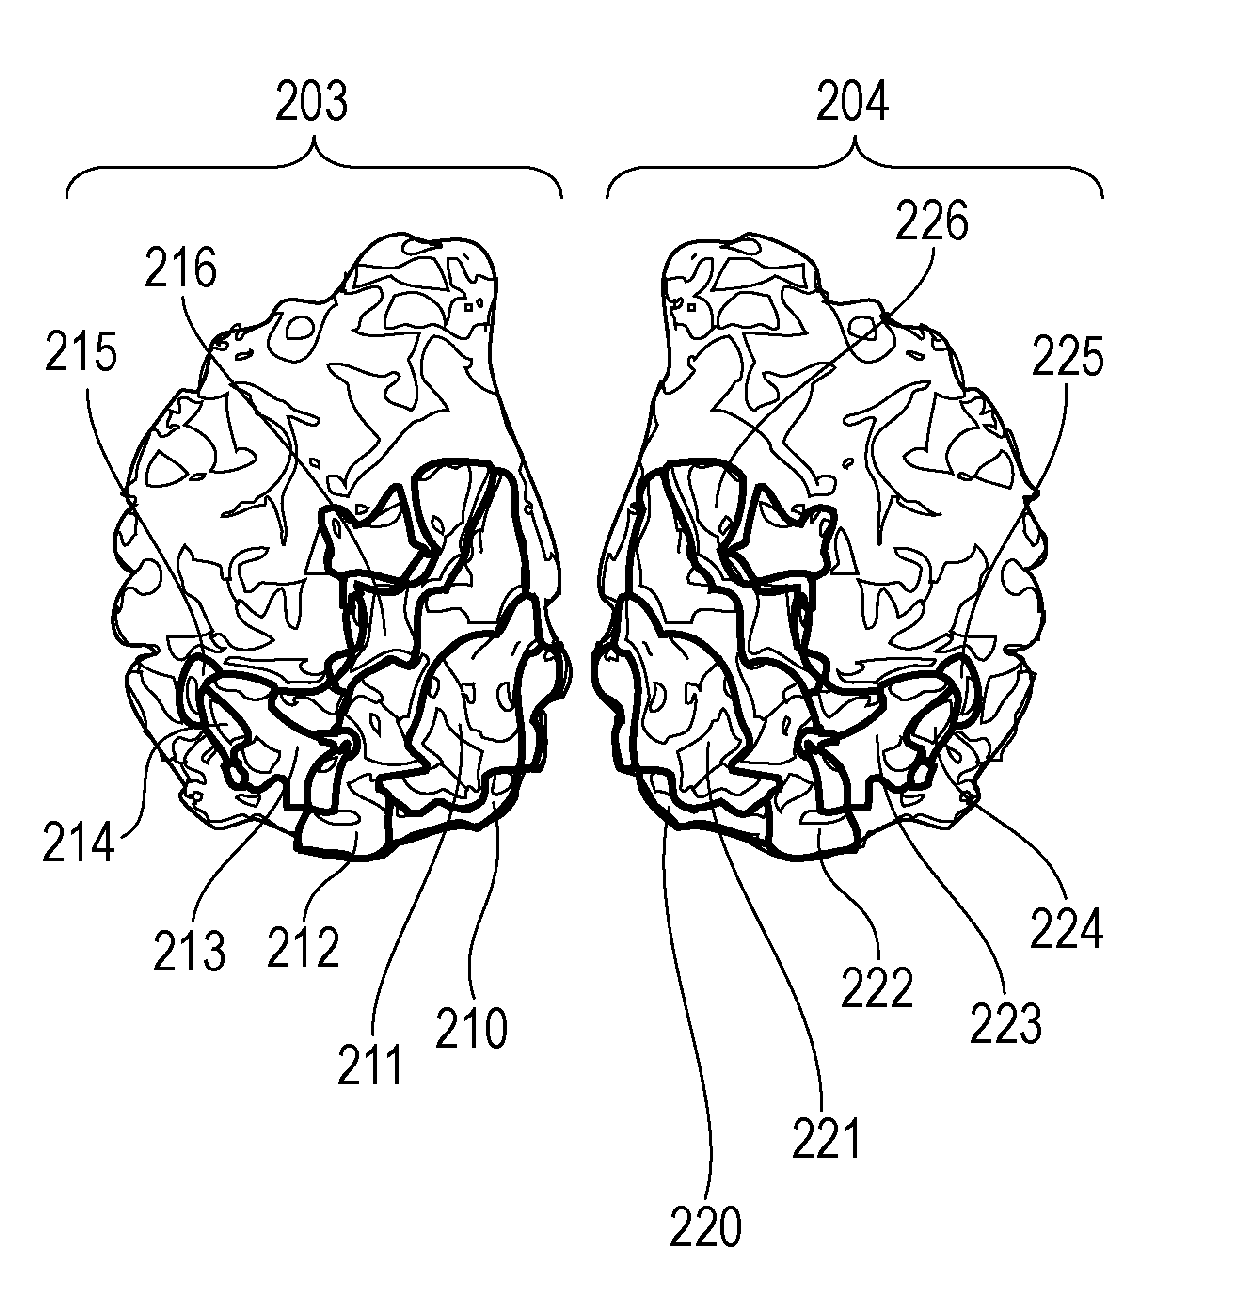
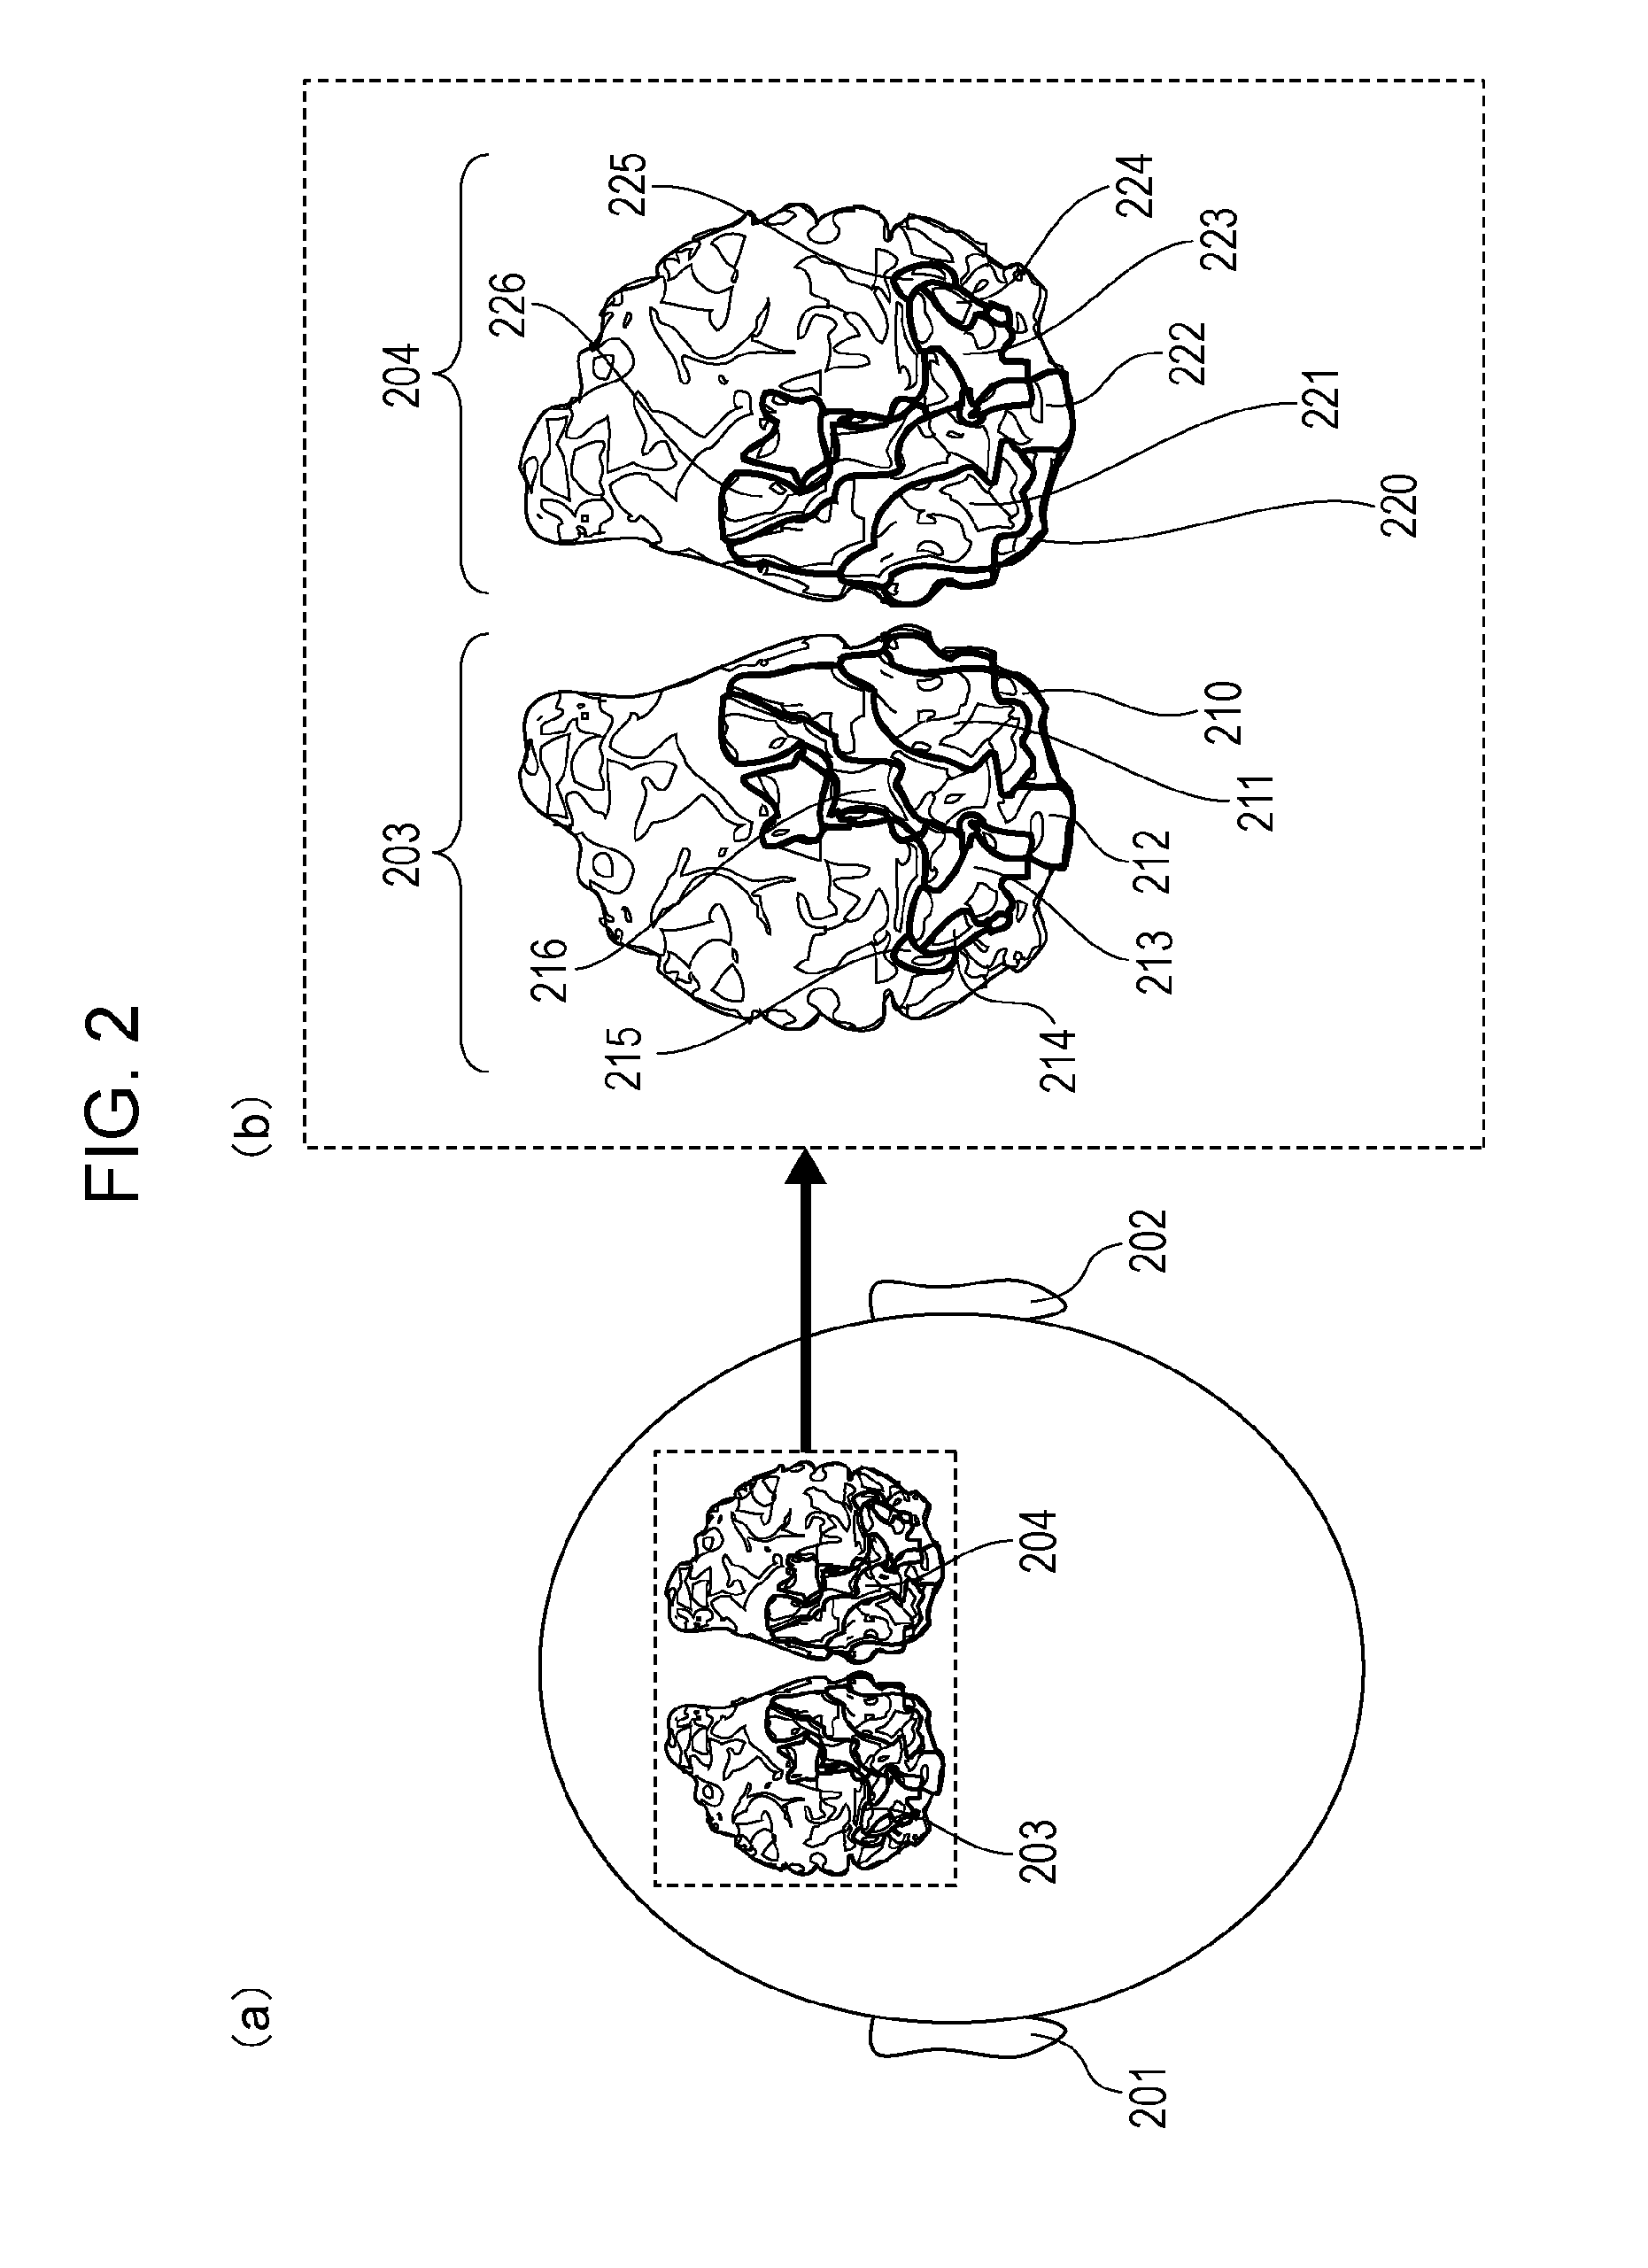
[0166]The present embodiment will be described using the device described in the section “Example of the Evaluation Device.” Brain activity in the middle temporal area (MT) in both the right and left hemisphere of the viewer is measured, the cross correlation coefficient is calculated using the brain activity data, and whether the video under evaluation causes visually induced motion sickness is determined.
[0167]The brain activity measuring device used according to the present embodiment is an fMRI device. The display device is configured of a screen provisioned within the bore of the fMRI device, and a video projector arranged externally from the measuring unit to project the video on the screen. The video projector is controlled by a control computer, and performs the display and non-display of the video under evaluation, the display of the determination results, etc.
[0168]FIG. 8 is a cross-sectional diagram of the fMRI device according to the present example. A viewer 801 lies on...
example 2
[0180]As another example different from the (example 1) above, the present embodiment will be described using an example in which the fMRI device is replaced by an electroencephalograph. Brain activity is measured near the middle temporal area (MT) in the left and right hemispheres of the viewer, the coherence function is calculated using the brain activity data, and whether the video under evaluation causes visually induced motion sickness is determined Reference electrodes are attached to the earlobes, and active electrodes are arranged on positions T5 and T6 in the posterior temporal regions nearest to the middle temporal area (MT) in compliance with the International 10-20 System.
[0181]The visual distance of the video under evaluation is adjusted to fit the screen size so that the visual angle is aligned to that of the (example 1) above, and then displayed on a commercial display. Two types of video are used in the present example. A first video (hereafter, video 1) was a 6 minu...
example 3
[0186]The present example will be described using the device expressed in the previously described section “Example of the Editing Device.” In this example, brain activity for the middle temporal area (MT) in the left and right hemispheres of the viewer are measured, the cross correlation coefficient is calculated as time-series data using the brain activity data, points in time where the video under evaluation caused visually induced motion sickness in the viewer are identified, and the content of the video under evaluation is edited. FIG. 9A illustrates brain activity time-series data for the middle temporal area (MT) in the left and right hemispheres when a 12-minute video was presented to the subject, and FIG. 9B illustrates the time-series data for the cross correlation coefficient calculated from the brain activity time-series data. The time-series data for the cross correlation coefficient illustrated in FIG. 9B is sequentially calculated using the brain activity time-series ...
PUM
 Abstract
Description
Claims
Application Information
 - R&D
- Intellectual Property
- Life Sciences
- Materials
- Tech Scout
- Unparalleled Data Quality
- Higher Quality Content
- 60% Fewer Hallucinations
Browse by: Latest US Patents, China's latest patents, Technical Efficacy Thesaurus, Application Domain, Technology Topic, Popular Technical Reports.
© 2025 PatSnap. All rights reserved.Legal|Privacy policy|Modern Slavery Act Transparency Statement|Sitemap|About US| Contact US: help@patsnap.com


