Classification method for spectral data

Inactive Publication Date: 2015-07-02
NEDERLANDSE ORG VOOR TOEGEPAST-NATUURWETENSCHAPPELIJK ONDERZOEK (TNO)
View PDF1 Cites 9 Cited by
  • Summary
  • Abstract
  • Description
  • Claims
  • Application Information

AI Technical Summary

Benefits of technology

[0017]In a further embodiment, the two or more spectrograms may be partially overlapping.

Problems solved by technology

However, this also forms a problem in the sense that the matrix that is used for performing the spectrometry usually limits the analysis to a particular type of components (proteins, or nucleic acids, or lipids, etc.), to a particular mass range of such components and / or to a particular resolution.
Due to this limited mass range or limited resolution the full spectrum of available information from the components that are present in the sample is not used.

Method used


Image

  • Classification method for spectral data
  • Classification method for spectral data
  • Classification method for spectral data

Examples


example 1

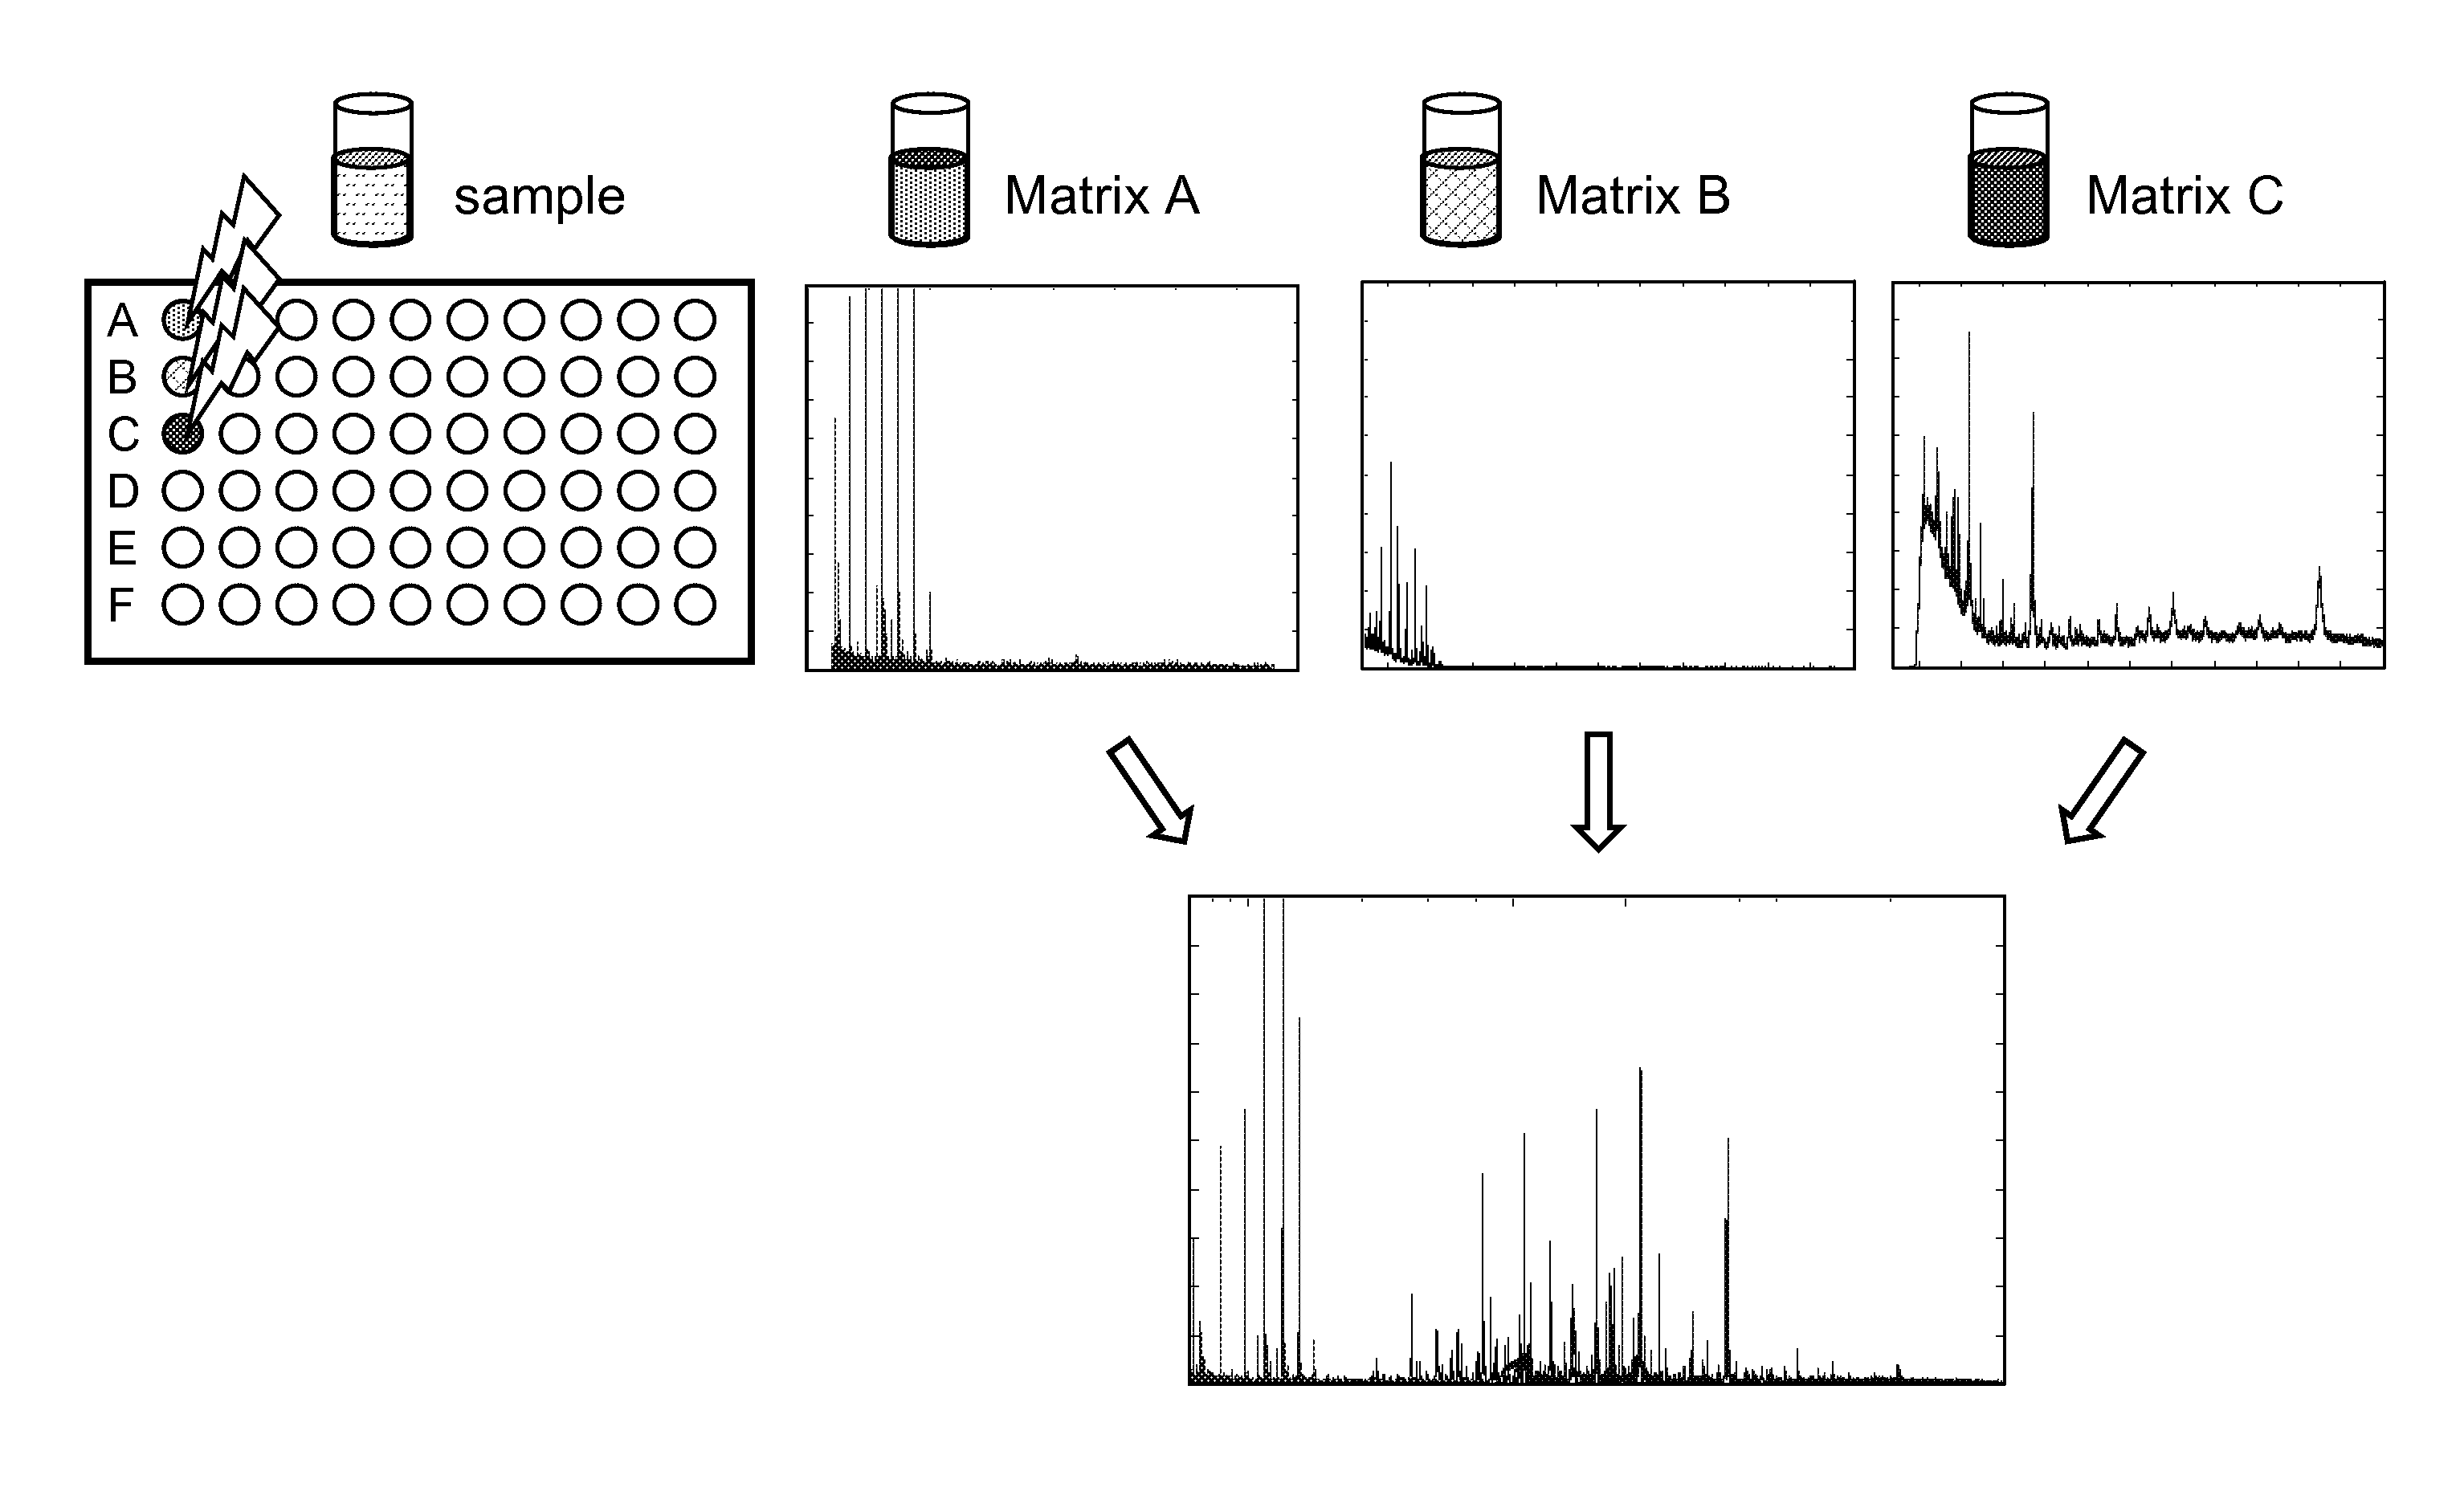
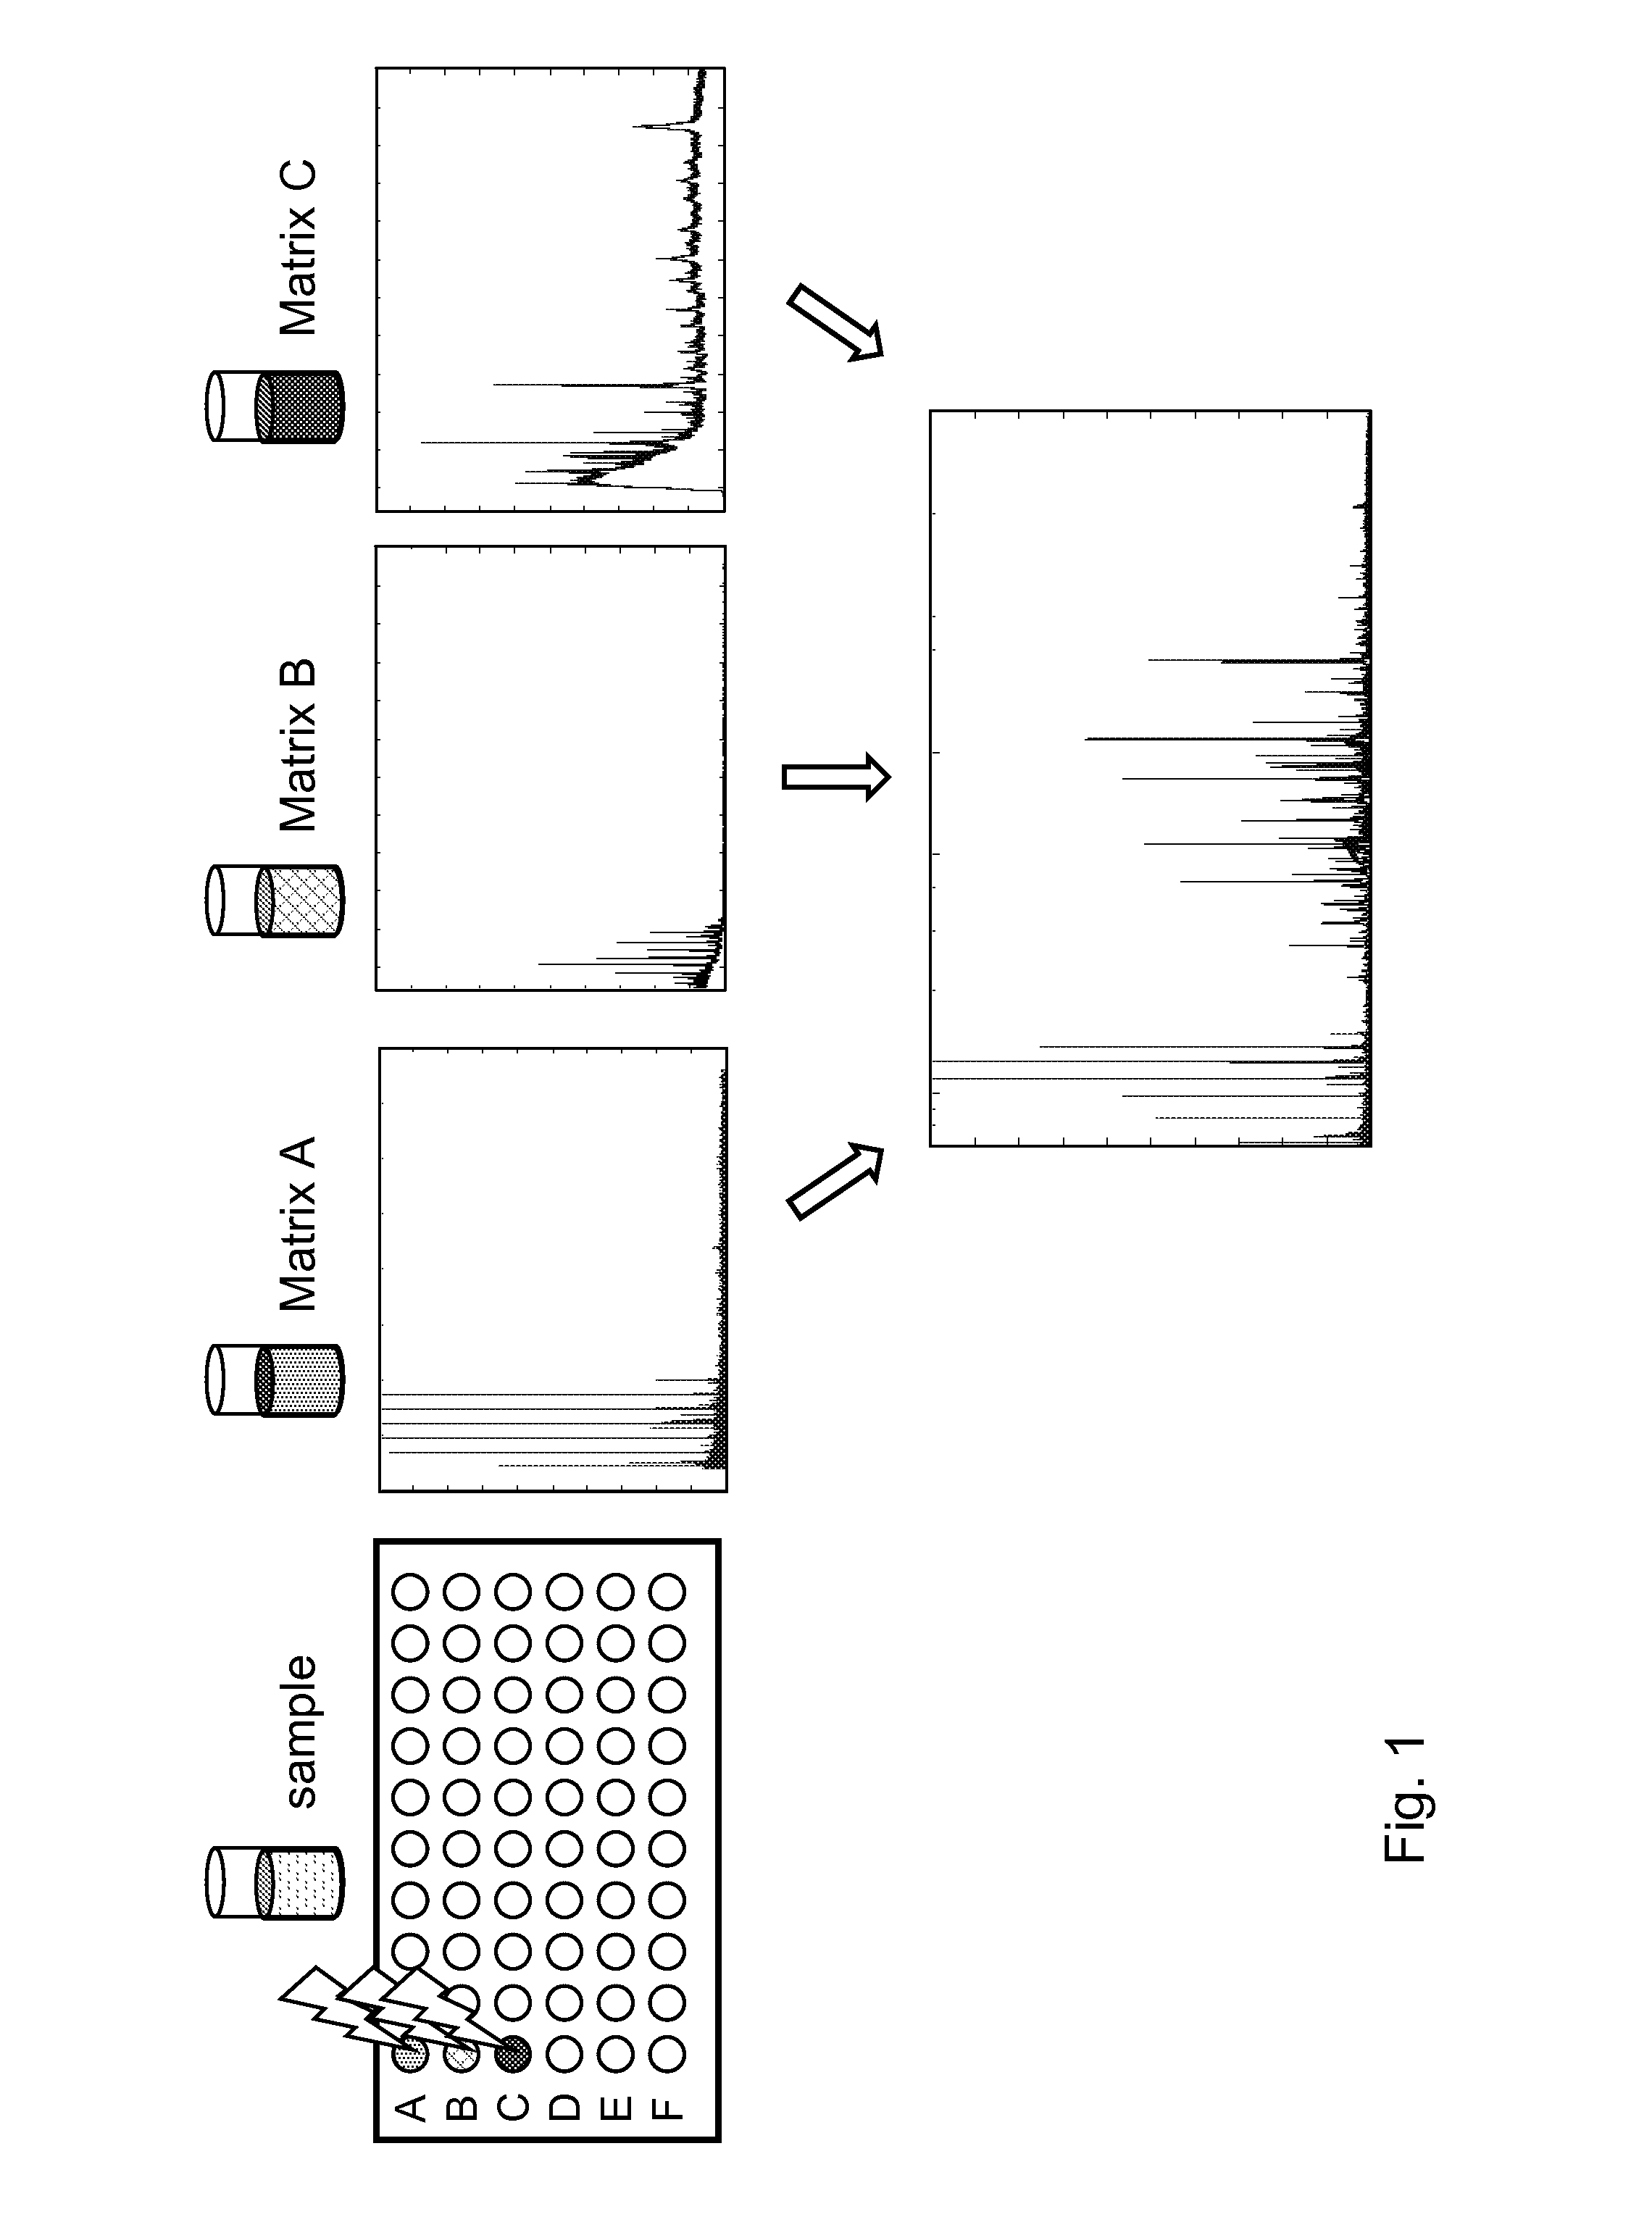
[0072]The experiment exists of 1) sample preparation, 2) spotting sample and matrices, 3) measuring, and 4) data analysis

[0073]1) Sample Preparation

[0074]Harvest cells cultured on a blood agar plate (overnight at 35° C.) by transferring a small amount of bacteria into a tube containing 300 μl sterile water and mix carefully.

[0075]Add 900 μl ethanol (absolute) and mix carefully.

[0076]After 10-30 minutes incubation at room temperature, mix thoroughly and centrifuge for 5 minutes at 10 000 g and remove the supernatant with pipette.

[0077]Centrifuge 2 min. 10.000 g to remove all ethanol (one additional centrifugation step is necessary to completely remove the ethanol)

[0078]Add 50 μl 70% formic acid to the pellet and mix very well by pipetting and / or by mixing on a vortex. The pellet should be resolved as well as possible.

[0079]Add 50 μl pure acetonitrile and mix carefully.

[0080]Centrifuge for 2 minutes at 10 000 g speed

[0081]2) Spotting Sample and Matrices

[0082]Pipette 0.5 μl of supernat...


PUM


Abstract

The present invention relates to a new method for classification of spectral data comprising:
    • a. obtaining at least two spectrograms of different mass range of a sample by performing at least two different mass spectrography measurements, each with a different matrix;
    • b. adding the at least two spectrograms;
    • c. comparing the sample spectrogram resulting from step b) with one or more spectrograms of known samples;
    • d. if there is no difference between the sample spectrogram and a spectrogram of a known sample, declaring the sample identical to the known sample.

Description

THE INVENTION[0001]The present invention relates to methods for classification, more specifically for classification of data derived from spectrographic analyses, more specifically mass spectrography methods that make use of a matrix, such as MALDI, Raman spectrometry, and the like, in order to classify an unknown sample on basis of the spectral information.BACKGROUND[0002]Nowadays, spectrographic methods are frequently used to analyse biomaterials. Whereas initially spectrometry was most heavily used in the fields of chemistry, and for the detection of (single) reaction compounds, it has increasingly become used in the biosciences for the analysis of biological samples.[0003]Spectrometry is also used for the analysis of complete organisms, such as bacteria and viruses. In such a case, it is not so much of importance which exact individual chemical compounds are reflected in the spectrum, but the goal of this analysis is much more to identify and classify the microorganism(s) in the...

Claims


Application Information

Patent Timeline
Patent Type & Authority Applications(United States)
IPC IPC(8): G06K9/62
CPCG06K9/6267H01J49/0036C12Q1/04G06V20/698G06F18/24
Inventor PAAUW, ARMAND
Owner NEDERLANDSE ORG VOOR TOEGEPAST-NATUURWETENSCHAPPELIJK ONDERZOEK (TNO)
Why Eureka
Try Eureka