Method for Anomaly Detection in Time Series Data Based on Spectral Partitioning

a time series data and anomaly detection technology, applied in the field of data analysis of time series data, can solve problems such as loose or broken components, unusual operating conditions, incorrect sequence of operations, etc., and achieve the effect of convenient estimation and maintenan

Active Publication Date: 2015-12-17
MITSUBISHI ELECTRIC RES LAB INC
View PDF0 Cites 57 Cited by
  • Summary
  • Abstract
  • Description
  • Claims
  • Application Information

AI Technical Summary

Benefits of technology

[0018]The embodiments of the invention provide a method for partitioning of a large set of variables into smaller parts, so that the model of normal behavior over the entire set of variables can be factored into individual models over each part, and the individual part-specific models are easier to estimate, maintain, and use for anomaly detection in time series data. The method uses a spectral clustering method that does not determine explicitly the full covariance matrix over all variables, but relies instead on an efficient eigenvalue solution method for very large eigenvalue problems.

Problems solved by technology

Such faults can include loose or broken components, incorrect sequence of operations, unusual operating conditions, etc.
When the number of variables M is very large, as is typical for many industrial systems, the resulting estimate is likely to be inaccurate, and inconvenient to use.
The estimate is likely to be inconvenient for use, because the covariance matrix S, although symmetric, can contain on the order of M2 numbers, and when M is very large, for example numbering in the thousands or millions.
Thus, maintaining S in a memory becomes practically unmanageable.
Whereas other estimation models and methods, such as mixtures of Gaussian distributions can be used to overcome the accuracy problem of a single multivariate Gaussian distribution, those methods still suffer from the problem associated with working with large covariance matrices, which is even worse when more than one Gaussian component is considered.
as the sum of individual components, one for each of the acquired data points, via a suitable kernel function K. However, the choice of the kernel function is typically not easy, and that method also needs to retain all N acquired data points in memory, which is problematic when that number is large, and even infinite.
Another common shortcoming of these methods is that they cannot easily handle data of mixed type, for example when some variables are continuous, and others are discrete.
However, using the smallest possible parts is less effective for the purposes of anomaly detection.
A trivial factoring, where each variable is in its own part, such that P=M, VP={p}, MP=1, would indeed result in very compact representation of the probability density, but would fail to capture the dependency between variables, and would not be able to detect so called contextual anomalies.

Method used


Image

  • Method for Anomaly Detection in Time Series Data Based on Spectral Partitioning
  • Method for Anomaly Detection in Time Series Data Based on Spectral Partitioning

Examples


Embodiment Construction

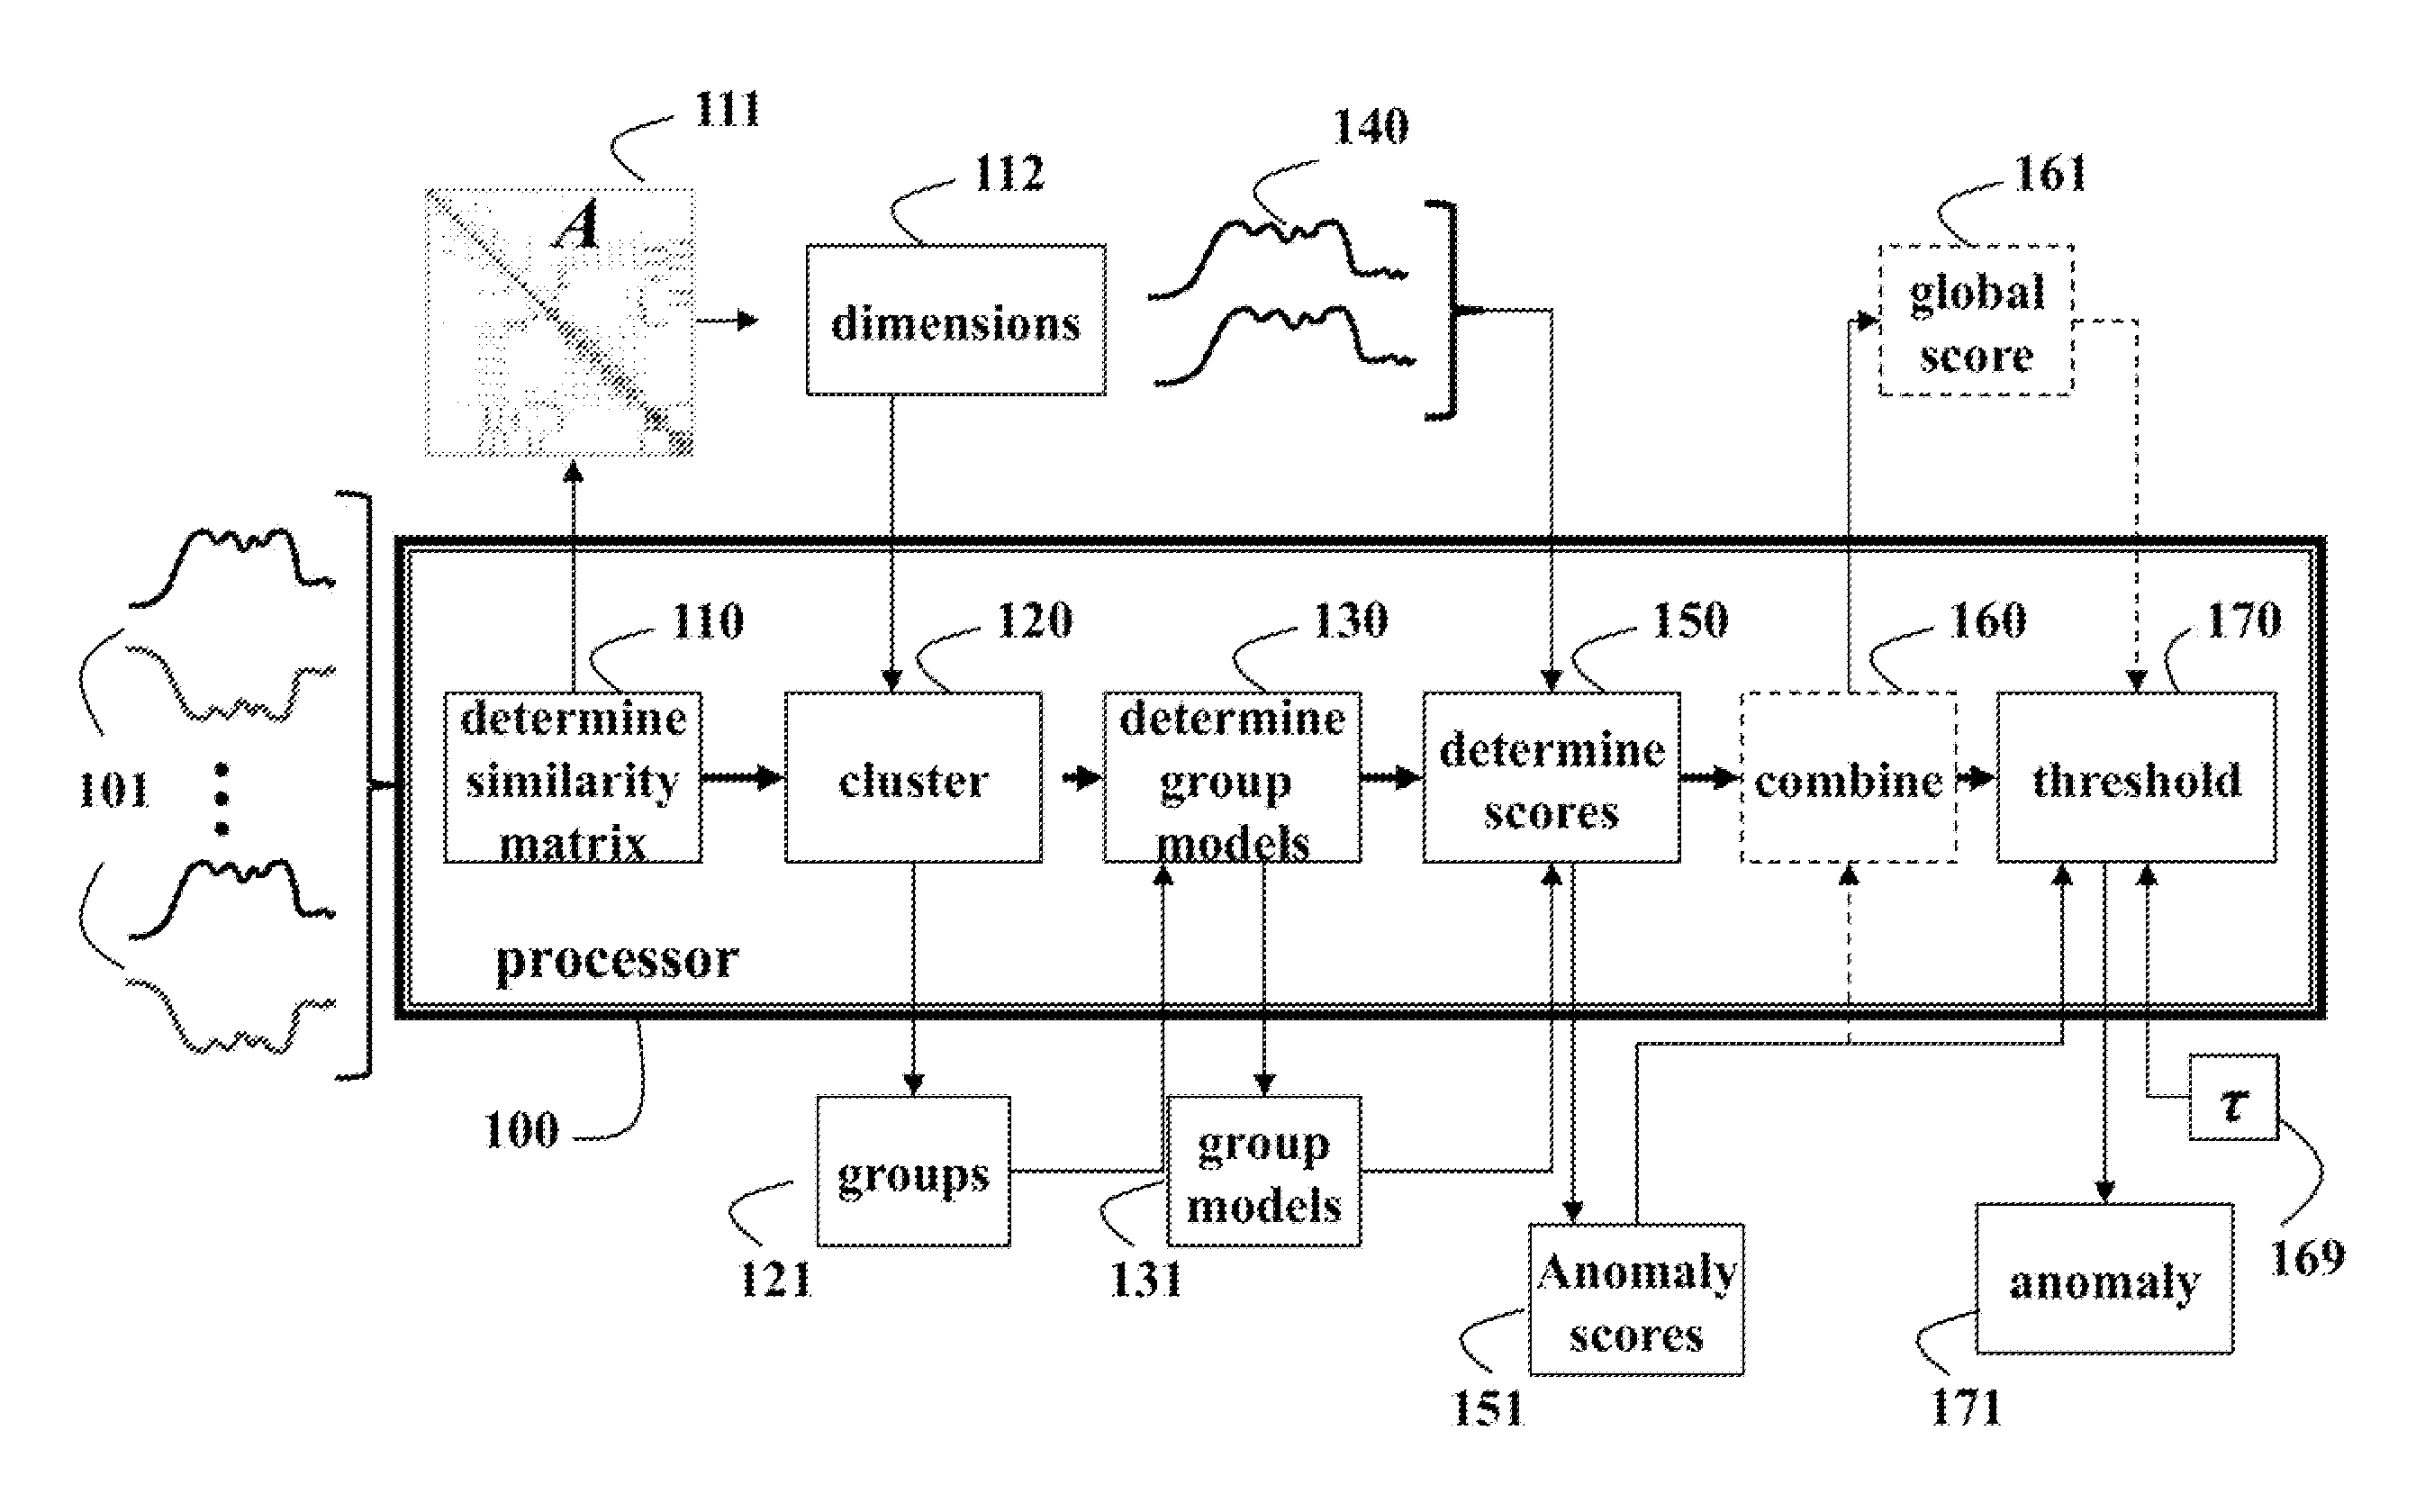
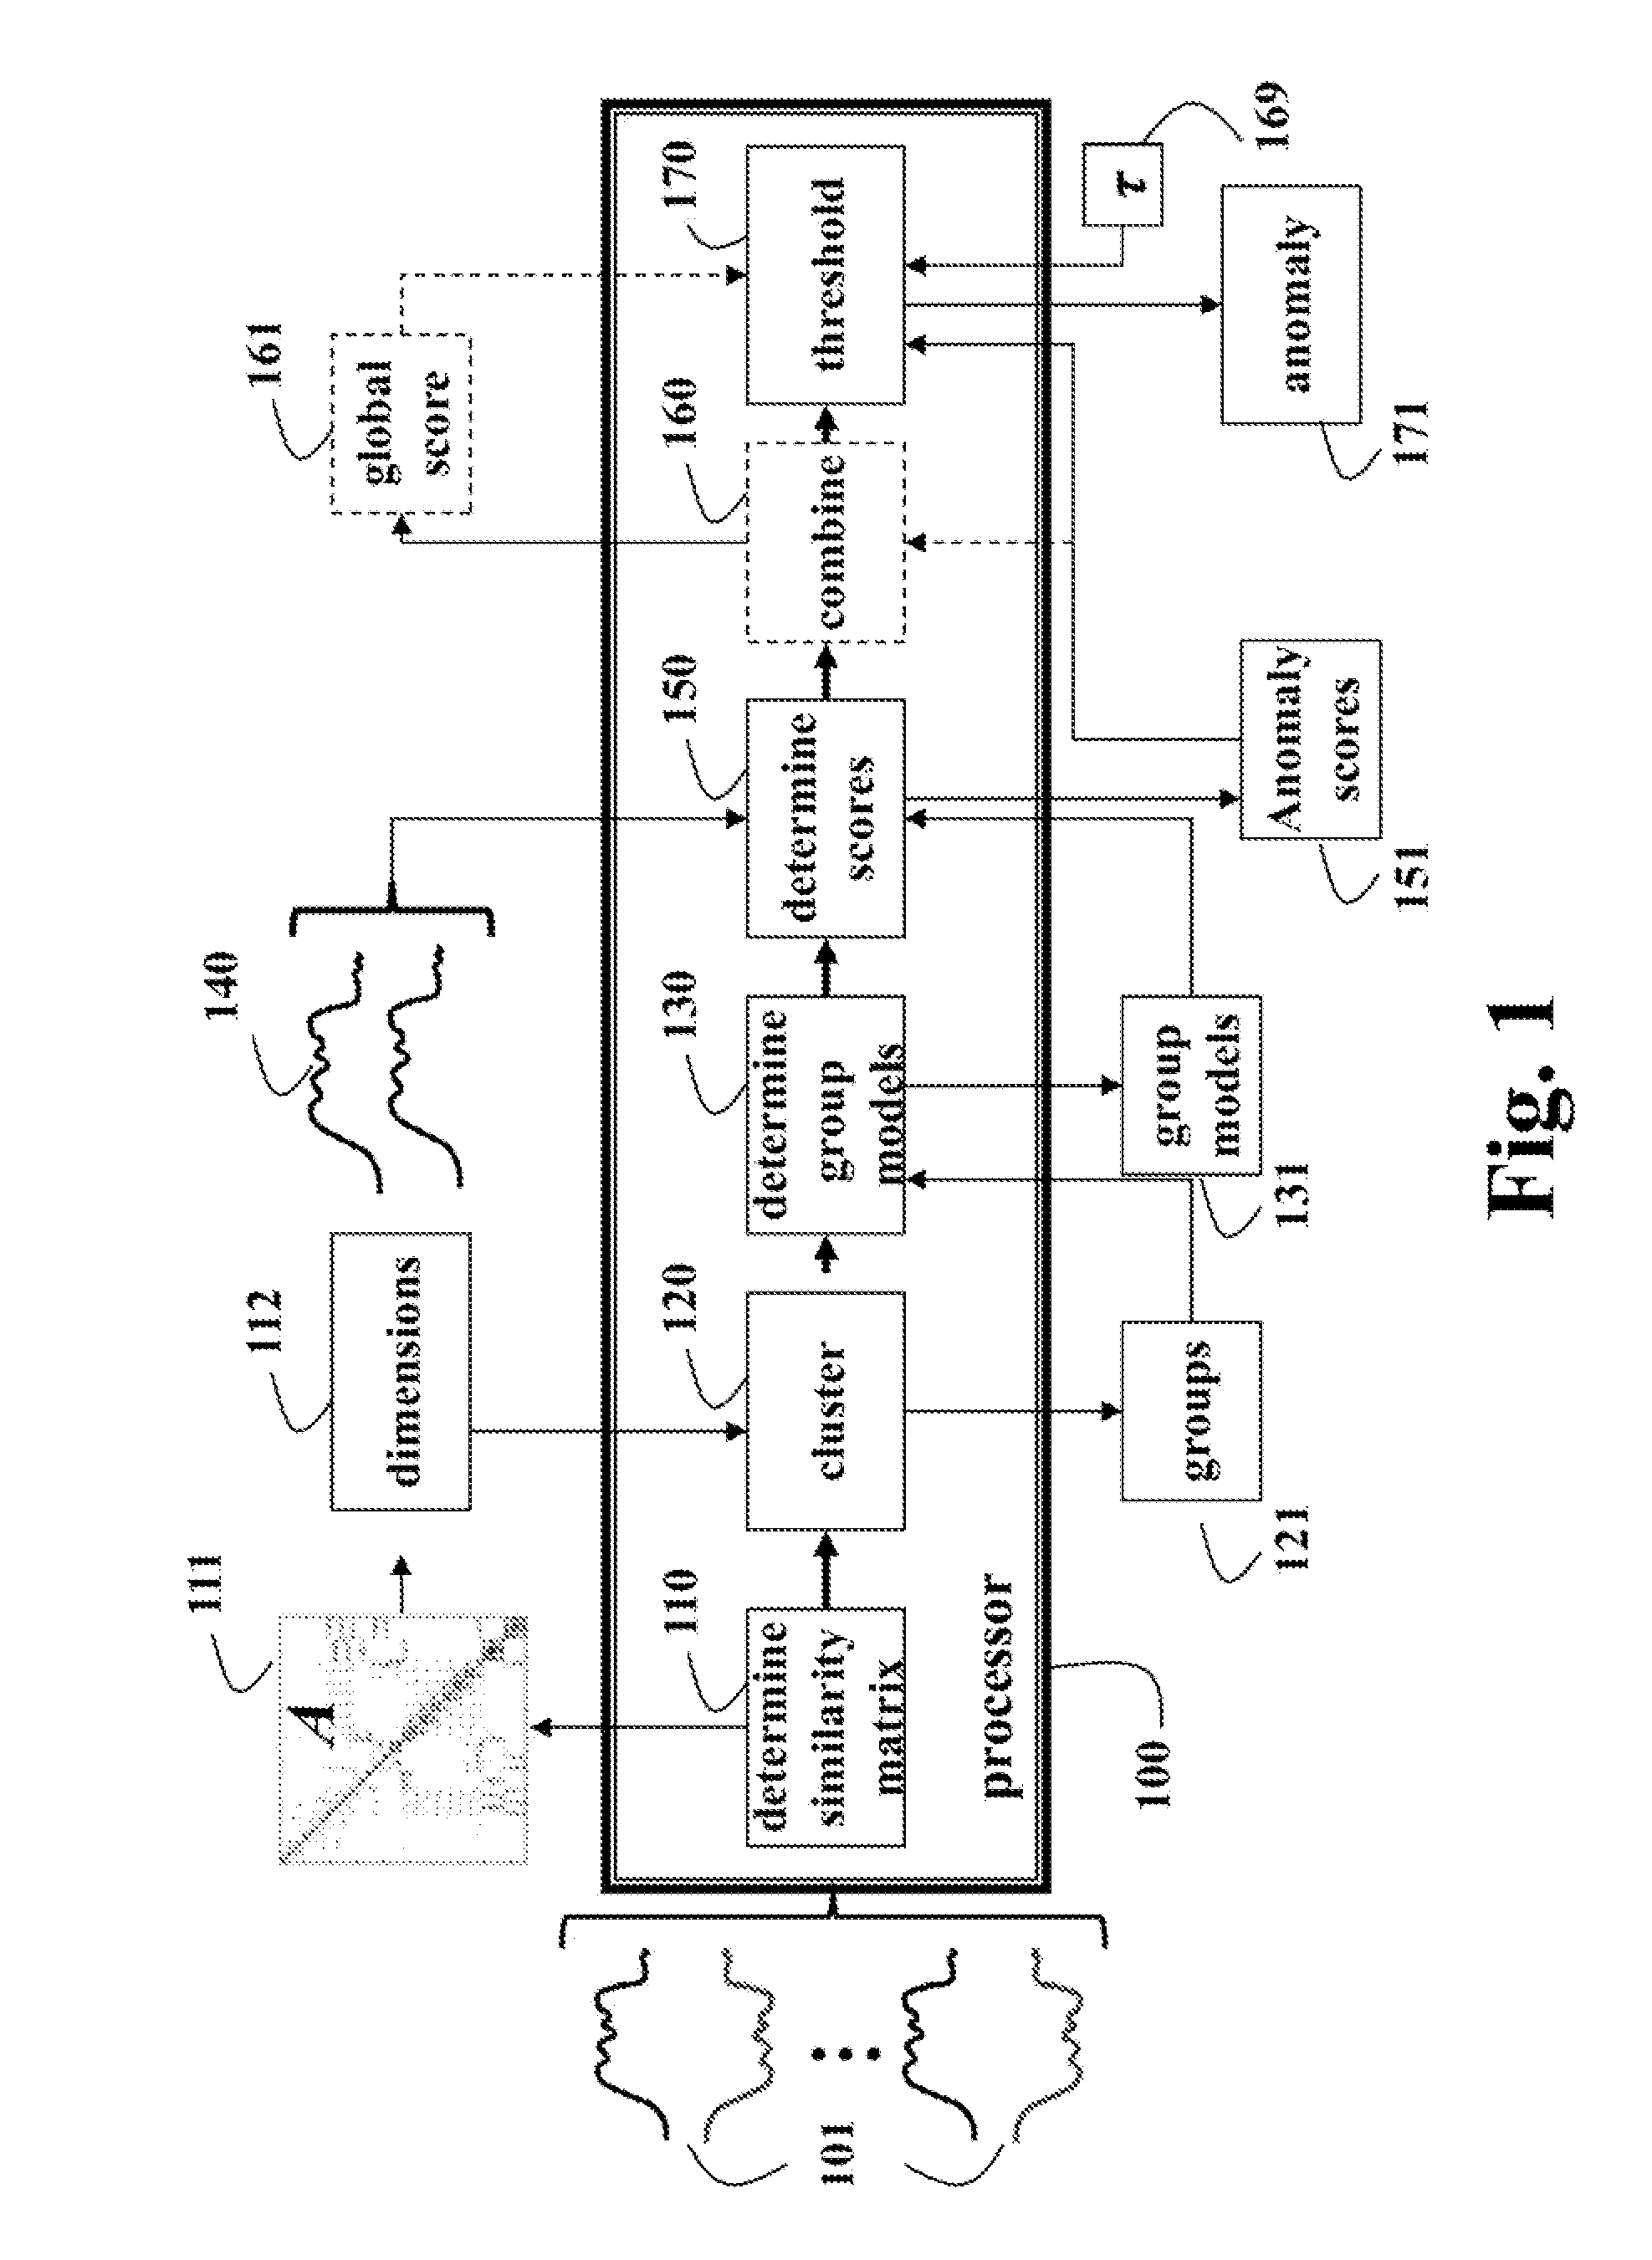
[0021]As shown in FIG. 1, the embodiments of our invention provide a method for detecting an anomaly 171 in real time series data 140. A nonnegative similarity matrix A 111 is determined 110 from pairwise similarities between pairs of dimensions of normal time series data, 101. Spectral clustering 120 is applied to the similarity matrix to partition 120 variables representing dimensions 112 of the time series data into groups 121, wherein the groups are mutually exclusive. A model of normal behavior 131 is determined 130 for each group. For the real time series data 140, an anomaly score 151 is determined 150 using the model for each group. Then, the anomaly scores can be compared to a predetermined threshold r 169 to signal the anomaly 171.

[0022]Optionally, the individual anomaly scores can be combined 160 to form a global anomaly score 161, and the global anomaly score can be compare( to the predetermined threshold τ169 to signal the anomaly 171.

[0023]The steps of the method can b...


PUM


Abstract

Anomalies in real time series are detected by first determining a similarity matrix of pairwise similarities between pairs of normal time series data. A spectral clustering procedure is applied to the similarity matrix to partition variables representing dimensions of the time series data into mutually exclusive groups. A model of normal behavior is estimated for each group. Then, for the real time series data, an anomaly score is determined, using the model for each group, and the anomaly score is compared to a predetermined threshold to signal the anomaly.

Description

RELATED APPLICATION[0001]This U.S. Patent Application is related to MERL-2729, co-filed herewith and incorporated by reference. Both Applications deal with processing data using similarity matrices to form graph Laplacians.FIELD OF THE INVENTION[0002]The invention relates generally to data analysis of time series data to detect anomalies in the data, and more particularly to large databases storing sensor data acquired from large industrial machines or entire installations of machines by a very large number of sensors.BACKGROUND OF THE INVENTION[0003]Automated monitoring of conditions of machines and equipment uses methods that process very large streams of sensor data including many individual readings obtained by sampling various sensors at high rates. The rapidly decreasing costs of data acquisition, communication, and storage technologies has made it economically feasible to accumulate vast amounts of data in the form of multivariate time series data, where each component variab...

Claims


Application Information

Patent Timeline
Patent Type & Authority Applications(United States)
IPC IPC(8): G06N5/04
CPCG06N5/04G06F16/285G06F16/35G06N20/00
Inventor NIKOVSKI, DANIEL NIKOLAEVKNIAZEV, ANDREIJONES, MICHAEL J.
Owner MITSUBISHI ELECTRIC RES LAB INC
Why Eureka
Try Eureka