Methods and apparatuses for graphically indicating station efficiency and pseudo-dynamic error vector magnitude information for a network of wireless stations

iciency information technology, applied in the field of methods and apparatuses for graphically indicating station efficiency and pseudo-dynamic error vector magnitude information for a network of wireless stations, can solve the problems of not providing overall diagnostic health indicators, difficult to manage the demands on the network made by various stations, and burden on wireless service providers to implement network data optimization. to achieve the effect of optimizing channel frequency (and/or bandwidth)

Active Publication Date: 2016-03-03
UBIQUITI INC
View PDF6 Cites 31 Cited by
  • Summary
  • Abstract
  • Description
  • Claims
  • Application Information

AI Technical Summary

Benefits of technology

[0017]Any of the methods herein may also include displaying an indicator of the efficiency of the access point using the indicator of the station efficiency and average airtime for each of the n stations. For example, an overall area displayed, or a fraction of the area displayed, in the graphical representation may reflect the efficiency of the network. For example, graphically displaying the indicator of the efficiency of the access point may include graphically displaying an indicator of the station efficiency, average airtime and an identifier for each of the n stations arranged with the n stations in descending order of station efficiency. The identifier may generally or uniquely identify the station in the network (e.g., by name, code, alphanumeric, position / location identifier, etc.). This may allow the network operator to act one or more specific stations to enhance performance of the network.
[0027]Also described herein are systems for monitoring a network (e.g., one or more access point communicating with a plurality of different stations). Any of these systems may be configured as a non-transitory computer-readable storage medium storing a set of instructions capable of being executed by a processor, that when executed by the processor causes the processor to perform steps including any of the method steps described above. The processor may be general-purpose processor, or it may be a custom and / or dedicated processor. A dedicated processor may be faster and more efficient.
[0066]Described herein are method for optimizing and / or automatic selection of the channel frequency and / or bandwidth of a network, e.g., of an access point and its client devices. Also described herein are apparatuses including devices, and in particular access point devices, that are configured to optimize the channel frequency and / or bandwidth (and in some cases automatically change the channel frequency and / or bandwidth) based on historical frequency spectral information going back at least 24 hours, but in some cases further than 48 hours, 3 days, 4 days, 5 days, 6 days, 7 days, 8 days, 9 days, etc., as well as usage data (e.g., signal strength) specific to all or some of the device(s) forming the network. The optimization may also account for device-specific usage parameters based on applied priority (e.g., a ranking or grading applied by the user or another party). This allows the apparatus to more effectively optimize the channel frequency (and / or bandwidth) based on the actual or expected needs of the network.

Problems solved by technology

In establishing communications networks it is often difficult to manage the demands on the network made by various stations, particularly when the individual stations may have different usage and operational parameters.
Further, individual stations may be capable of operating at different rates because of structural limitations (e.g., hardware, software, firmware of the station) or because of geographic limitations (e.g., strength of connection to the network access point(s)).
Network elements may be able to provide operators a view into the current state of traffic in their network, but they do not provide overall diagnostic health indicators in a manner that could readily allow a network operator to identify and potentially address potential (or actual) problems with the network, including any elasticity and capability in the network, as well as rapidly and intuitively indicating how various stations are influencing the network by at the current time and historically.
Hence, the burden falls on wireless service providers to implement network data optimization to ease the traffic burden and maximize the experience of each and every user on the network.
Currently, only limited tools are available, which may not provide sufficient information (and in an easily digestible form) to properly monitor a network.
Unfortunately, in practice, even with increasingly fast processors associated with wireless devices (including access points), generation of an action constellation diagram, e.g., using actual measured EVM information, is time consuming, and may require the addition of monitoring components which is impractical and expensive.
Further, although many wireless networks operating through an access point are capable of switching channels, current channel-selection / switching techniques are not optimal, and, if they automatically switch channels at all, select the new channel based on the immediate needs, without optimizing at all, or without optimizing based on the likely ongoing needs of the network.

Method used


Image

  • Methods and apparatuses for graphically indicating station efficiency and pseudo-dynamic error vector magnitude information for a network of wireless stations
  • Methods and apparatuses for graphically indicating station efficiency and pseudo-dynamic error vector magnitude information for a network of wireless stations
  • Methods and apparatuses for graphically indicating station efficiency and pseudo-dynamic error vector magnitude information for a network of wireless stations

Examples


example

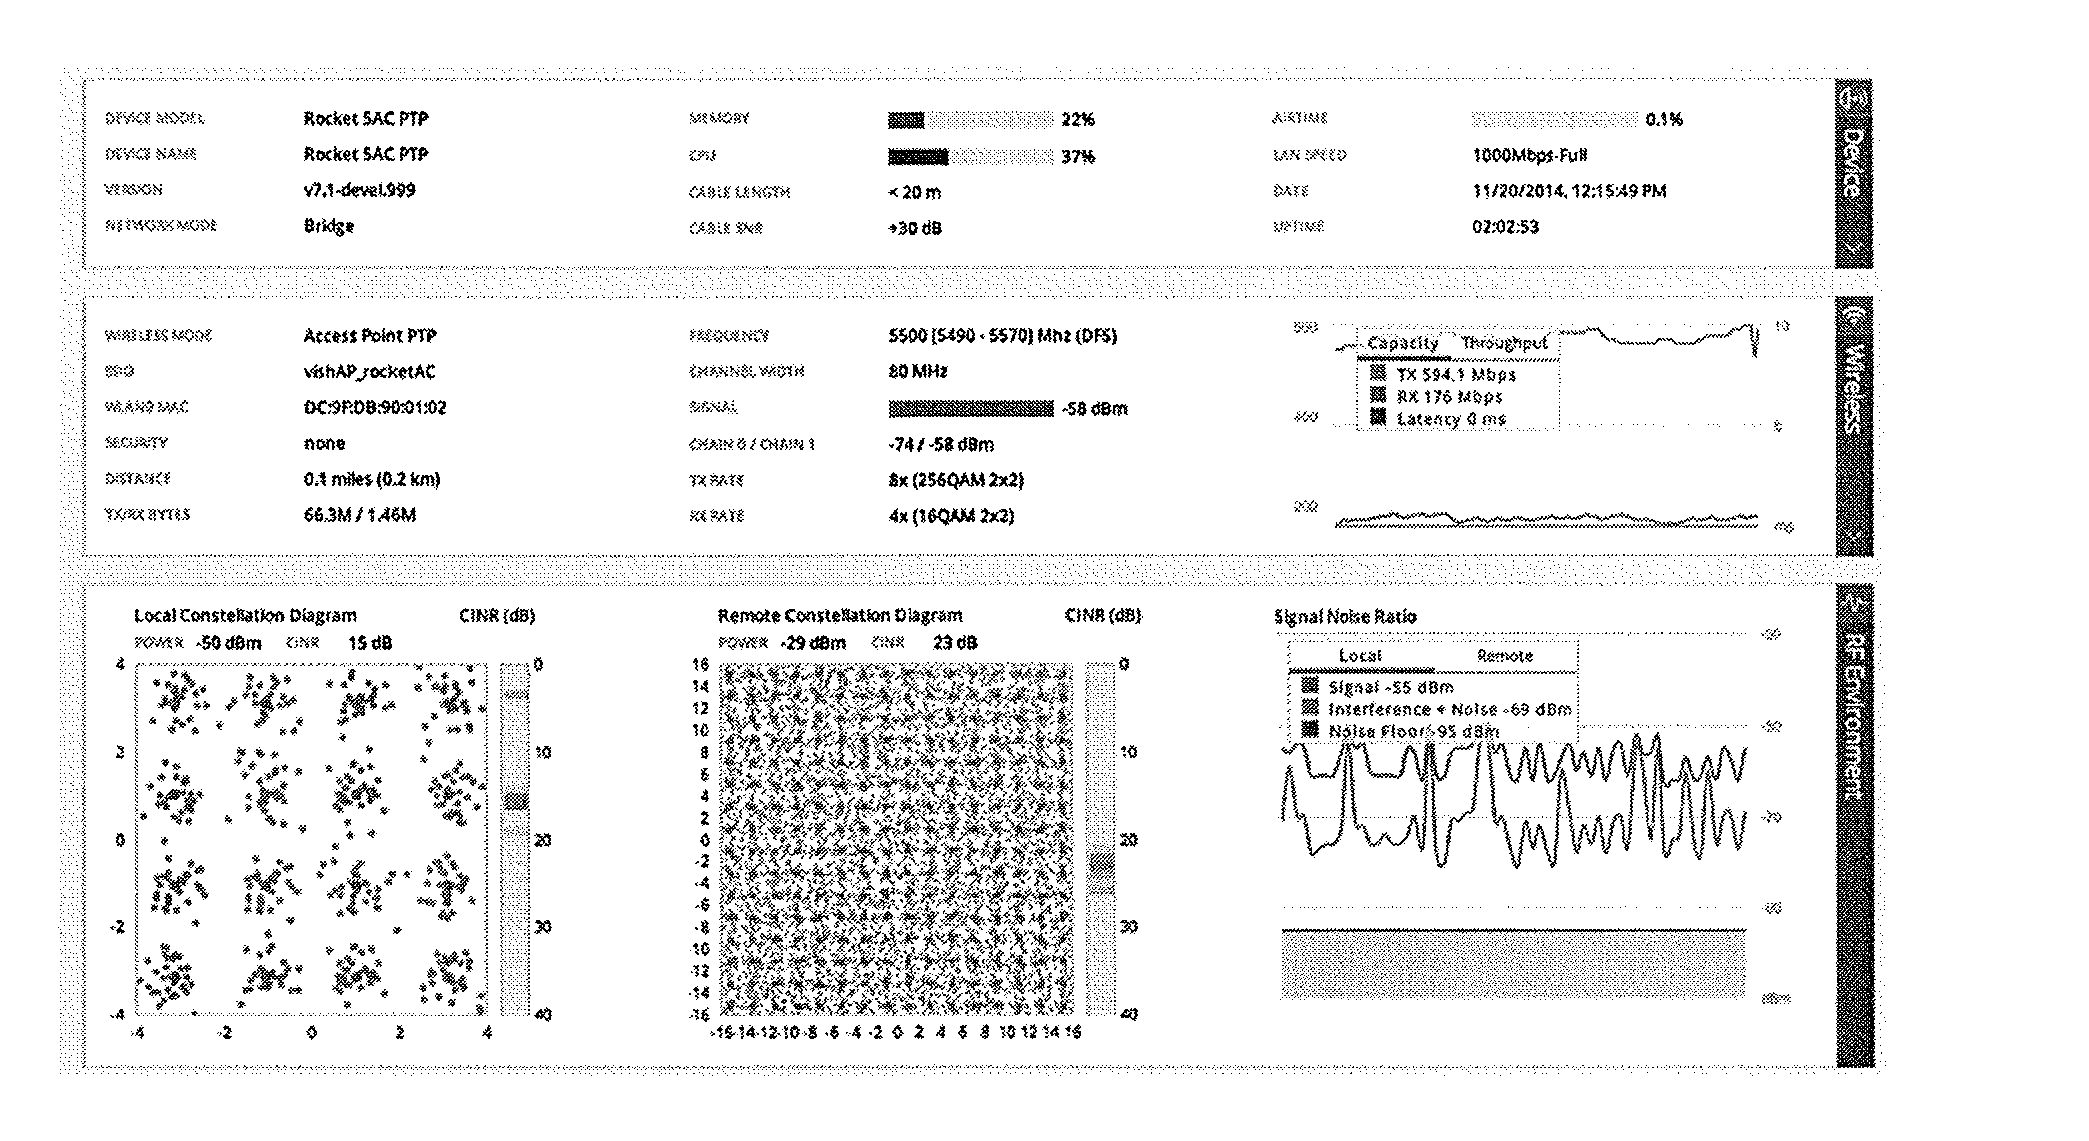
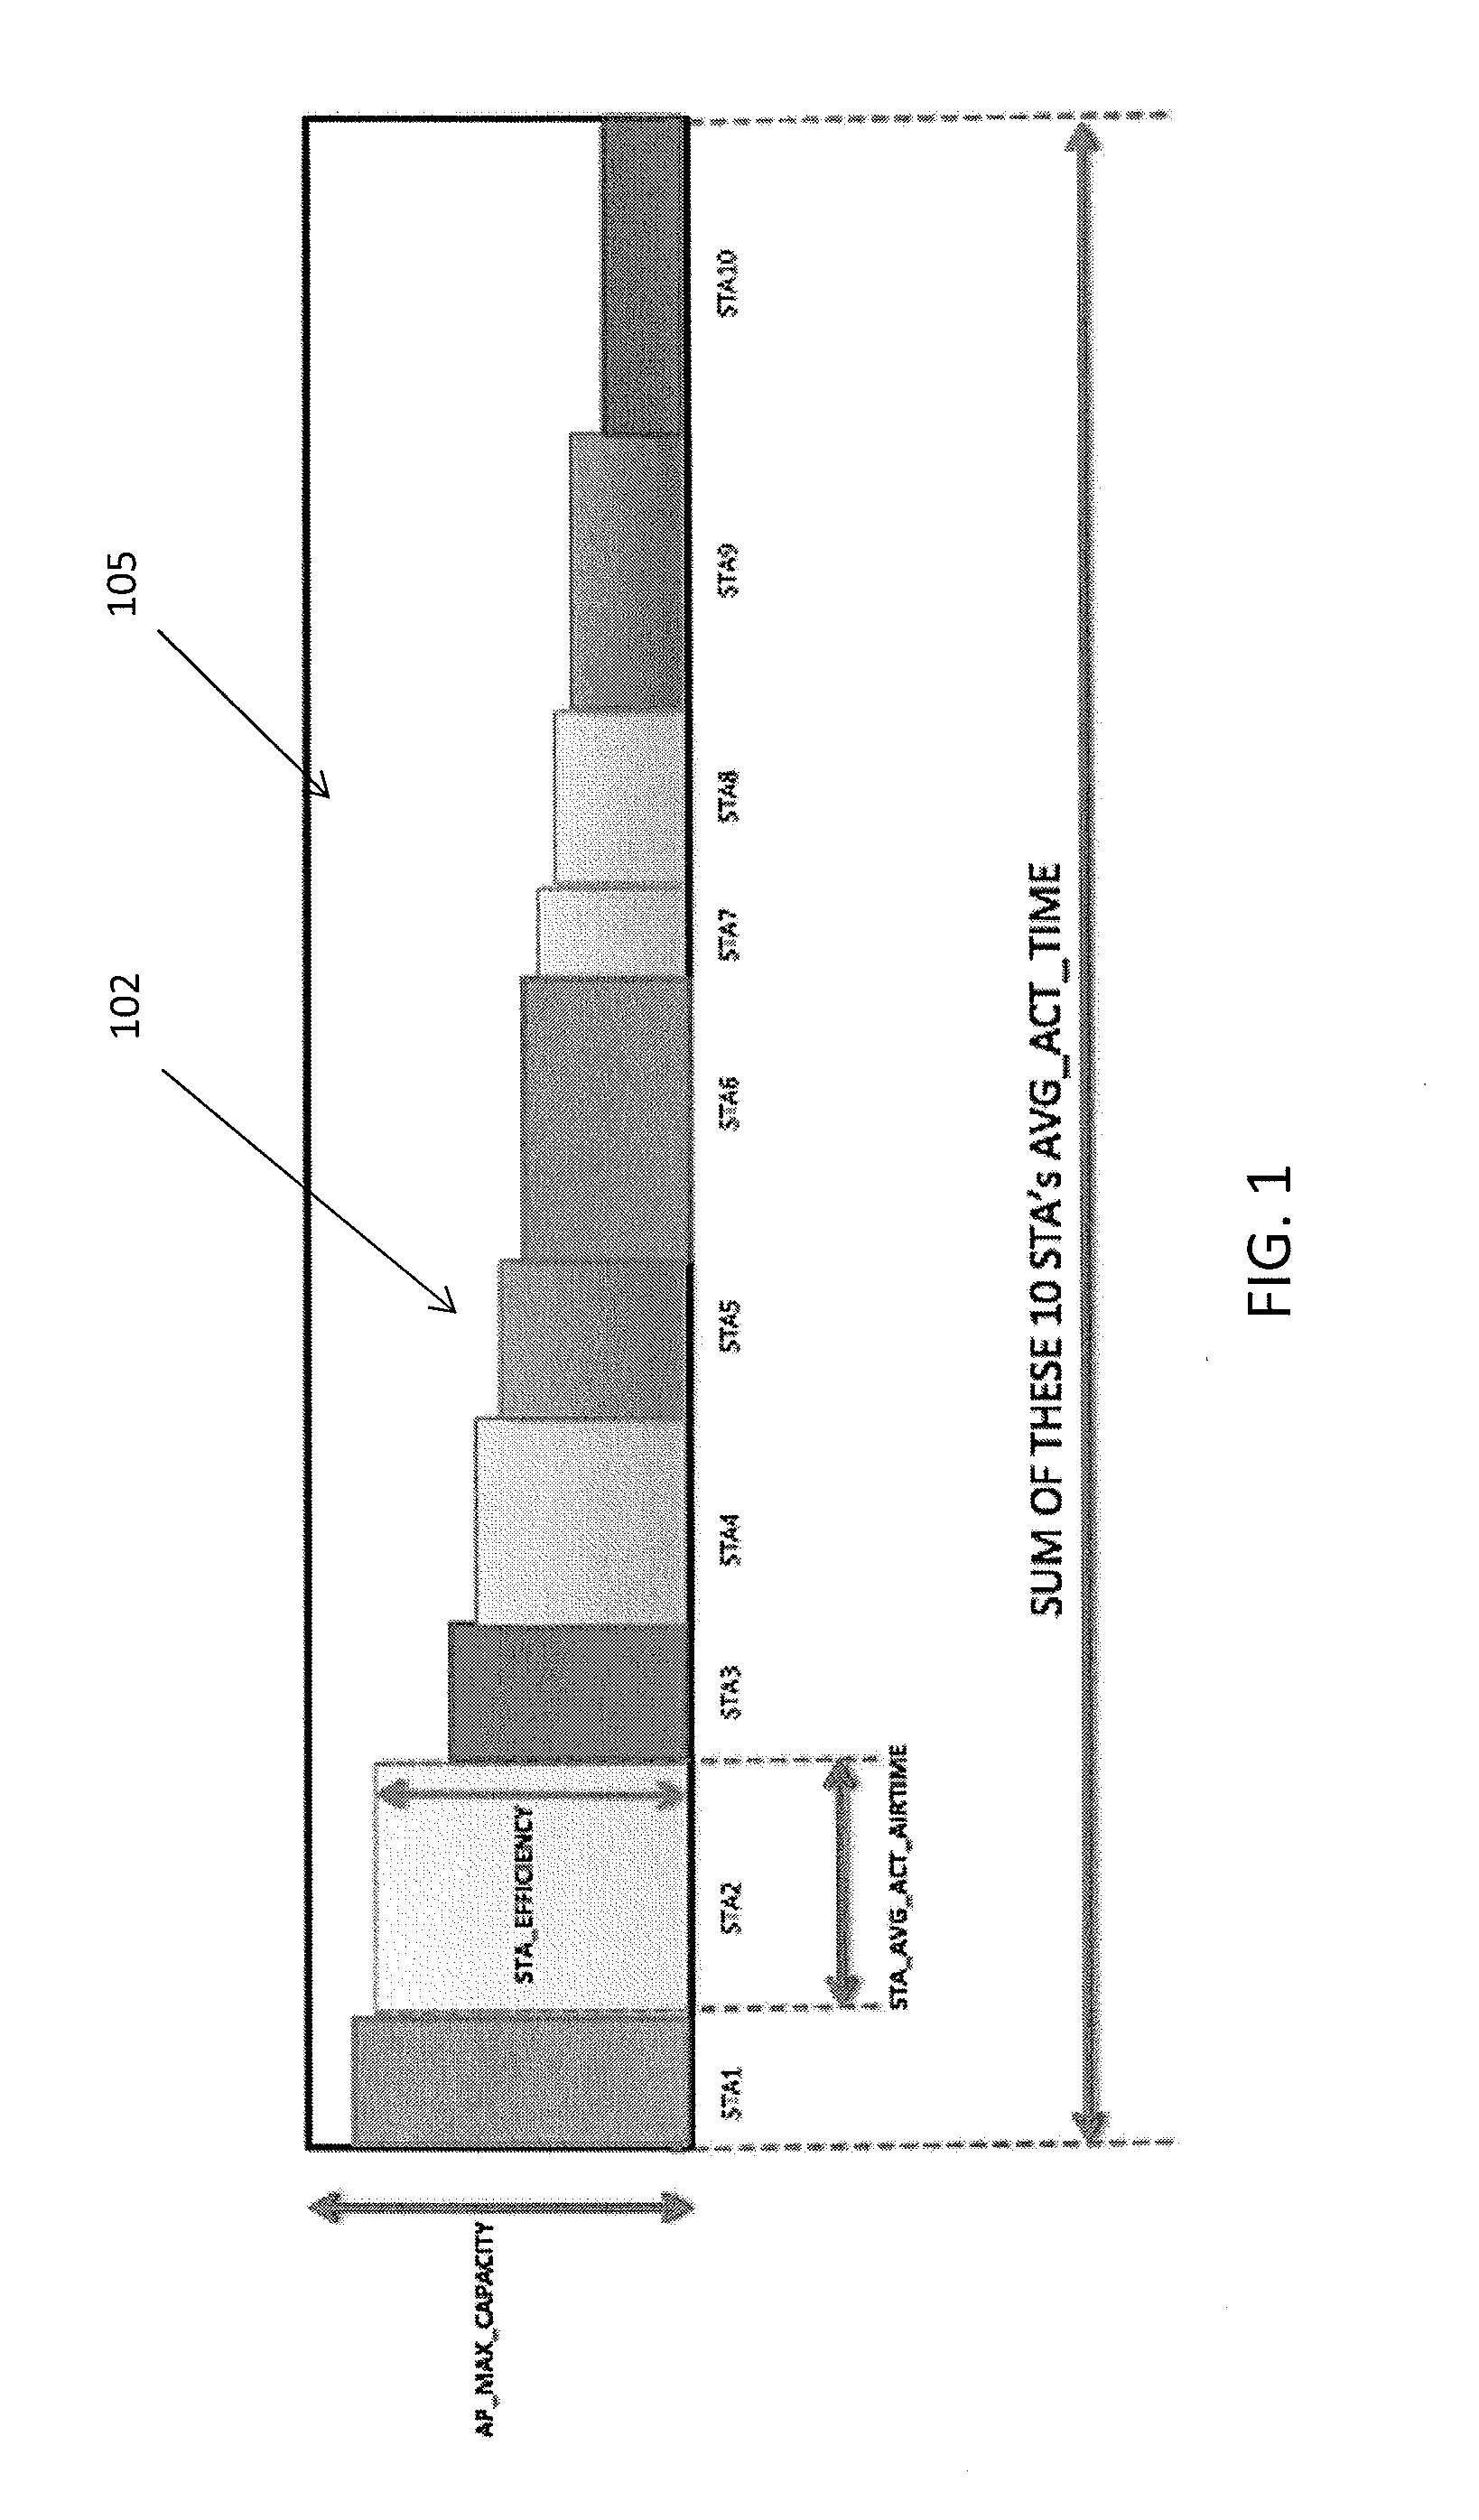
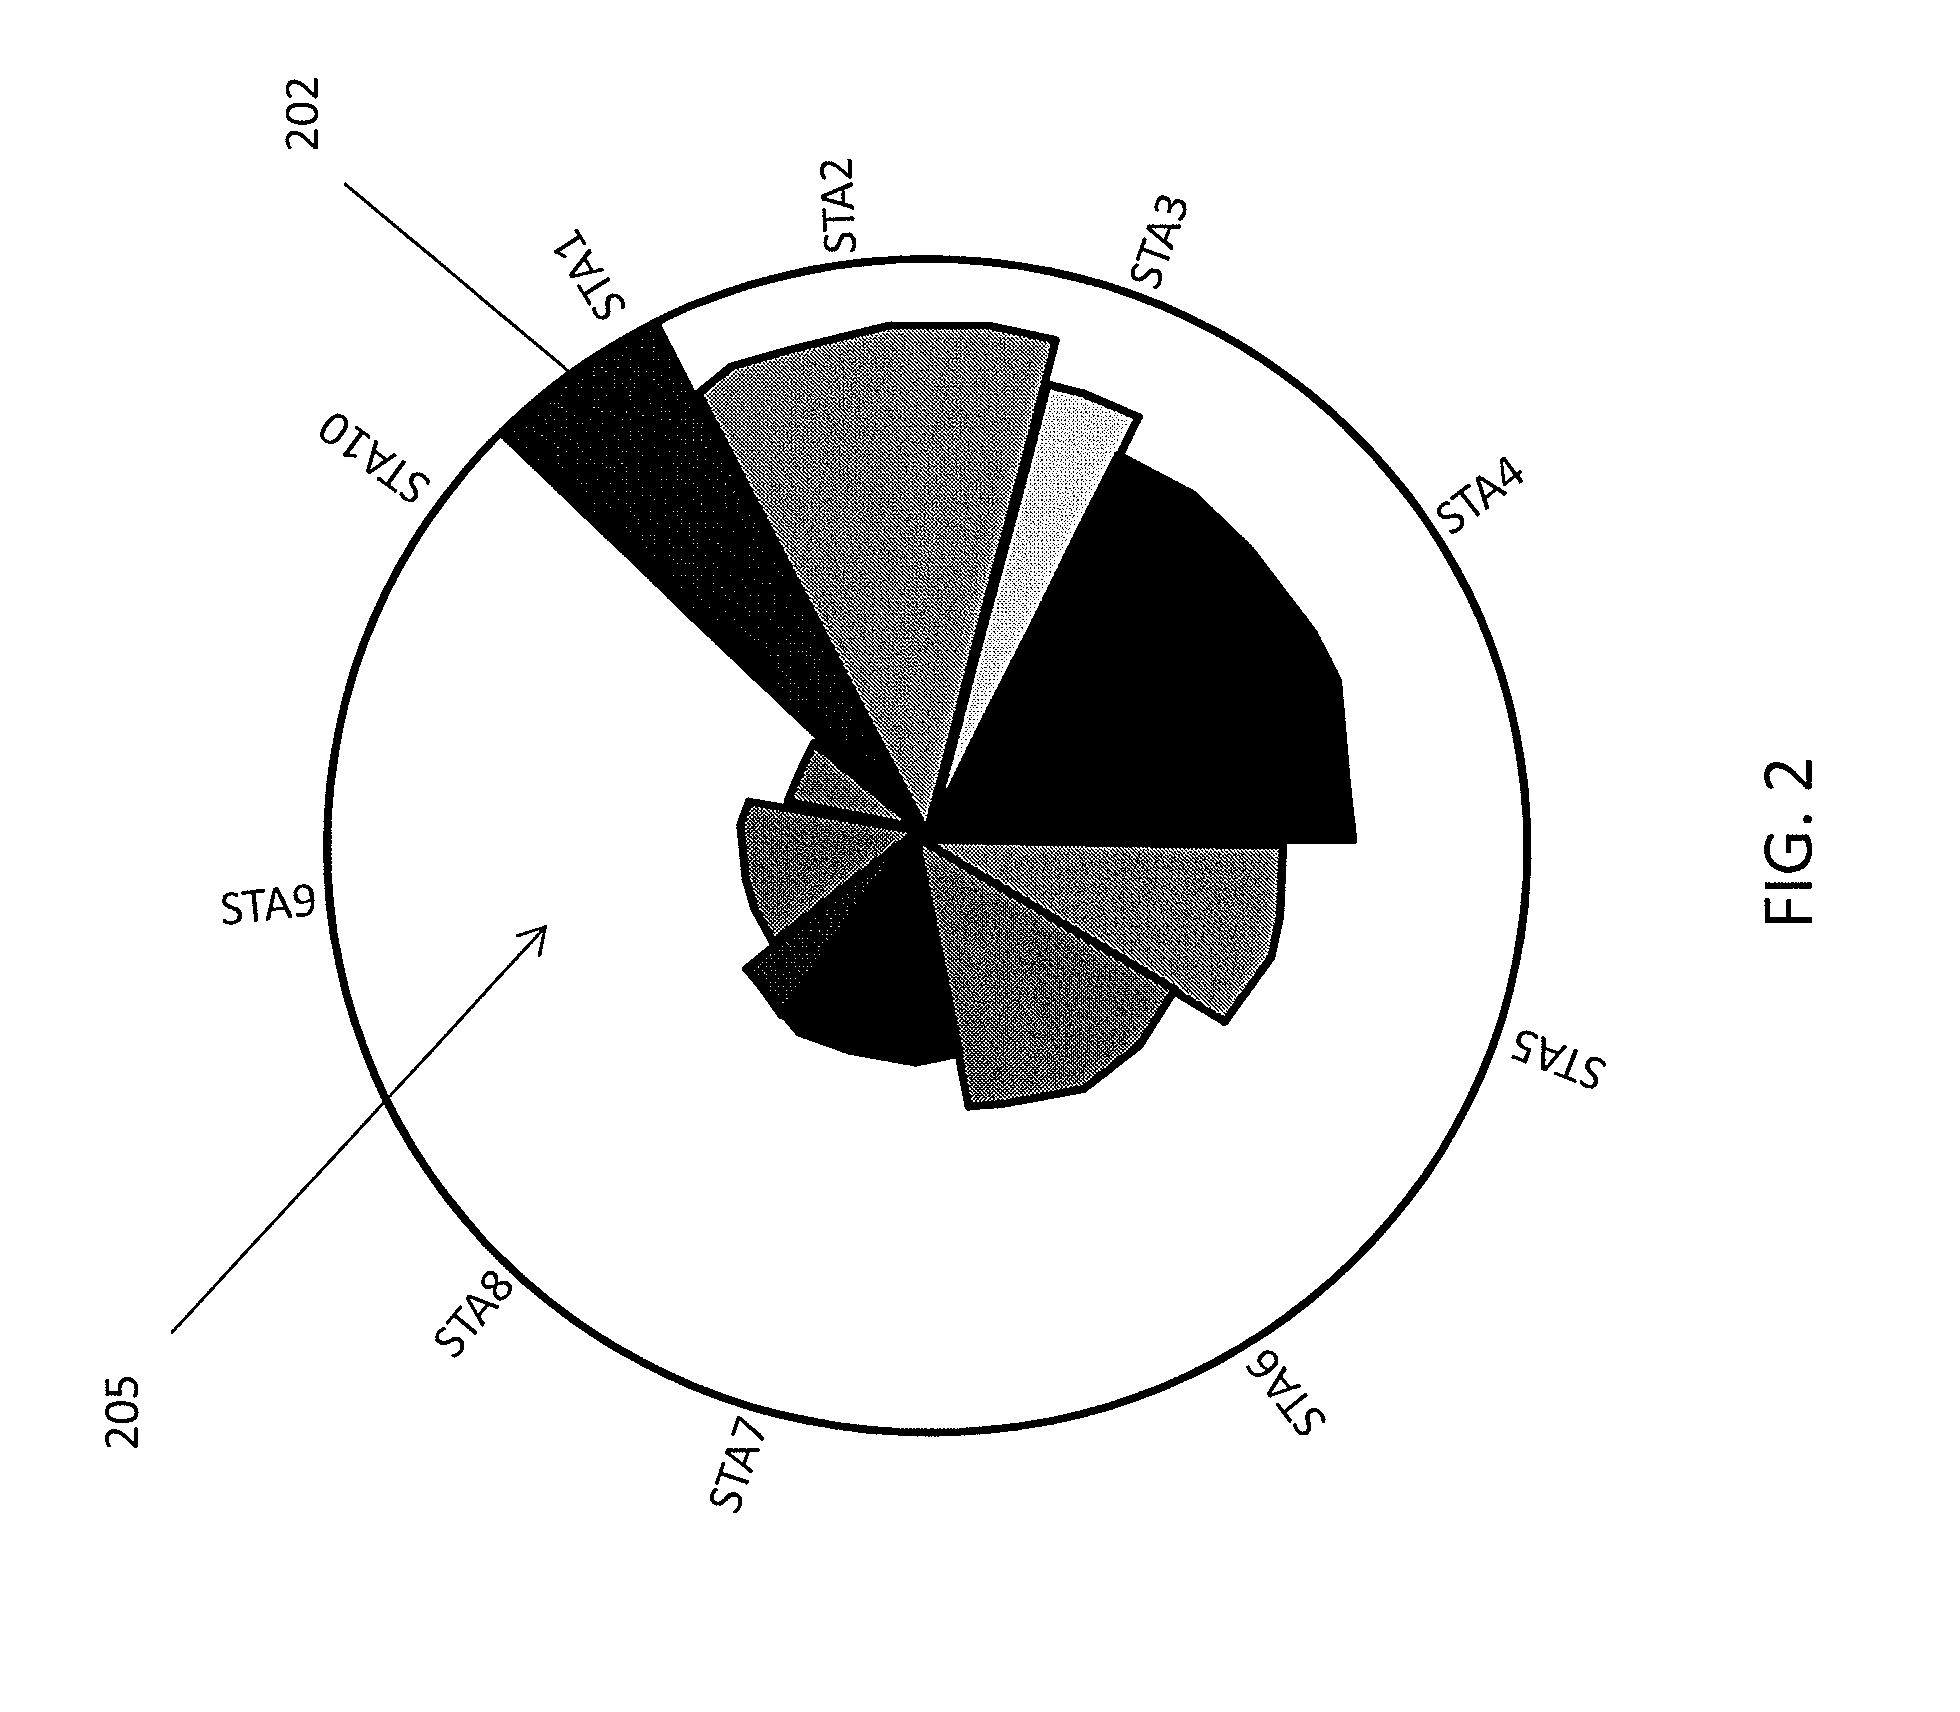
[0194]The techniques described herein typically relate to time division multiple access (TDMA). TDMA may refer to a channel access method for shared medium networks that allows several users to share the same frequency channel by dividing the signal into different time slots. For example, users may transmit in rapid succession, one after the other, each using its own time slot. This may allow multiple stations to share the same transmission medium (e.g. radio frequency channel) while using only a part of the channel capacity. As a simplified example, if TDMA were a party, and there were three guests, Alice, Bob, and Carol talking to the host, each guest may share time talking with the host. For example, for the first 10 seconds, Alice may talk to the host, for the next 10 seconds, its Bob's turn to talk to the host, for the next 10 seconds, its Carol's turn to talk to the host, then for the next 10 seconds, back to Alice, then Bob, and so on. Thus, the frequency-range that is being ...


PUM


Abstract

Methods and apparatuses providing a visual metric of the efficiency of a network of devices communicating through a wireless access point (AP). These apparatuses and methods may also determine and display pseudo-dynamic error vector magnitude (EVM) information for a network of wireless stations, including displaying a pseudo-dynamic constellation diagrams using EVM information. These methods and apparatuses may transmit a plurality of sounding packets from each of one or more radio devices different modulation types (e.g., BPSK, QPSK, 16QAM, 64QAM, 256QAM and 1024QAM), and receiving at least some of the sounding packets at a second radio device (e.g., an access point) and determining EVM information from the received sounding packets, and displaying (or providing for display) a constellation diagram including pseudo-dynamic EVM information that is a constrained approximation of actual EVM information.

Description

CROSS REFERENCE TO RELATED APPLICATIONS[0001]This patent application is a continuation of U.S. patent application Ser. No. 14 / 753,952, filed on Jun. 29, 2015, titled “METHODS AND APPARATUSES FOR GRAPHICALLY INDICATING STATION EFFICIENCY AND PSEUDO-DYNAMIC ERROR VECTOR MAGNITUDE INFORMATION FOR A NETWORK OF WIRELESS STATIONS,” which claims priority to U.S. Provisional Patent Application No. 62 / 044,298, filed on Aug. 31, 2014, and titled “METHODS AND APPARATUSES FOR MONITORING NETWORK HEALTH”; U.S. Provisional Patent Application No. 62 / 085,218, filed on Nov. 26, 2014, and titled “METHODS AND APPARATUSES FOR MONITORING NETWORK HEALTH”; and U.S. Provisional Patent Application No. 62 / 104,669, filed on Jan. 16, 2015, titled “METHODS AND APPARATUSES FOR MONITORING AND IMPROVING NETWORK HEALTH,” each of which is herein incorporated by reference in its entirety.INCORPORATION BY REFERENCE[0002]All publications and patent applications mentioned in this specification are herein incorporated by ...

Claims


Application Information

Patent Timeline
Patent Type & Authority Applications(United States)
IPC IPC(8): H04W24/02H04W72/04H04W72/06
CPCH04W24/02H04W72/0453H04W24/08H04W88/08H04W24/10H04W72/06H04L43/0847H04M15/58H04L43/045H04L41/22H04L43/0817H04W24/04H04W72/563H04W16/00
Inventor DAYANANDAN, SRIRAMPONNAMPALAM, VISHPERA, ROBERT, J.
Owner UBIQUITI INC
Why Eureka
Try Eureka