Methods, apparatus, and systems for structural analysis using thermal imaging

Inactive Publication Date: 2016-09-29
ESSESS
View PDF7 Cites 79 Cited by
  • Summary
  • Abstract
  • Description
  • Claims
  • Application Information

AI Technical Summary

Benefits of technology

[0031]The provided high-throughput data gathering and analysis provided herein can also facilitate more accurate and faster estimates of the energy consumption and total cost of ownersh

Problems solved by technology

Images obtained via handheld imaging devices are costly to obtain at large scale and require substantial manual effort and human labor, thereby limiting the scope of building energy audits and improvements that reduce overall energy consumption at large scales.
While there are systems and methods presently available for surveying buildings, there are various limitations associated with such methods.
For example, a thermal image a

Method used


Image

  • Methods, apparatus, and systems for structural analysis using thermal imaging
  • Methods, apparatus, and systems for structural analysis using thermal imaging
  • Methods, apparatus, and systems for structural analysis using thermal imaging

Examples


Example

Example 1

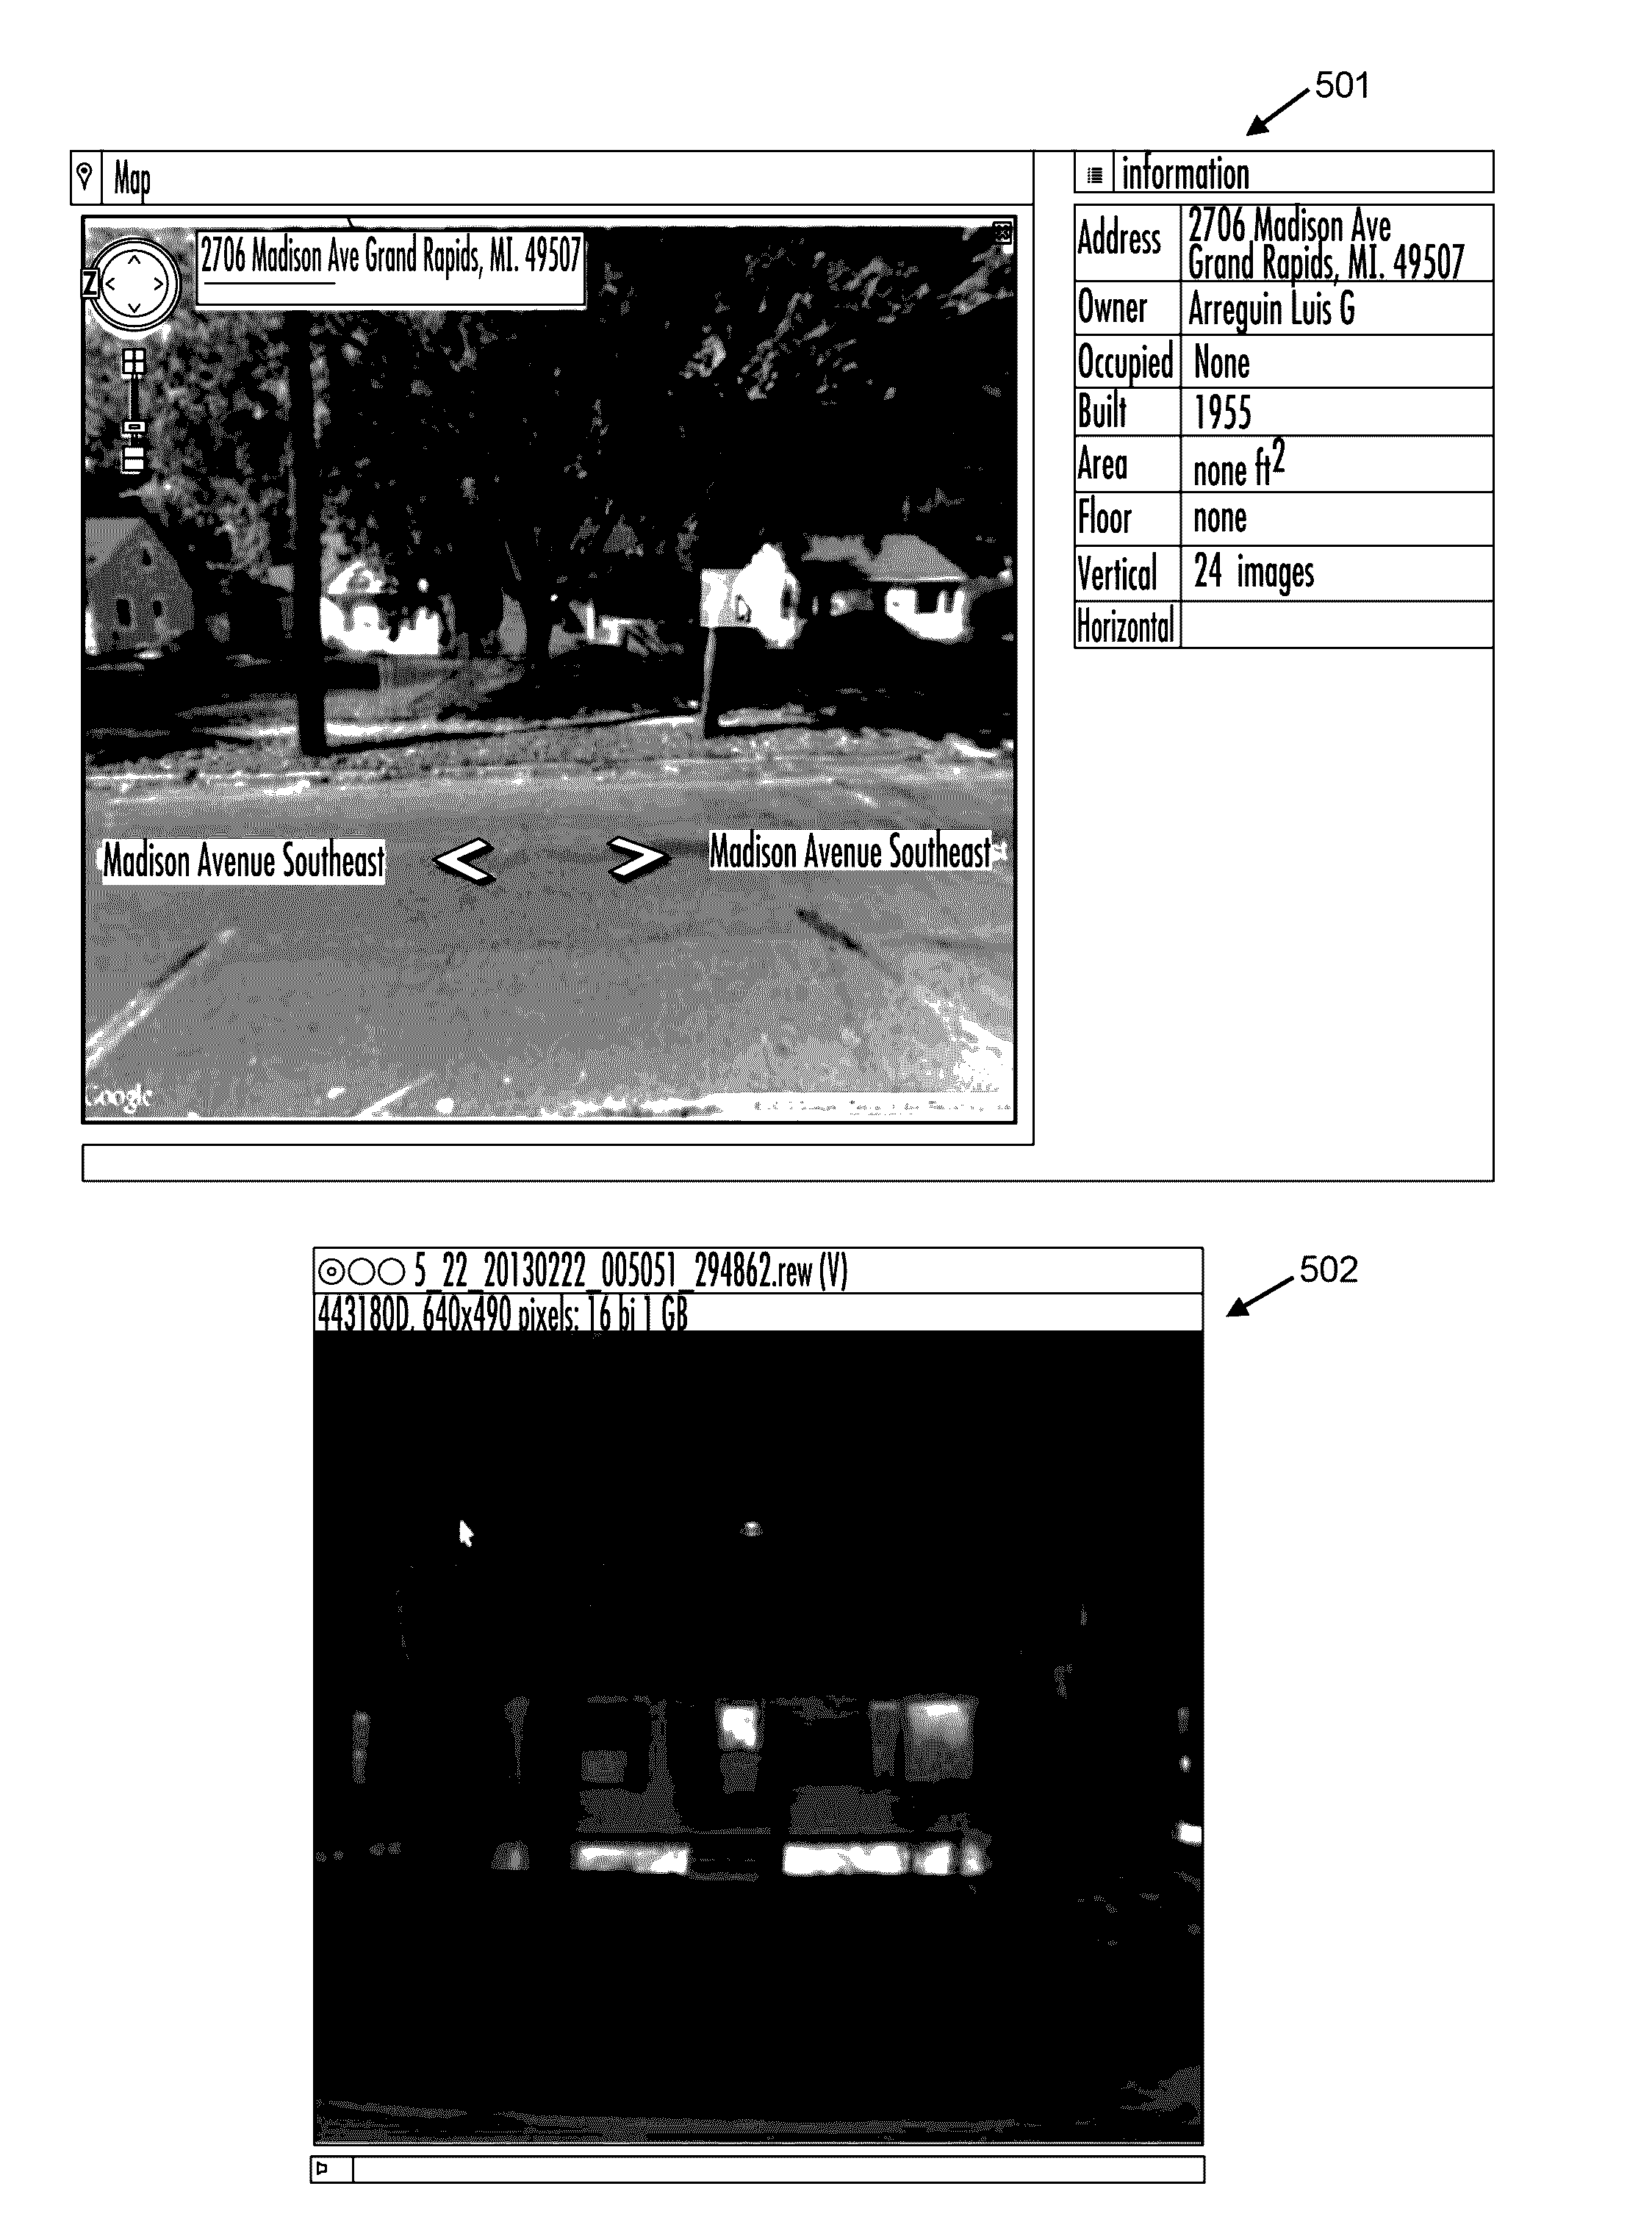
[0113]FIGS. 5 and 6 show example screenshots from a user application (app) provided in connection with an example embodiment of the present invention. The top portions 501 and 601 of FIGS. 5 and 6 displays homes adjacent to one another. A user of the app may select a home from the images shown at 501 and 601. Upon selection, the app displays a thermal image of the home to the user, shown at the bottom portions 502 and 602 of FIGS. 5 and 6. Each app provides an address of the building and indicates the number of vertical images associated with a given building (e.g., 24 images at 501 and 601 in the examples shown) which can be viewed via the app.

Example

Example 2

[0114]FIGS. 7-16 show example reports that can be generated by a system from the sets of images obtained of the structure and the subsequent analysis of the images. The reports can be generated for a user, such as an owner of the house or commercial building. The reports can be presented by way of an overall assessment of the structure.

[0115]FIG. 7 shows an example thermal image of a home 701 and various example metrics associated with the home. The metrics are derived by capturing images of the home and processing the images along with separate data, as described elsewhere herein. The metrics include comfort performance (or score) 702, efficiency performance 704, and total cost of ownership (TCO) performance 706, all of which are displayed as percentages or percentiles, with 0% being “bad” and 100% being “good.” The metrics can also include various risk scores, such as a score associated with an insurability risk or mortgage risk of the user. For the illustrated home, the ...

Example

Example 3

[0126]Structural data can be used to predict utility usage, which can be used to train systems for deriving utility usage from images collected of structures. For example, building data (e.g., living area) can be combined with a surface temperature of a house to draw a correlation between building data and surface temperature. FIG. 17 shows a graph 1701 of an example correlation between a building model score (y-axis) and natural gas consumption score (x-axis). The correlation of graph 1701 can be used to predict natural gas consumption for other buildings. For example, from sets of images collected of a building, a building score can be calculated that is a function of the size of the building and the temperature of the surface of the building. From the building score, graph 1701 can be used to estimate a natural gas consumption score of the building.


PUM


Abstract

The present invention provides methods, apparatus, and systems for analyzing a structure using thermal imaging. A plurality of images of a structure are automatically captured using one or more image capture devices. The images may be captured in one or more ranges of wavelengths of light. The images are then processed to generate image data for the images. The image data can then be analyzed to determine one or more properties of the structure. The images may be captured at an angle with respect to the structure of between approximately 45 to 135 degrees. The images may be captured during a time where one of indirect or no sunlight is present.

Description

[0001]This application claims the benefit of U.S. provisional patent application No. 62 / 173,038 filed on Jun. 9, 2015 and is a continuation-in-part of commonly-owned U.S. patent application Ser. No. 14 / 734,336 filed on Jun. 9, 2015, which is a continuation of International patent application no. PCT / US2013 / 031554 filed on Mar. 14, 2013, each of which is incorporated herein by reference in their entirety and for all purposes.BACKGROUND[0002]The present invention relates to the field of thermal analysis of a structure. More specifically, the present invention is directed towards methods, apparatus, and systems for analyzing a structure and determining properties of the structure using thermal imaging.[0003]As awareness of building energy waste increases and its environmental consequences become increasingly impactful, it may be desirable to survey large physical territories for buildings that are poorly insulated or otherwise using energy inefficiently using vehicle-based thermal imag...

Claims


Application Information

Patent Timeline
IPC IPC(8): G06T7/00G06T7/60G06V10/143
CPCG06T7/001G06T7/602G06T7/0018G06T2207/30184G06T2207/10048G06T2207/10036G06T2207/10016G06T7/0022G06T2207/30132G06V20/10G06V10/143H04N23/698H04N23/11
Inventor PHAN, LONGSINGH, NAVROOPPALJESNECK, JONATHANFALKOWSKI, JANHAUSFATHER, EZEKIELMORRIS, WILLIAMSCARAMELLINO, THOMAS
Owner ESSESS
Why Eureka
Try Eureka