Magnetic resonance imaging apparatus and control method thereof
a magnetic resonance imaging and control method technology, applied in the field of magnetic resonance imaging, to achieve the effect of suppressing imaging interruption
- Summary
- Abstract
- Description
- Claims
- Application Information
AI Technical Summary
Benefits of technology
Problems solved by technology
Method used
Image
Examples
example 1
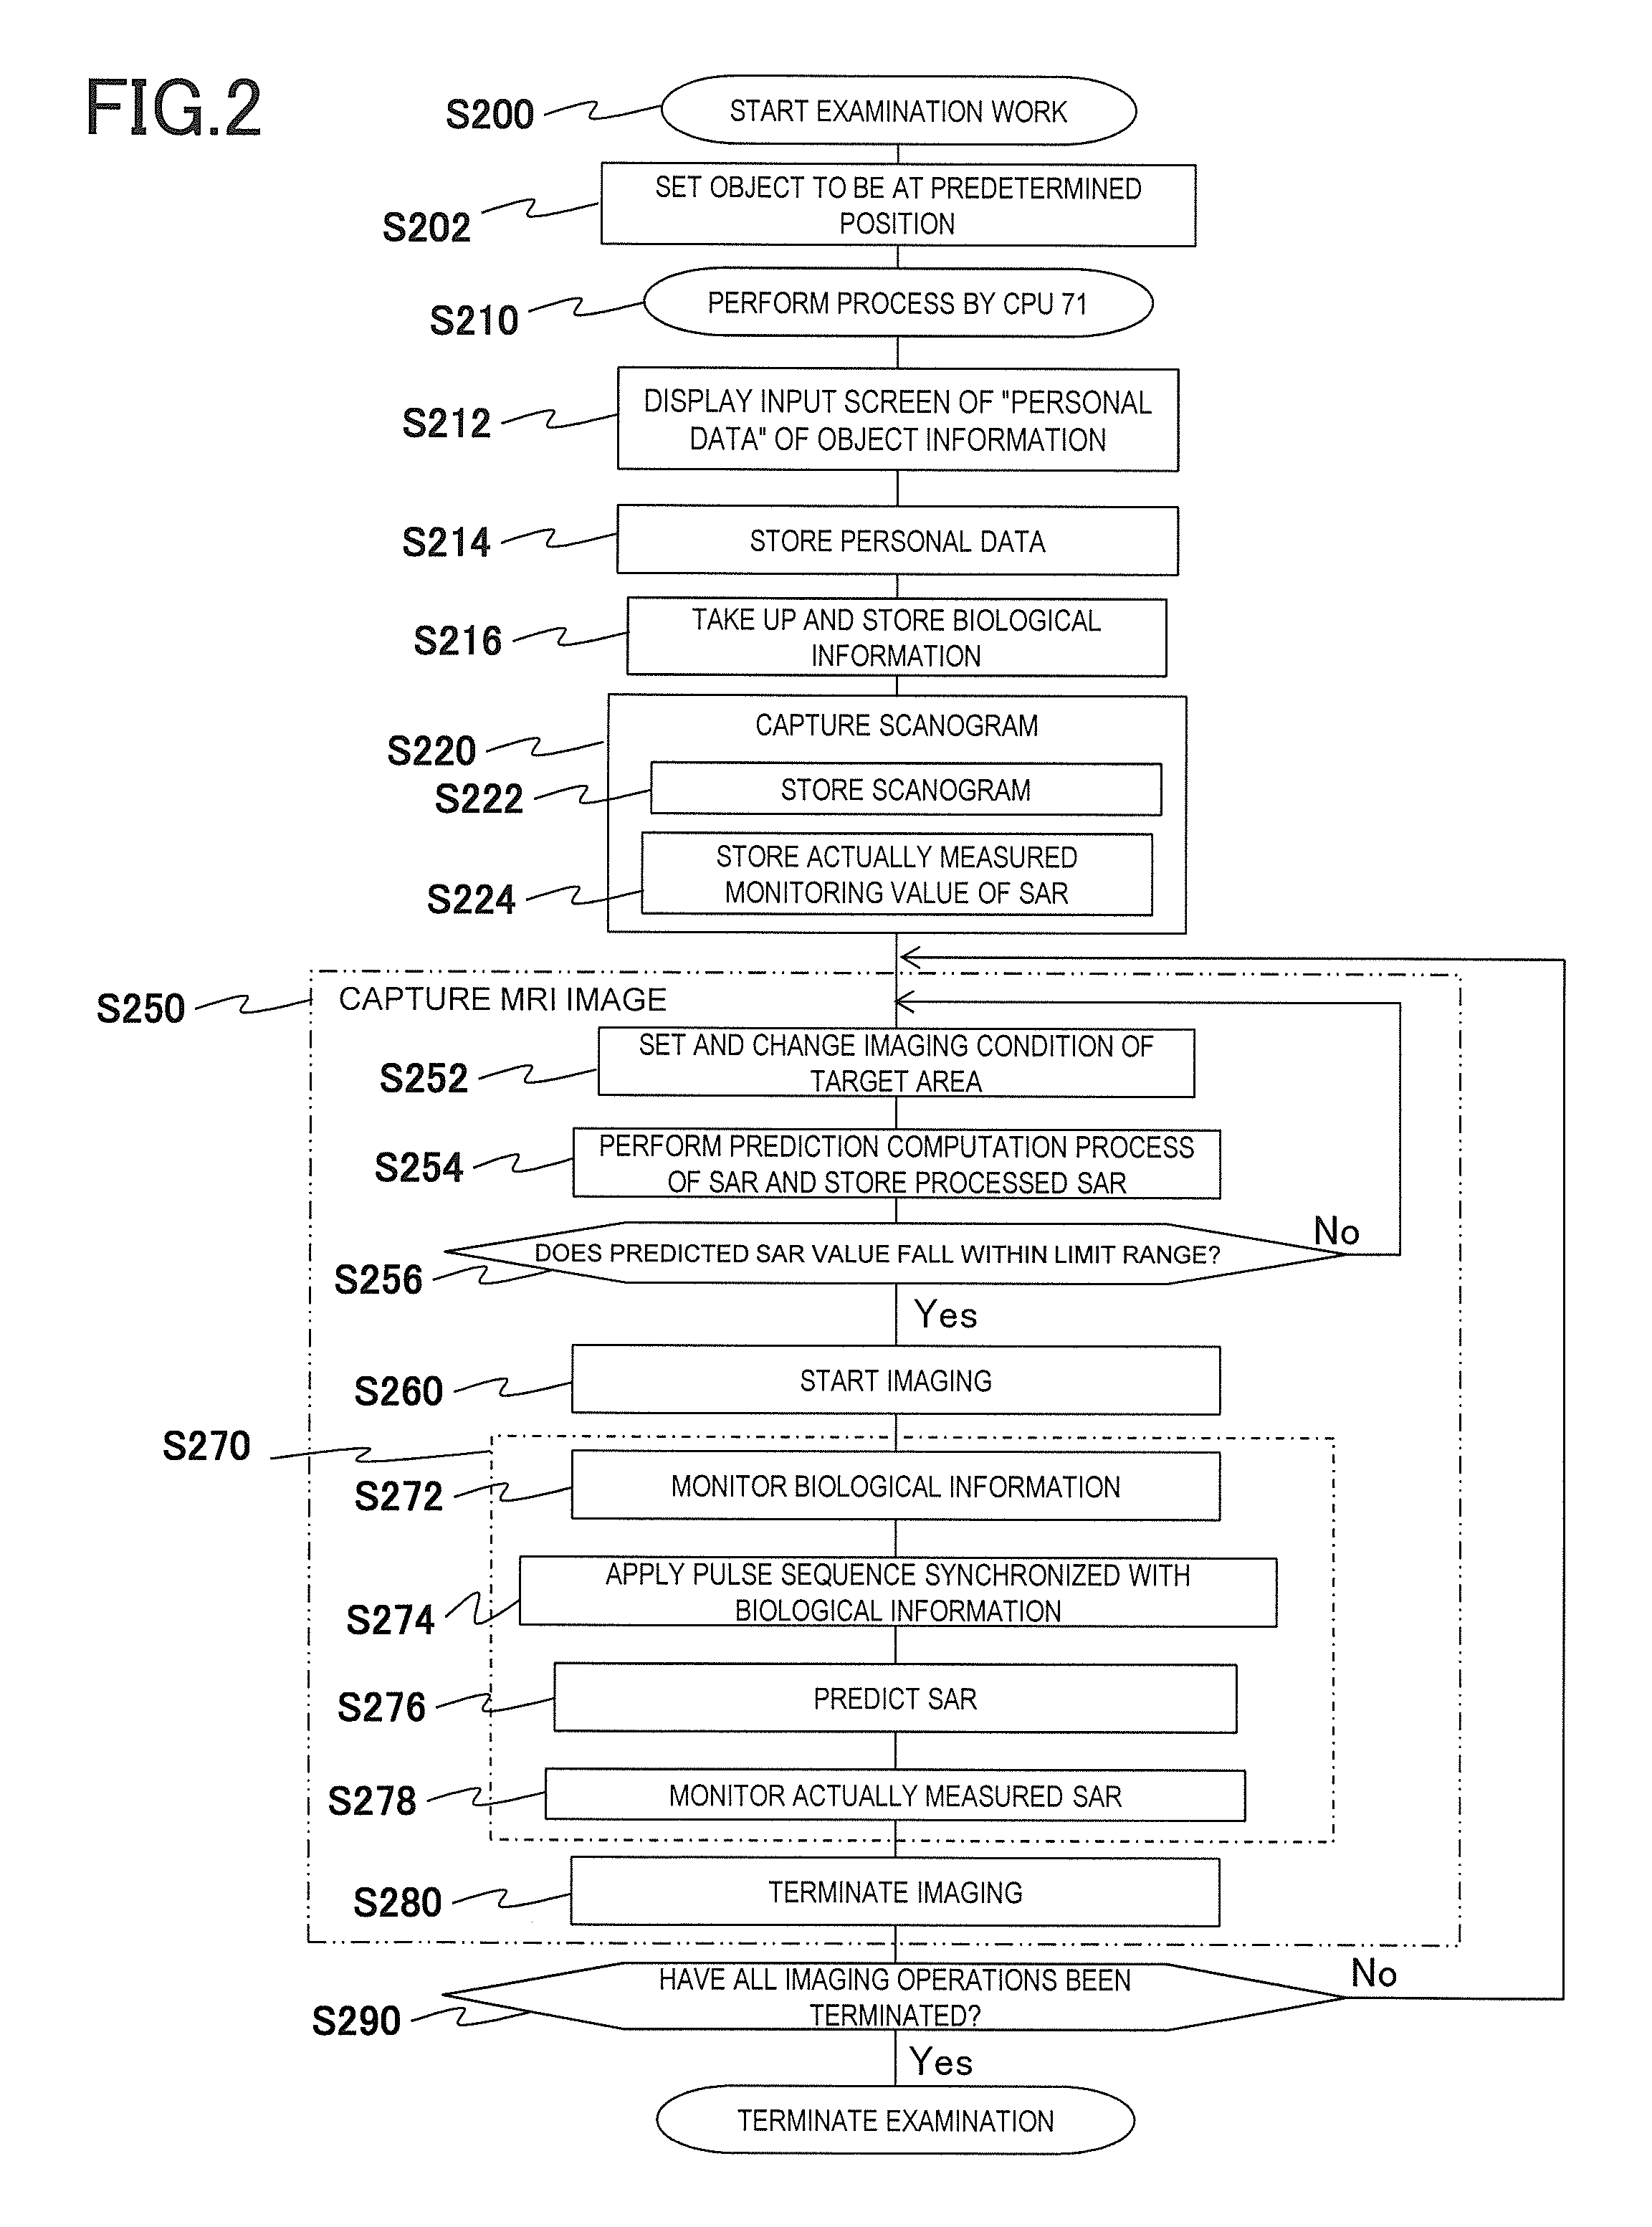
[0085]FIG. 5 is a time table illustrating one processing method related to SAR prediction computation before the execution of scanning for imaging. In addition, FIG. 6 shows a flow chart of processing of the CPU 71 which is performed to perform a process based on the time table described in FIG. 5, and is an alternative to step S252 to step S256 shown in FIG. 2. Procedures related to substantially the same process as the procedures of the flow chart described in FIG. 2 will be denoted by the same reference numerals and signs.
[0086]In step S252, an imaging condition is set, or the previous setting contents are changed. In step S352, biological information 92 is measured from the biological information reception unit 90. The biological information 92 is, for example, an electrocardiogram. For example, a period of a pulse, and the like are measured in an electrocardiogram of an object 11. The order of step S252 or step S352 is an example and may vary.
[0087]The obtained biological infor...
example 2
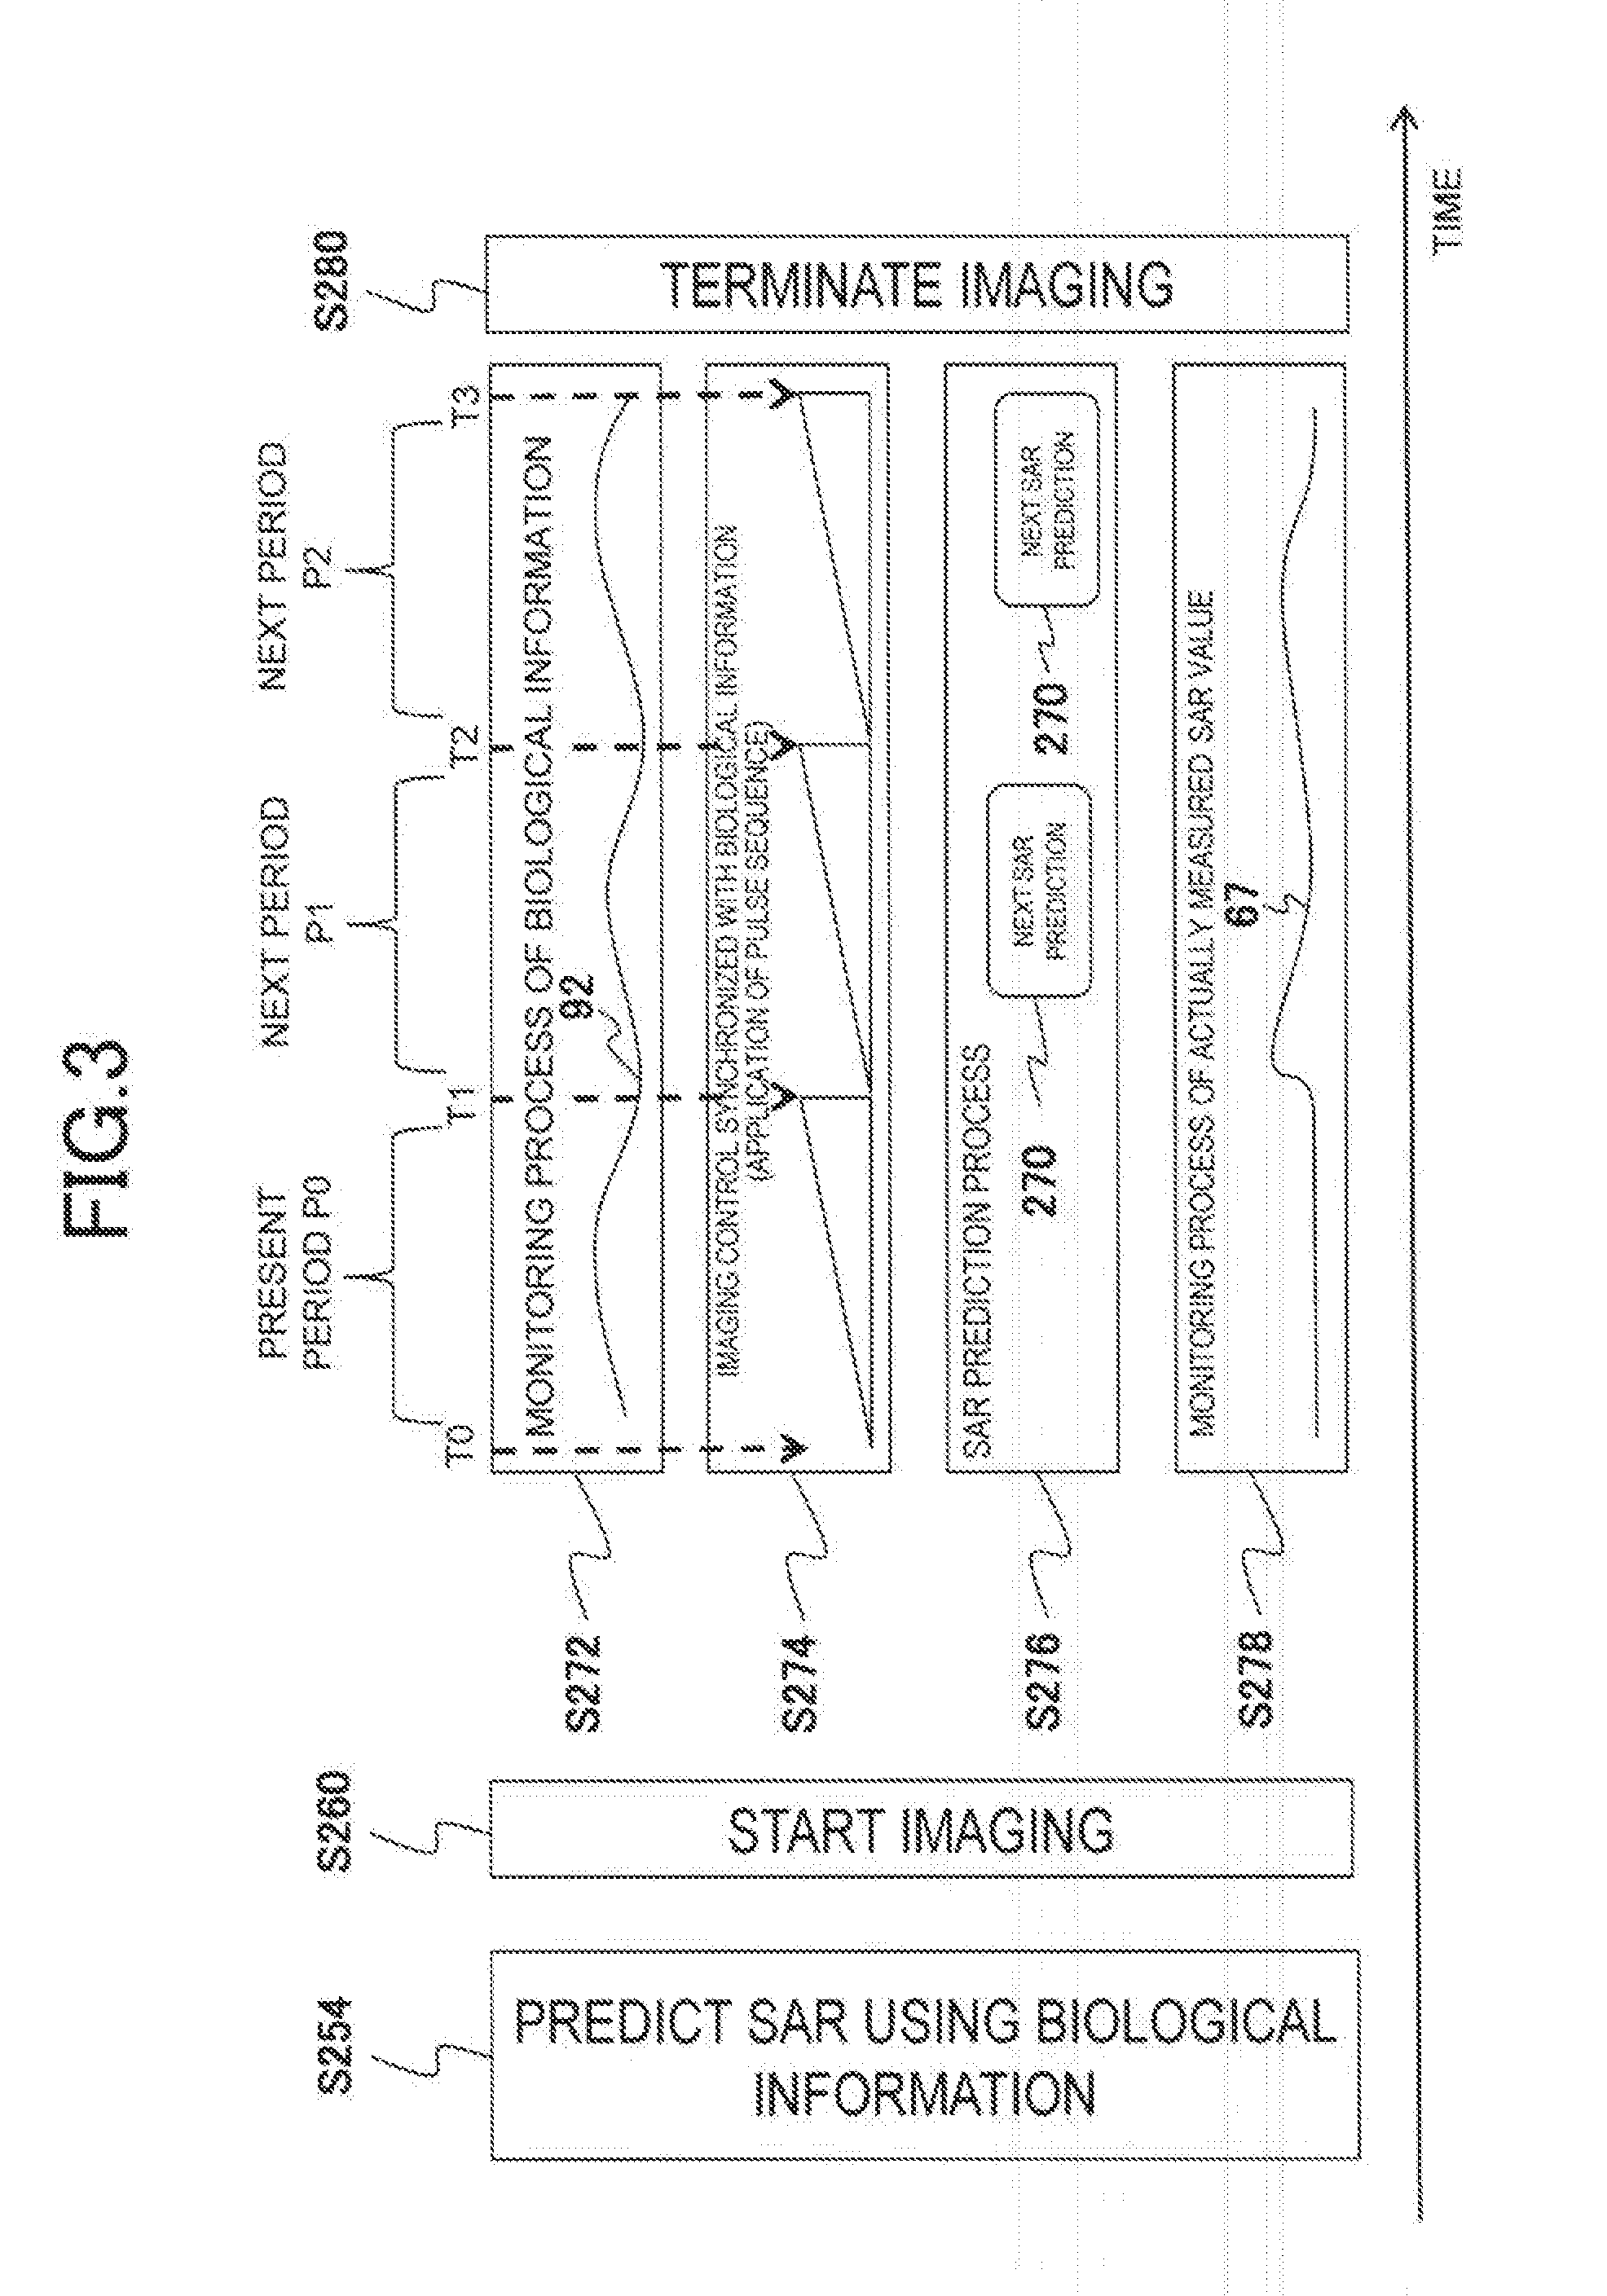
[0092]Example 2 of the invention includes contents related to SAR prediction during scanning. A description will be given using a table of FIG. 7 and a flow chart of FIG. 8. Meanwhile, the flow chart shown in FIG. 8 has processing contents that are substantially the same as those of the flow chart described in FIG. 4. Although essential processing contents of step S382 are the same as those of the corresponding step S272 of FIG. 4, the process of step S382 will be described again. Further, although step S384 of FIG. 8 basically includes the same procedure as that in FIG. 4, a description thereof is omitted in FIG. 4, and thus step S384 will also be described.
[0093]In the time table described in FIG. 7, an SAR is predicted on the basis of a change in the repetition of biological information 92. Next, imaging is performed in accordance with a pulse sequence, and an SAR is actually measured in the imaging. These operations are as shown in the flow chart of FIG. 8, and the specific oper...
example 3
[0098]Example 3 of the invention includes contents related to SAR prediction during scanning. A description will be given using FIG. 9. FIG. 9 is a diagram showing the completion of synchronous measurement in an (n−1)-th period and the prediction of SARs of an n-th pulse sequence and the subsequent pulse sequences. An SAR before the (n−1)-th period is an actually measured SAR (601) in a monitor. A period Pn of biological information 92 which is an interval 603 between the (n−1)-th period and an (n+1)-th period has an undetermined value due to being measured. A period Pn is calculated using, for example, (Expression 13) from a value of the amount of variation (Pn−1-Pn−2) in the immediately previous period of the biological information, and an average SAR is calculated using (Expression 14). The amount of variation (Pn−1-Pn−2) of the period in (Expression 13) is as described above, and is a term for calculating variations in the previous period Pn−1 and the previous prior period Pn−2....
PUM
 Abstract
Description
Claims
Application Information
 - R&D
- Intellectual Property
- Life Sciences
- Materials
- Tech Scout
- Unparalleled Data Quality
- Higher Quality Content
- 60% Fewer Hallucinations
Browse by: Latest US Patents, China's latest patents, Technical Efficacy Thesaurus, Application Domain, Technology Topic, Popular Technical Reports.
© 2025 PatSnap. All rights reserved.Legal|Privacy policy|Modern Slavery Act Transparency Statement|Sitemap|About US| Contact US: help@patsnap.com


