Graph Database Visualization by Node and Edge Type

a graph database and edge type technology, applied in the field of visualizing and/or querying graph database data, can solve the problems of difficult to understand and navigate the visual representation of the database, and achieve the effect of simplifying the visualization and facilitating user interaction

Active Publication Date: 2017-06-22
BUSINESS OBJECTS SOFTWARE
View PDF11 Cites 29 Cited by
  • Summary
  • Abstract
  • Description
  • Claims
  • Application Information

AI Technical Summary

Benefits of technology

[0007]Embodiments provide an overview visualization of graph data by rendering a graph's structure based upon different node / edge types, rather than upon a total number of nodes and / or edges. These node / edge types are recognized based upon associated metadata. The small number of different node / edge types of a typical graph reduces components for representation in the overview, simplifying that visualization and facilitating user interaction. A user can switch between the graph overview, and a different view affording node-level details. In analysis and / or querying, switching between the overview and the detailed visualization can afford natural and intuitive control over data granularity. For example the overview visualization of graph data may allow a user to initially filter on particular node types, with the subsequent node-level view permitting exploration of finer details while maintaining the overall context of the original graph. Embodiments may transform graph query results into a tables readily consumed by relational-type databases.

Problems solved by technology

Where the volume of data in a graph exceeds a certain amount (e.g., >200 nodes), visual representations thereof may be difficult to understand and navigate.

Method used


Image

  • Graph Database Visualization by Node and Edge Type
  • Graph Database Visualization by Node and Edge Type
  • Graph Database Visualization by Node and Edge Type

Examples


example

[0062]In this example, the graph data is stored in the NEO4J graph database available from Neo4j of San Mateo, California. Data from that graph database was acquired utilizing an extension of the LUMIRA desktop available from SAP SE of Walldorf, Germany, and then stored utilizing the SAP HANA in-memory database platform.

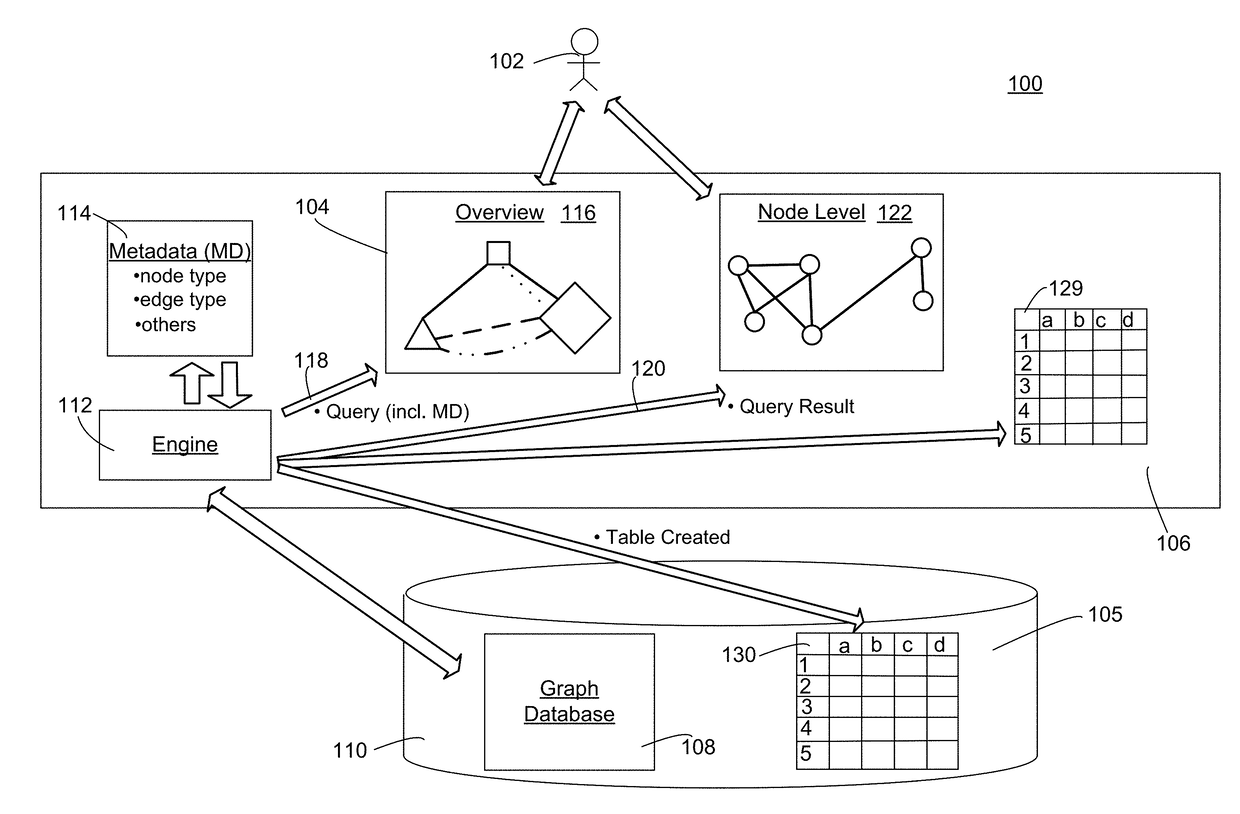
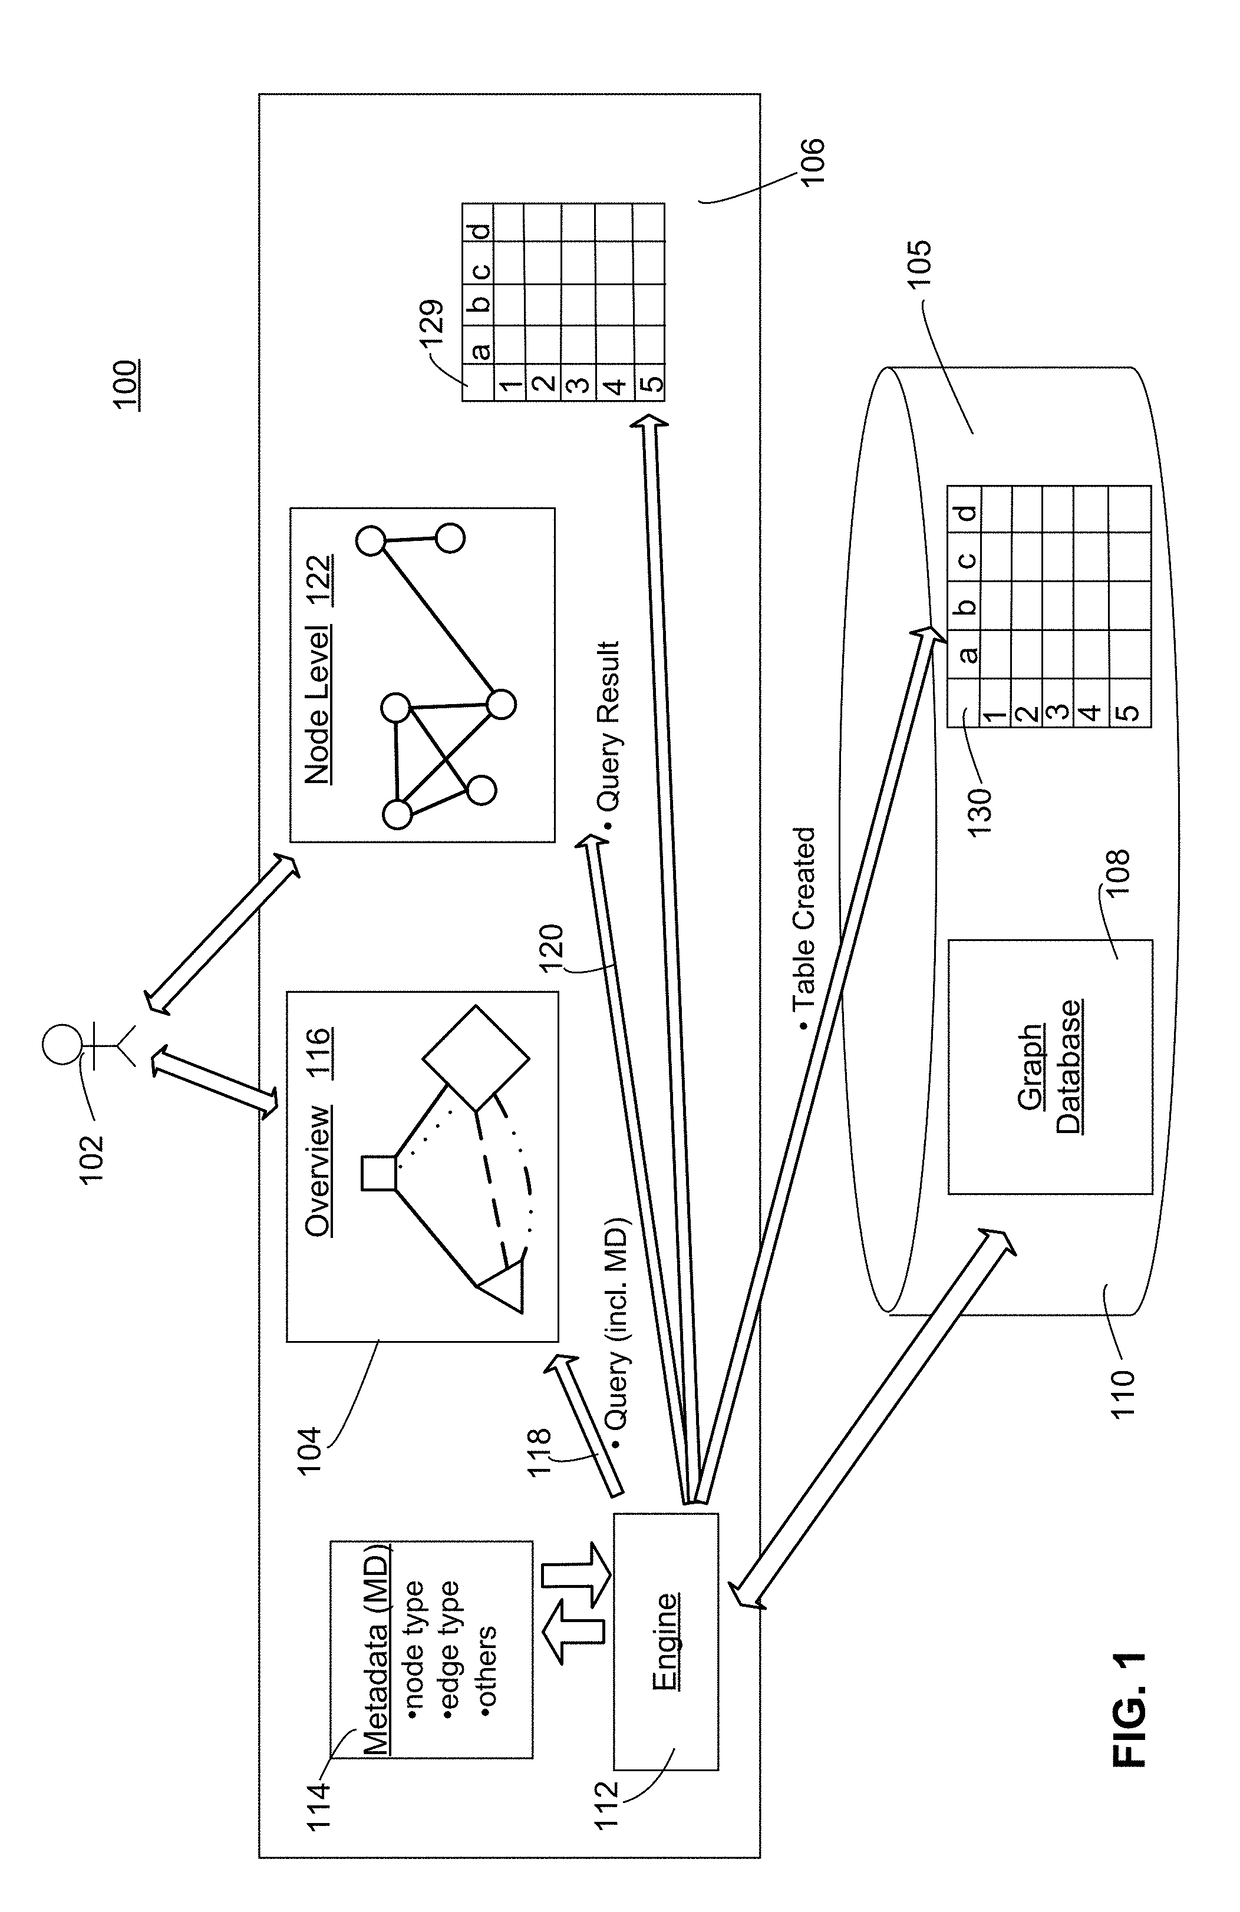
[0063]FIG. 3 provides a simplified diagram illustrating a generic view of an interface screen according to an example. In particular, an interface screen 300 may comprise a menu portion 302, a graph visualization portion 304, and a table visualization portion 306.

[0064]FIGS. 4A-M show various screenshots of interface screens in the example. In particular, FIG. 4A shows an initial overview interface page of social network graph data. This social network graph data includes the following three (3) node types:

[0065]Tweet;

[0066]Hashtag;

[0067]User.

[0068]The overview interface screen of FIG. 4A further shows the social network graph data as including the following five (5)...


PUM


Abstract

Embodiments provide an overview visualization of graph data by rendering a graph's structure based upon different node/edge types, rather than upon a total number of nodes and/or edges. These node/edge types are recognized based upon associated metadata. The small number of different node/edge types of a typical graph reduces components for representation in the overview, simplifying that visualization and facilitating user interaction. A user can switch between the graph overview, and a different view affording node-level details. In analysis and/or querying, switching between the overview and the detailed visualization can afford natural and intuitive control over data granularity. For example the overview visualization of graph data may allow a user to initially filter on particular node types, with the subsequent node-level view permitting exploration of finer details while maintaining the overall context of the original graph. Embodiments may transform graph query results into a tables readily consumed by relational-type databases.

Description

BACKGROUND[0001]Unless otherwise indicated herein, the approaches described in this section are not prior art to the claims in this application and are not admitted to be prior art by inclusion in this section.[0002]Embodiments relate to visualization and / or querying of graph database data. Graph data comprises a plurality of nodes (typically of different types), that are connected together in various ways with links (also typically of different types).[0003]Conventionally, graph data may be visualized as a shape representing the nodes, and connecting lines representing the links between nodes. These links are also referred to herein as edges.[0004]Where the volume of data in a graph exceeds a certain amount (e.g., >200 nodes), visual representations thereof may be difficult to understand and navigate. In such conventional representations, a sheer number of links can overwhelm the chart, an effect exacerbated by small screen sizes of mobile devices (e.g., cell phones) that are in...

Claims


Application Information

Patent Timeline
Patent Type & Authority Applications(United States)
IPC IPC(8): G06F17/30
CPCG06F17/30994G06F17/30958G06F16/26G06F16/9024G06F16/904
Inventor POTIAGALOV, ALEXEIMENARD, SARAHEKELAND, PAULIVANOV, IVAILO
Owner BUSINESS OBJECTS SOFTWARE
Why Eureka
Try Eureka