Automated visualization of a selection of simulation data

a technology of simulation data and automatic visualization, applied in the direction of visual data mining, total factory control, instruments, etc., can solve the problems of increasing complexity of motor control devices, as used, and data that is no longer clear to a person, so as to simplify the visualization of a selection of data and configure the process of designing or developing functionalities of control devices for example more efficiently

Inactive Publication Date: 2008-11-06
SIEMENS AG
View PDF11 Cites 3 Cited by
  • Summary
  • Abstract
  • Description
  • Claims
  • Application Information

AI Technical Summary

Benefits of technology

[0019]An object of the present invention is to simplify the visualization of a selection of data occurring during an execution or simulation of a function algorithm, in order to be able in particular to configure the process of designing or developing functionalities of a control device for example more efficiently.

Problems solved by technology

When designing and / or developing or modifying relatively complex software-implemented function algorithms, the problem arises for the designer charged with the task that during execution or simulation a plurality of data occurs that is no longer clear to a person.
Motor control devices, as used in modem motor vehicles to control an internal combustion engine and typically also used to control and / or regulate further electrical or electronic vehicle components, have become increasingly complex in recent years.
Incorporation in functions provided therewith and analysis of problems during the design and development of motor control devices are correspondingly complex.
For this the designer must use the model to analyze which data is needed, use this operating software in a manual and therefore very complex manner to define which data is to be displayed in one or more windows of a screen output and how the data selected in this manner is to be arranged within the data output.
For function design the manual definition or selection of the data required for a visualization in the operating software represents a time-consuming activity.
Also data changes can occur for every function change undertaken, requiring redefinition or verification of the previous definition in respect of the visualization, representing a further time outlay and being susceptible to error.
There is generally a significant loss of efficiency during the function design process with known methods for visualizing a selection of data from all the data occurring.

Method used


Image

  • Automated visualization of a selection of simulation data
  • Automated visualization of a selection of simulation data
  • Automated visualization of a selection of simulation data

Examples


Embodiment Construction

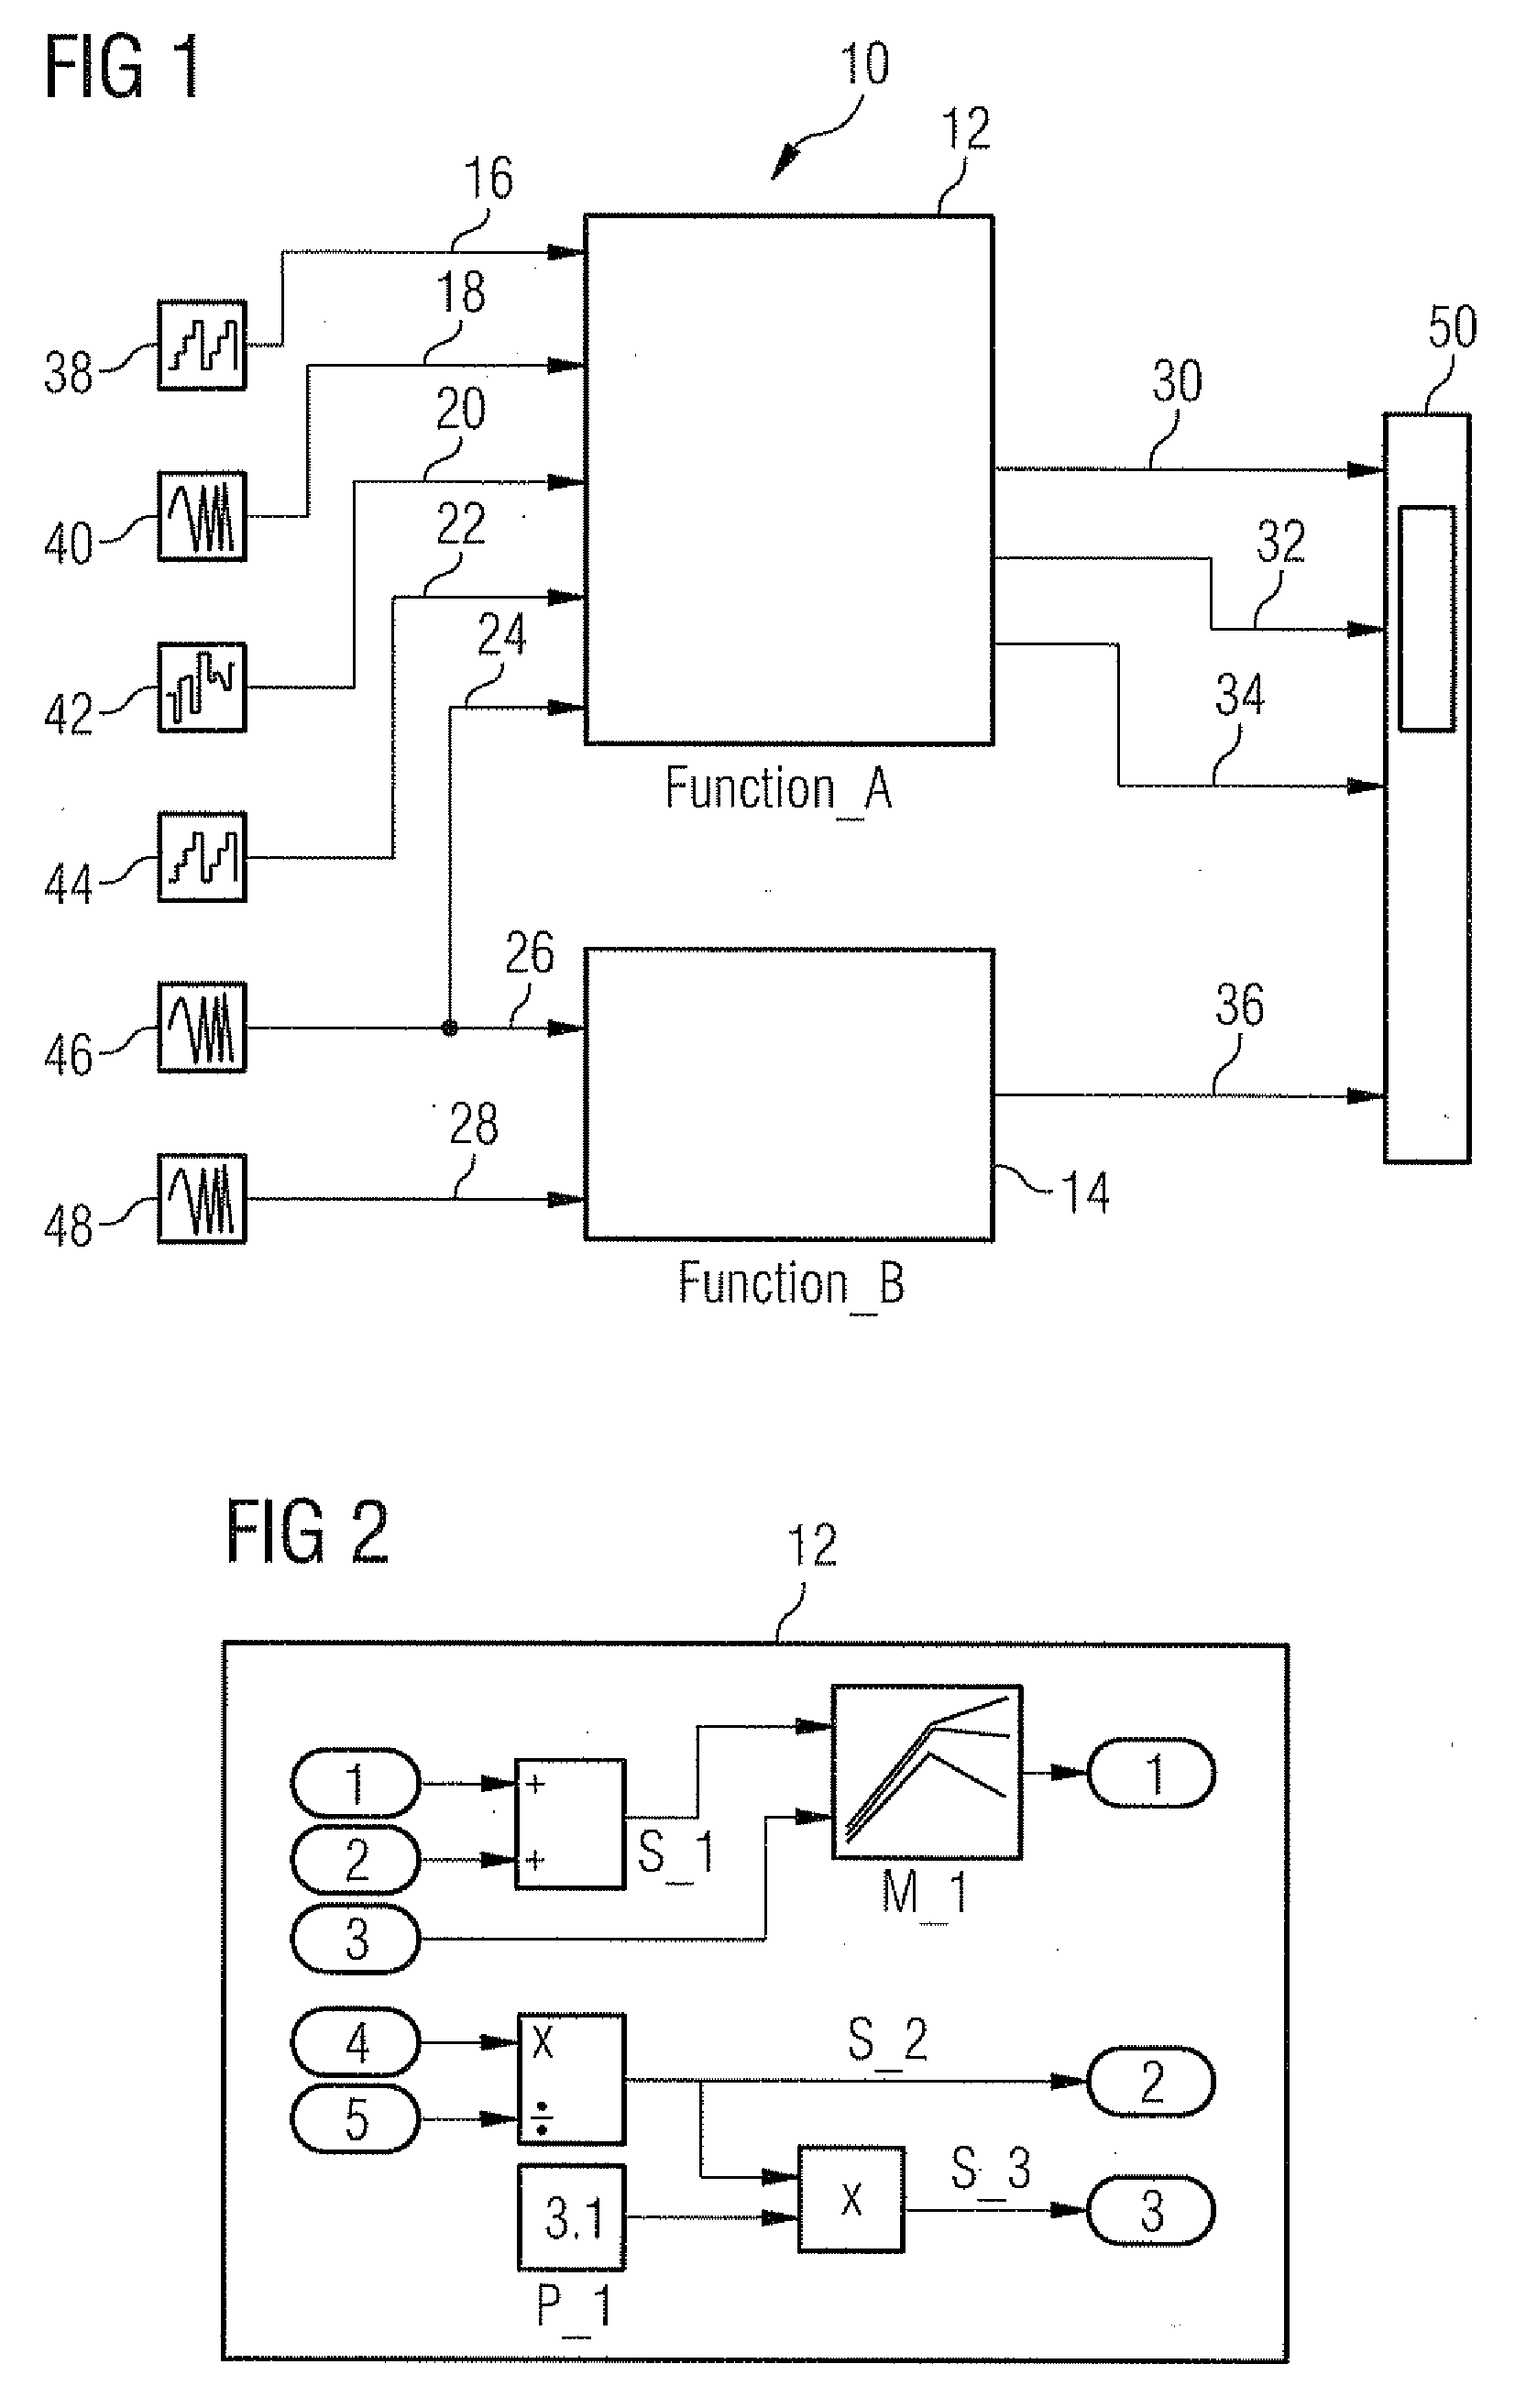
[0051]FIG. 1 shows an example of a function model 10, having two functions or function units 12 and 14.

[0052]The function model 10 also has data path elements 16 to 36, which lead to data inputs of the functions 12 and 14 or from data outputs of said functions in the manner shown.

[0053]In the exemplary embodiment shown the function 12 has five data inputs and three data outputs, while the function 12 has two data inputs and one data output.

[0054]A simulation capability of the model 10 results from the illustrated interfacing on the one hand of data generators 38 to 48 to provide input data of the model 10 by way of data path elements 16 to 24 and 28 and on the other hand of a data visualization unit 50, at which the output-side data path elements 30 to 36 end.

[0055]The data path element 26 is a data path branching from the data path element 24, as shown. This means, as shown, that a function input data item generated by the data generator 46 is routed both (by way of the path 24) to...


PUM


Abstract

The visualization of a selection of data can be simplified. The data occurs during the execution or simulation of a function model on a computer system. It is possible in particular to configure the process of designing or developing functionalities of a control device (e.g. a motor control device) more efficiently. Software operating on the computer system is configured to use a set of rules to select some of all the data items occurring in the function model automatically as the data items to be visualized. A continuous and automated solution for the definition, selection and visual display of the data items required in individual instances is allowed.

Description

CROSS REFERENCE TO RELATED APPLICATIONS[0001]This application claims priority of European Patent Office application No. 07007829.0 EP filed Apr. 17, 2007, which is incorporated by reference herein in its entirety.FIELD OF INVENTION[0002]The present invention relates to the execution or simulation of a function algorithm on a computer system. The term “function algorithm” here is used in contrast to the purely mathematical term “algorithm” to express that it can be used to handle functions in the real world, for example control or regulation tasks. In particular when designing or developing software, which provides such a function algorithm, it is desirable, when executing or simulating the function algorithm on a computer system, for the data resulting in the process to be visualized (e.g. screen display).BACKGROUND OF INVENTION[0003]When designing and / or developing or modifying relatively complex software-implemented function algorithms, the problem arises for the designer charged ...

Claims


Application Information

Patent Timeline
Patent Type & Authority Applications(United States)
IPC IPC(8): G06F9/45G06F3/048G06F3/0482
CPCG06F17/30572G06F16/26Y02P90/02
Inventor BRULL, MARTINBURGER, THOMASMULLER, RALF
Owner SIEMENS AG
Why Eureka
Try Eureka