
Methods for Top-Down Multiplexed Mass Spectral Analysis of Mixtures of Proteins or Polypeptides

a technology of protein and polypeptide mixtures, applied in the field of mass spectrometry, can solve the problems of time-consuming process, expiration of exclusion time, and poor performance of existing dynamic exclusion techniques for analyzing mass spectral mixtures of complex biomolecules, and achieve the effect of simplifying the mass spectrometric analysis

Active Publication Date: 2017-07-20
THERMO FINNIGAN
View PDF0 Cites 10 Cited by
  • Summary
  • Abstract
  • Description
  • Claims
  • Application Information

AI Technical Summary

Benefits of technology

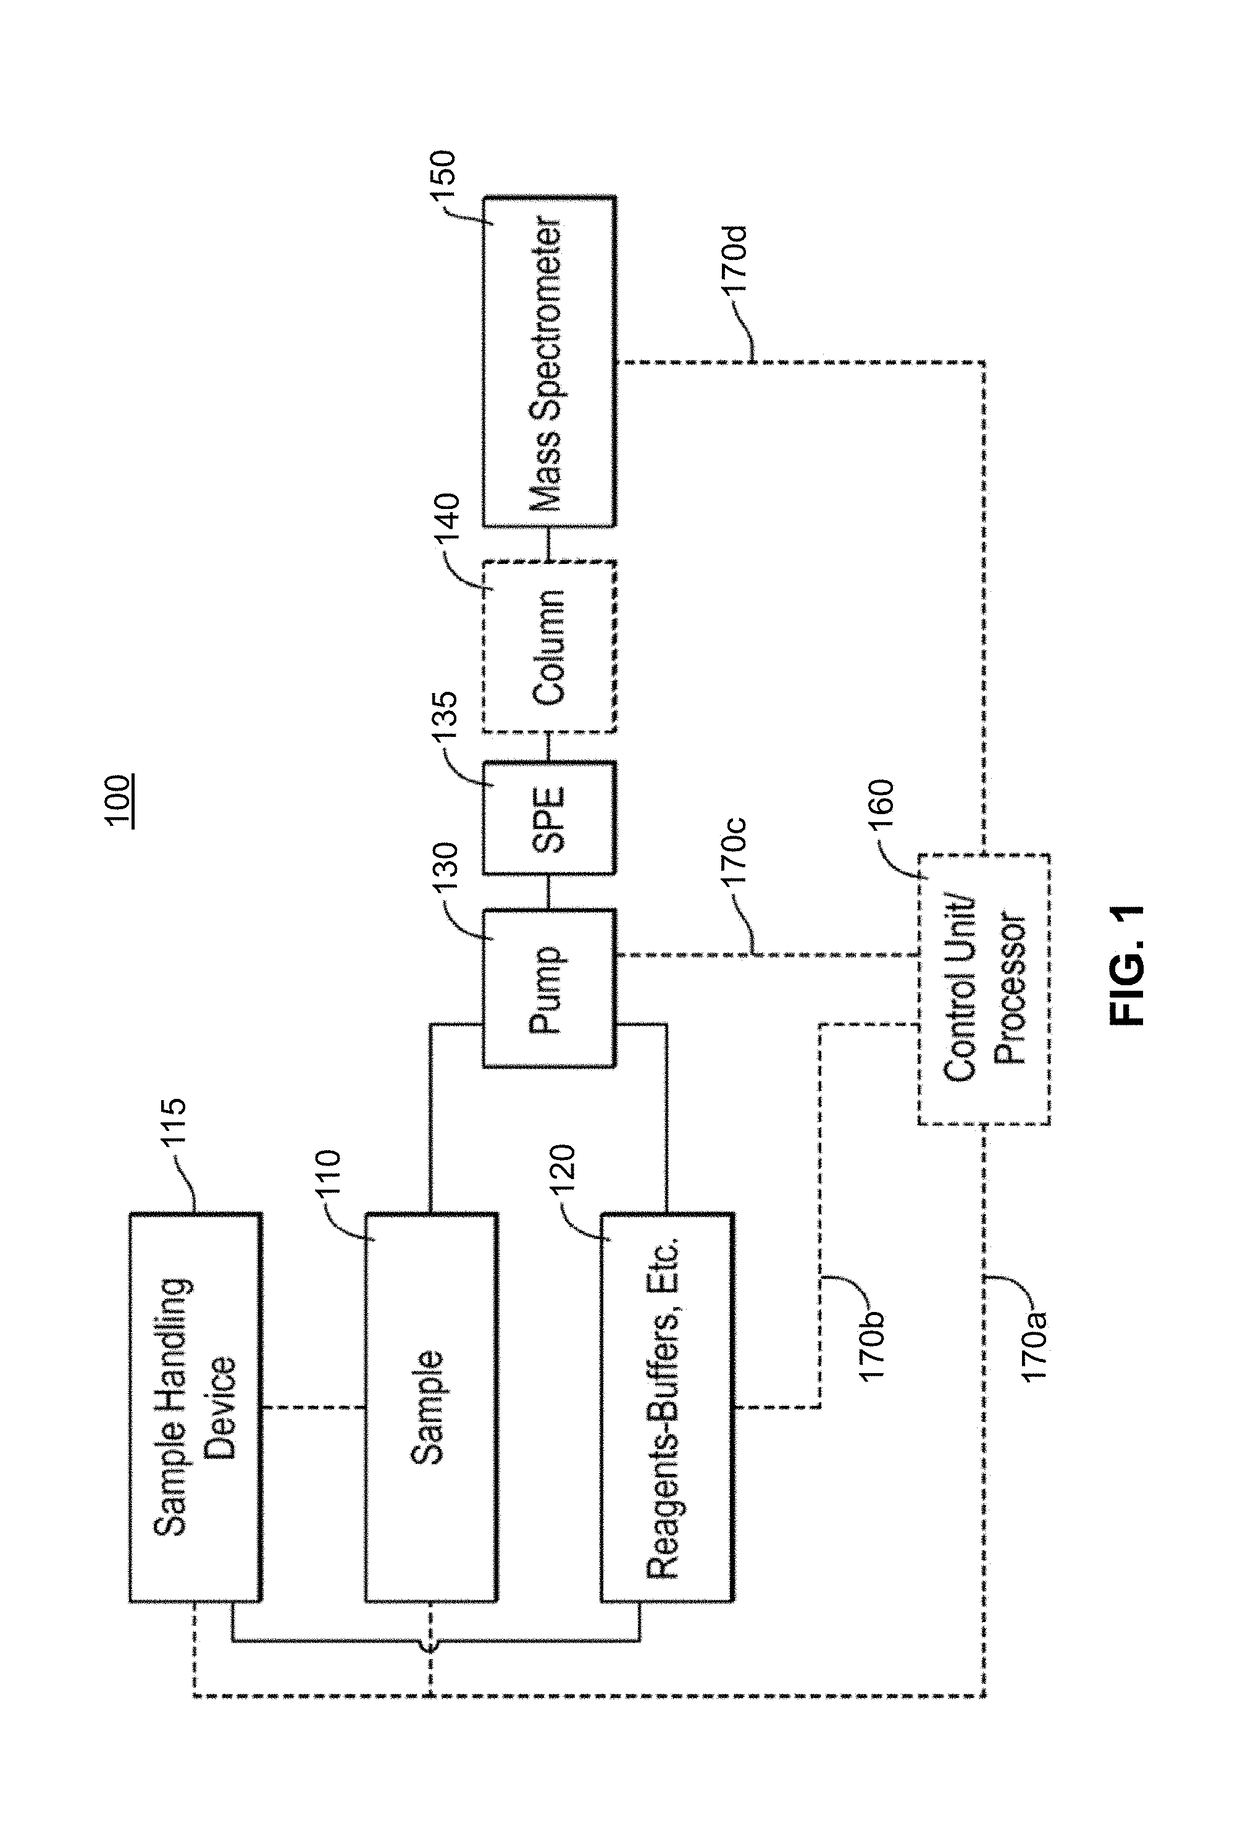
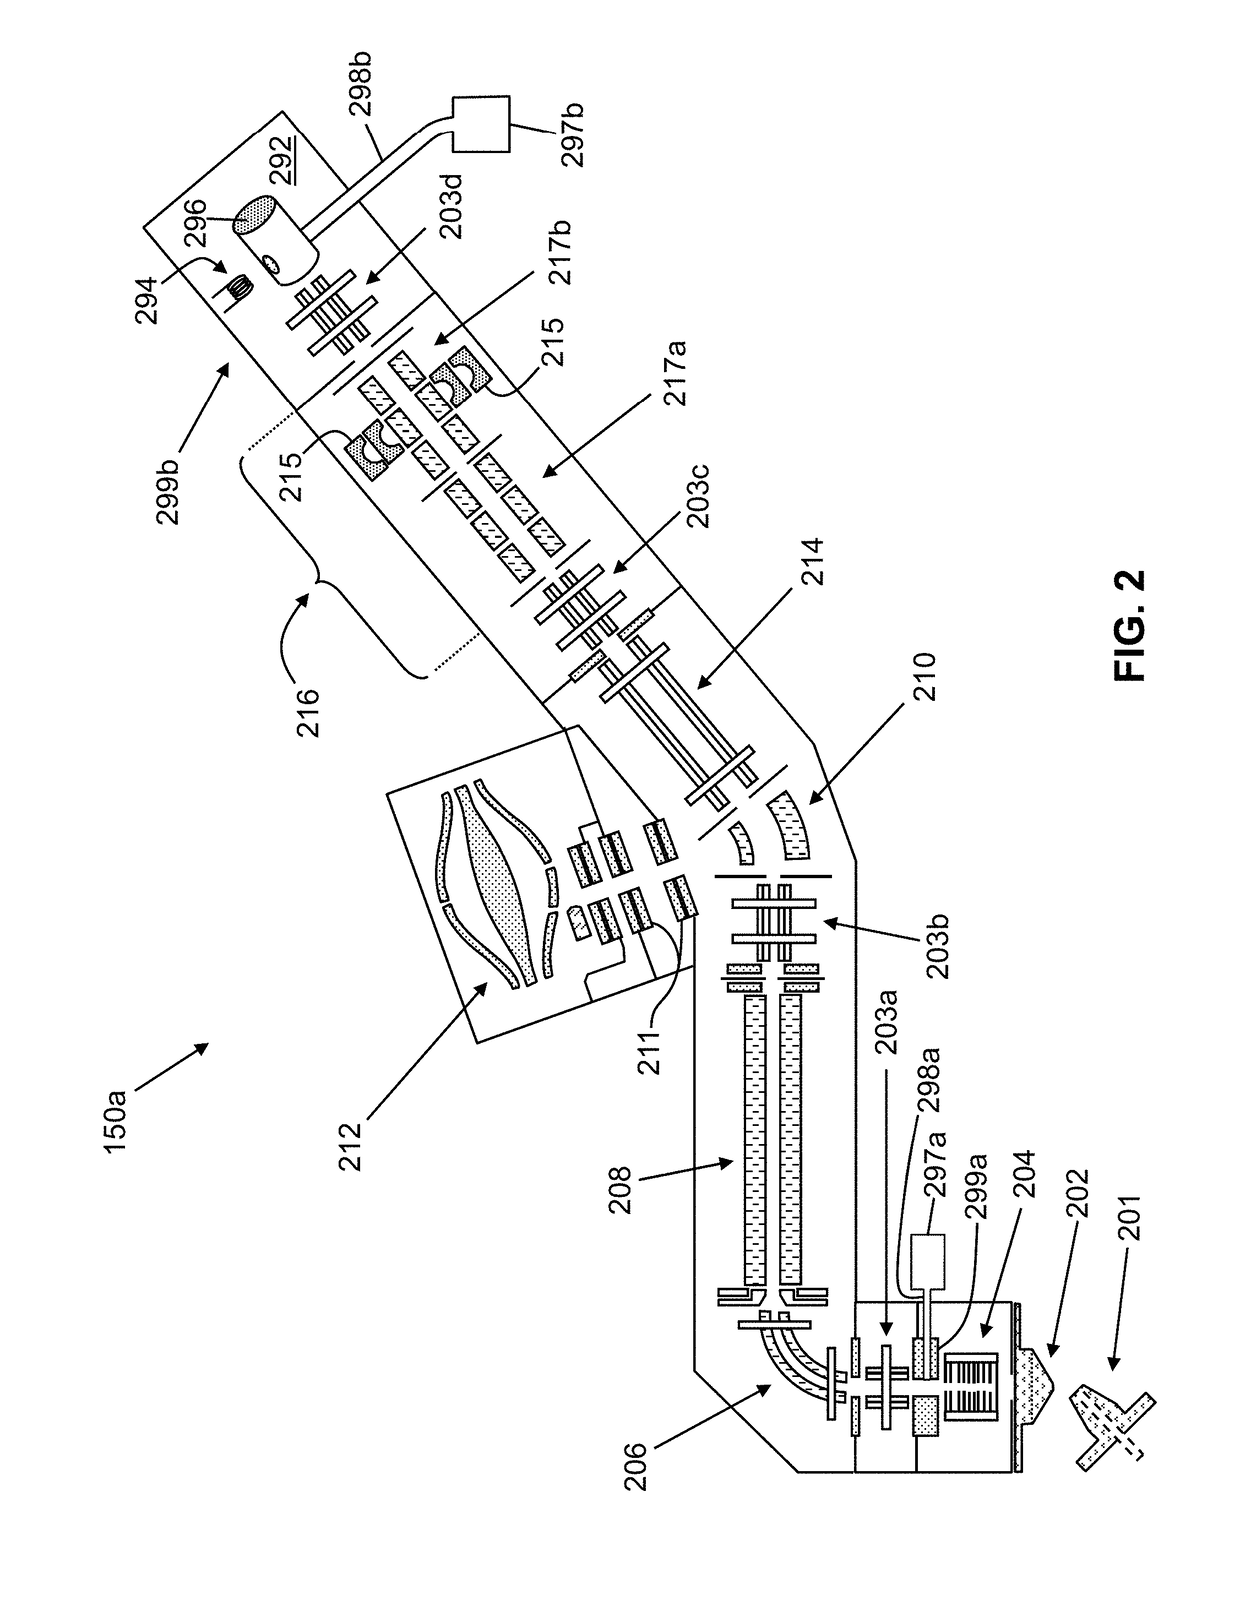
The patent discloses a method for simplifying the analysis of complex ion populations by using ion-ion reaction chemistry and an optimized spectral deconvolution procedure. The method allows for the automatic discrimination between mass spectral signatures of biopolymer molecules in a short time, making decisions in real-time regarding the course of subsequent mass spectral analysis steps of the same sample. The invention also provides a way to separate protein ions from other ions, resulting in a separated protein mixture with a high signal-to-noise ratio. Additionally, the invention describes a method for controlling the product-ion charge state distribution resulting from the ion-ion reaction.

Problems solved by technology

This is a time-consuming process because the sample needs to be analyzed at least twice and the MS / MS data is only recorded for a limited number of components.
Nonetheless, the basic issue demonstrated by FIG. 12B remains, especially for multicomponent samples of biopolymer analytes which may give rise to tens to hundreds of mass spectral peaks in a single mass spectrum.
Unfortunately, existing dynamic exclusion techniques may perform poorly for analyzing mass spectra of mixtures of complex biomolecules.
The amount of time consumed performing ten unnecessarily redundant MSn analyses may then lead to expiration of the exclusion time of the most abundant ion (or may lead to exhaustion of the time available to fully analyze a small number of most abundant ions), after which the entire sequence may of MSn analyses may be repeated.
A further complicating factor in the application of the dynamic exclusion principle to mass analysis of mixtures of complex biomolecules derives from the fact that the elution profiles of the various compounds are highly variable and difficult to predict.
Moreover, the time profiles of various ions generated from even a single such compound may fail to correlate with the elution profile of the un-ionized compound or with the profiles of one another as a result of ionization suppression within an ionization source of a mass spectrometer.
The peak widths span over an order of magnitude, therefore severely limiting the applicability of an exclusion list having a pre-defined exclusion time duration.
The main disadvantage to using centroids is imprecision of the m / z values.
Factors such as mass accuracy, resolution and peak picking efficiency all tend to compromise the quality of the centroid data.
A well-known disadvantage of using a Boolean value is the loss of information.
However, if one has an abundance of data points to work with—for example, thousands of centroids in a typical high resolution spectrum, the loss of intensity information is more than compensated for by the sheer number of Boolean variables.
Most existing approaches lack this logical framework, and their theoretical merits are therefore difficult to assess objectively.
In practice, one might not achieve exact convergence by this procedure.
Averagine fitting may be time consuming, a not insignificant consideration for real-time applications, such as those described herein in which decisions are automatically made, in real time, regarding which of several observed ions to fragment.
For a larger molecular weight protein whose signature appears in a crowded spectrum, the corresponding isotopic cluster tends to be noisy and incomplete (missing isotopes—especially the edges, missing charge states etc).
The use of an Averagine fit may not be appropriate in such instances.
This means that the mode is a very usable replacement for the average, which itself is more difficult to estimate for more noisy data.

Method used


Image

  • Methods for Top-Down Multiplexed Mass Spectral Analysis of Mixtures of Proteins or Polypeptides
  • Methods for Top-Down Multiplexed Mass Spectral Analysis of Mixtures of Proteins or Polypeptides
  • Methods for Top-Down Multiplexed Mass Spectral Analysis of Mixtures of Proteins or Polypeptides

Examples


example a

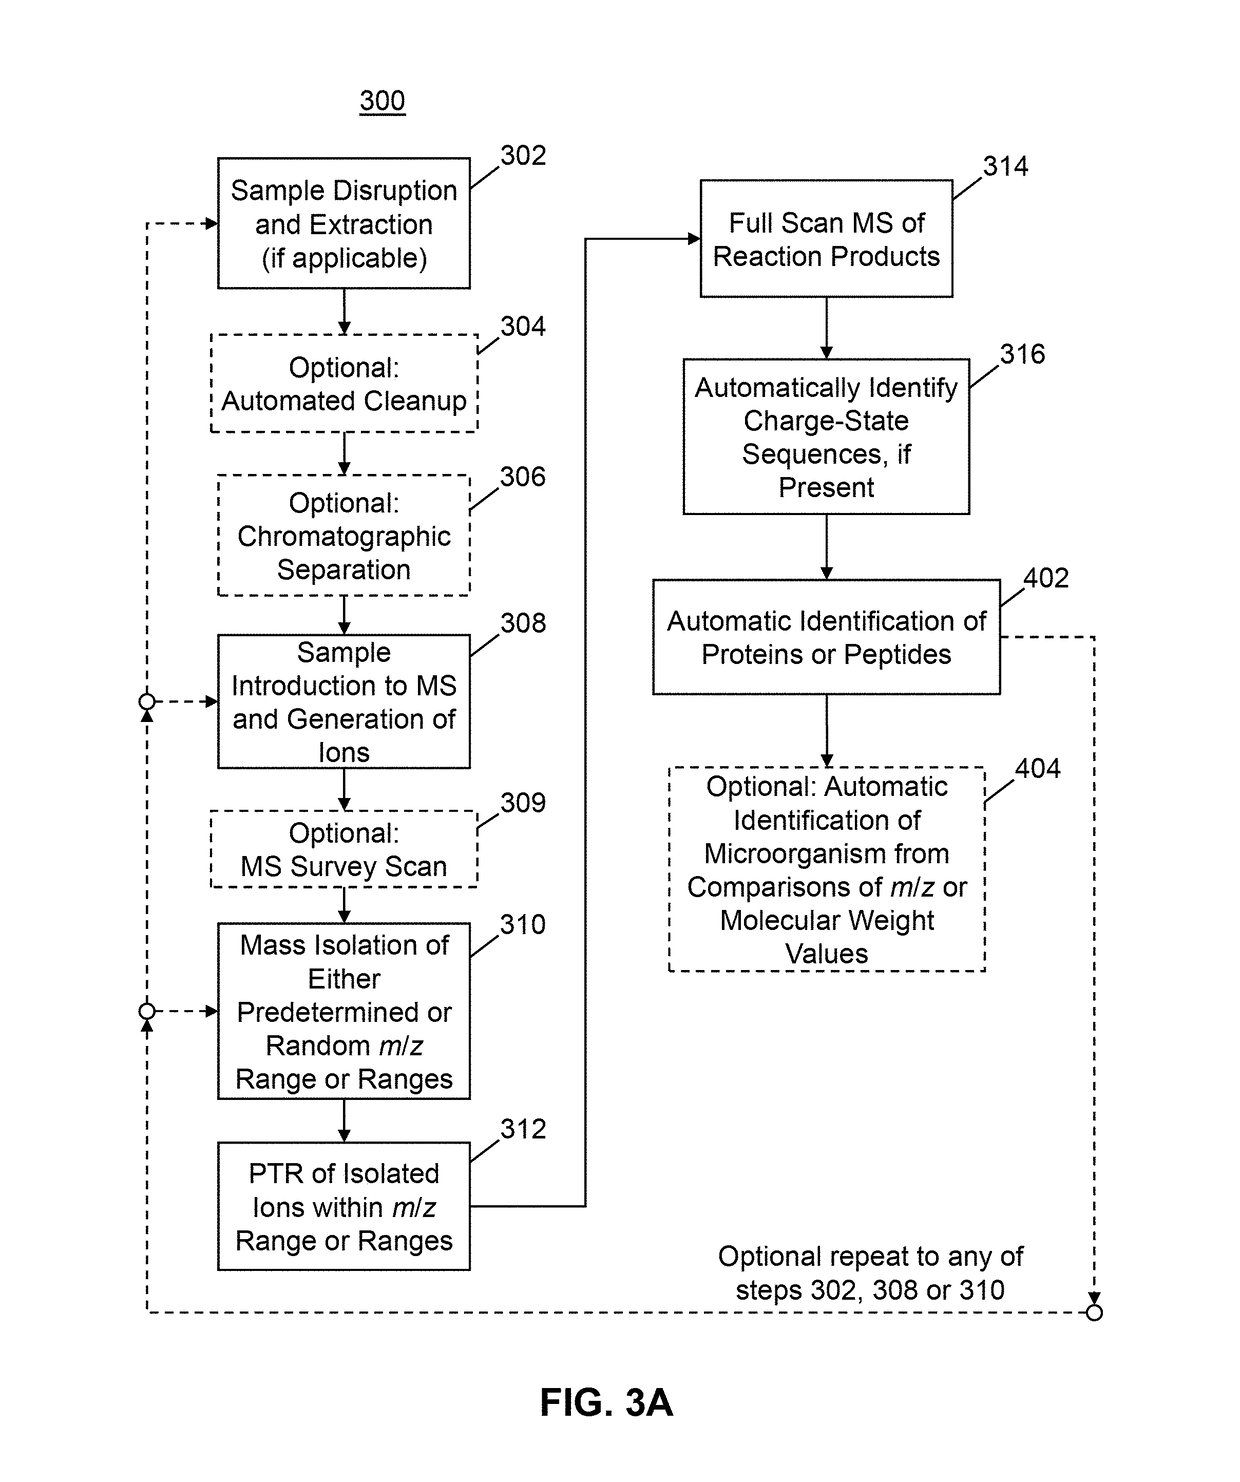
[0154]FIGS. 4A and 4B provide an example of mass spectroscopic signal enhancement provided by a single PTR reaction step (e.g., as in the method 300 shown in FIG. 3A). In a first application (FIGS. 4A, 4B), an extract from the pathogen E. coli was analyzed via direct infusion; the mass spectrum of the first-generation electrospray-generated ions is shown in FIG. 4A. As expected, there are many proteins present that overlap at various m / z values leading to the presence of a broad spectral region between approximately m / z=780 and m / z=1420 within which many ions are detected but with very little usable information in terms of discernible protein charge state distributions. Next, an m / z “window” of the first-generation ions of width 2 Th and centered at m / z=750 was isolated and the resulting isolated ion population was subjected to PTR reaction. The m / z position 412a shown in FIG. 4A indicates the center position of the isolation window.

[0155]FIG. 4B shows a mass spectrum of the PTR rea...

example b

[0156]FIGS. 5A and 5B illustrate an example of analysis of an E. Coli extract that is performed by a procedure that includes two stages of PTR reaction (for example, see steps 327, 328, 329 and 330 of method 380 in FIG. 3C). FIG. 5A illustrates a PTR product ion spectrum generated isolated first-generation precursor ions from within a 5 Th mass window centered at m / z=1200, indicated by position 711 in FIG. 5A. In this instance, the initial PTR spectrum does not include peaks that are sufficiently well resolved to enable identification of any proteins in the sample. Therefore, a subset of the first-generation PTR product ions were isolated for a second stage of PTR from within a 5 Th mass window centered at m / z=1320, indicated by position 712a in FIG. 5A and position 712b in FIG. 5B. The second-generation PTR product ions, which occur at m / z ratios greater than 1320 in FIG. 5B show clear charge-state distribution patterns that may be successfully used for identification of proteins i...

example c

[0158]As should be evident from the previous discussions, positive ion electrospray ionization of any protein or polypeptide molecule will produce a plurality of ions comprising different respective charge states (i.e., number of charges) as a result of different degrees of protonation of the original molecule. Charge states of +50 or more or possible and each charge state will be represented by multiple mass spectral lines representing different degrees of natural isotopic substitution. A further complication arises from the fact that for most natural biological samples, numerous different proteins of polypeptide molecules may be represented in a mass spectrum. A yet further complication arises from the fact that many other molecules—not necessarily of interest—may be present in a sample.

[0159]In many basic-research-oriented studies, the above-noted complicating factors of multiple analytes and multiple interfering species may be partially or wholly resolved by performing chromatic...


PUM


Abstract

Applications of ion-ion reaction chemistry are disclosed in which proton transfer reactions (PTR) and real-time data analysis methods are used to (1) simplify complex mixture analysis of samples introduced into a mass spectrometer, and (2) improve resolution and sensitivity for the analysis of large proteins in excess of 50 kDa by removing charge and reducing the collisional cross section.

Description

CROSS REFERENCE TO RELATED APPLICATIONS[0001]This application claims, under 35 U.S.C. §119(e), priority to and the benefit of the filing date of commonly-assigned U.S. Provisional Application No. 62 / 278,935, filed on Jan. 14, 2016 and titled “Methods for Top-Down Multiplexed Mass Spectral Analysis of Mixtures of Proteins or Polypeptides”, the disclosure of which is hereby incorporated by reference in its entirety. The subject matter of this application is also related to commonly-assigned and co-pending International Application No. PCT / US2015 / 040914, filed on Jul. 17, 2015 and titled “Methods for Mass Spectrometry of Mixtures of Proteins of Polypeptides Using Proton Transfer Reaction” and to commonly-assigned and co-pending U.S. application Ser. No. 15 / 067,727, filed on Mar. 11, 2016 and titled “Methods for Data-Dependent Mass Spectrometry of Mixed Biomolecular Analytes”, the disclosures of both of said applications hereby incorporated by reference herein in their entirety.TECHNICA...

Claims


Application Information

Patent Timeline
IPC IPC(8): G01N33/68
CPCG01N33/6848H01J49/0072H01J49/0036H01J49/0031
Inventor YIP, PING F.STEPHENSON, JR., JAMES L.SYKA, JOHN E. P.
Owner THERMO FINNIGAN
Learn More