
Method for detection and isolation of faulty sensors

a technology of faulty sensors and flow meters, applied in the direction of instruments, testing/monitoring control systems, process and machine control, etc., can solve the problems of sensor measurements being subjected to bias, drift, accuracy degradation, and even total sensor failure,

Pending Publication Date: 2018-03-29
GE OIL & GAS UK LTD
View PDF10 Cites 8 Cited by
  • Summary
  • Abstract
  • Description
  • Claims
  • Application Information

AI Technical Summary

Benefits of technology

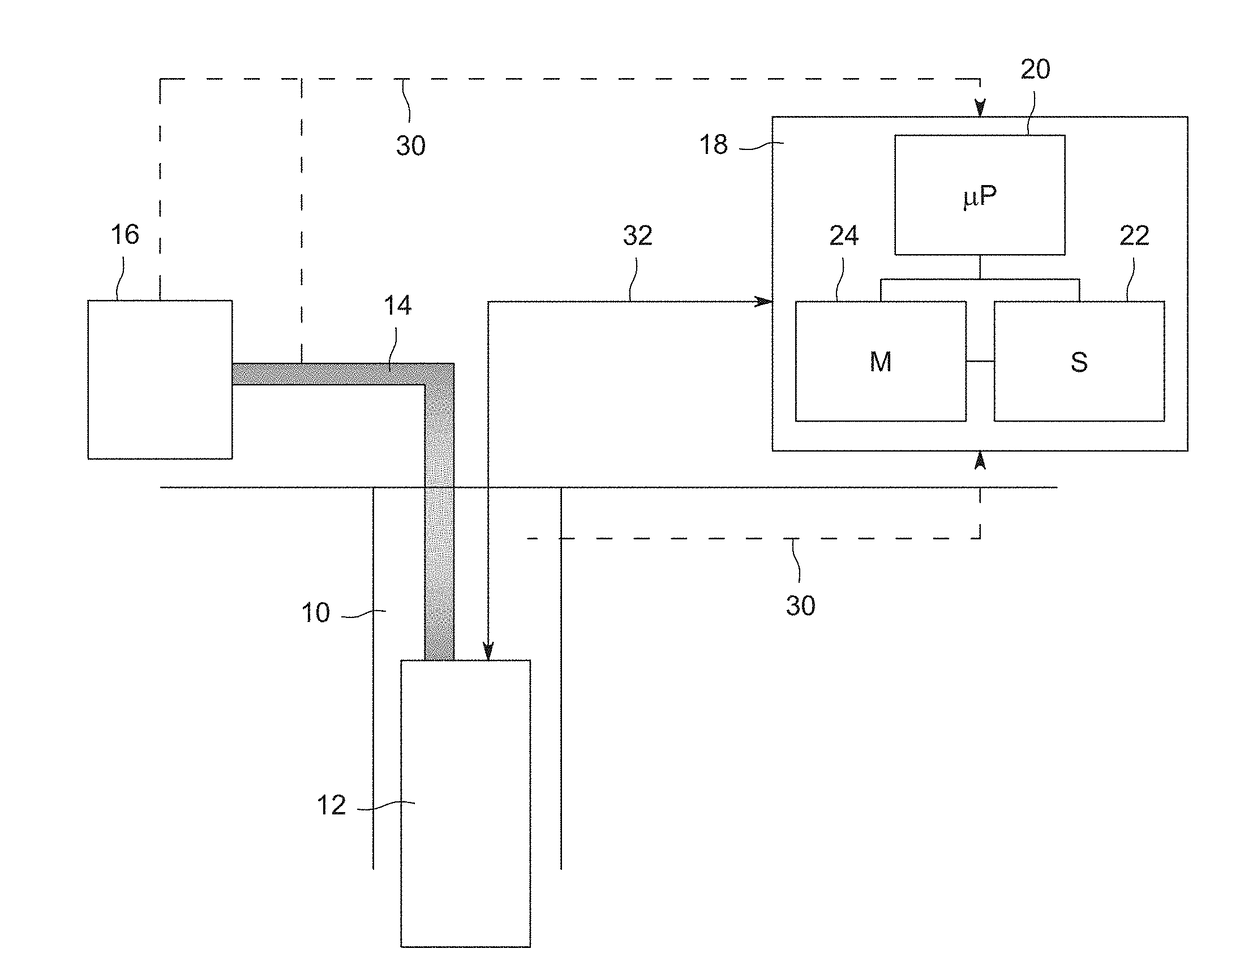
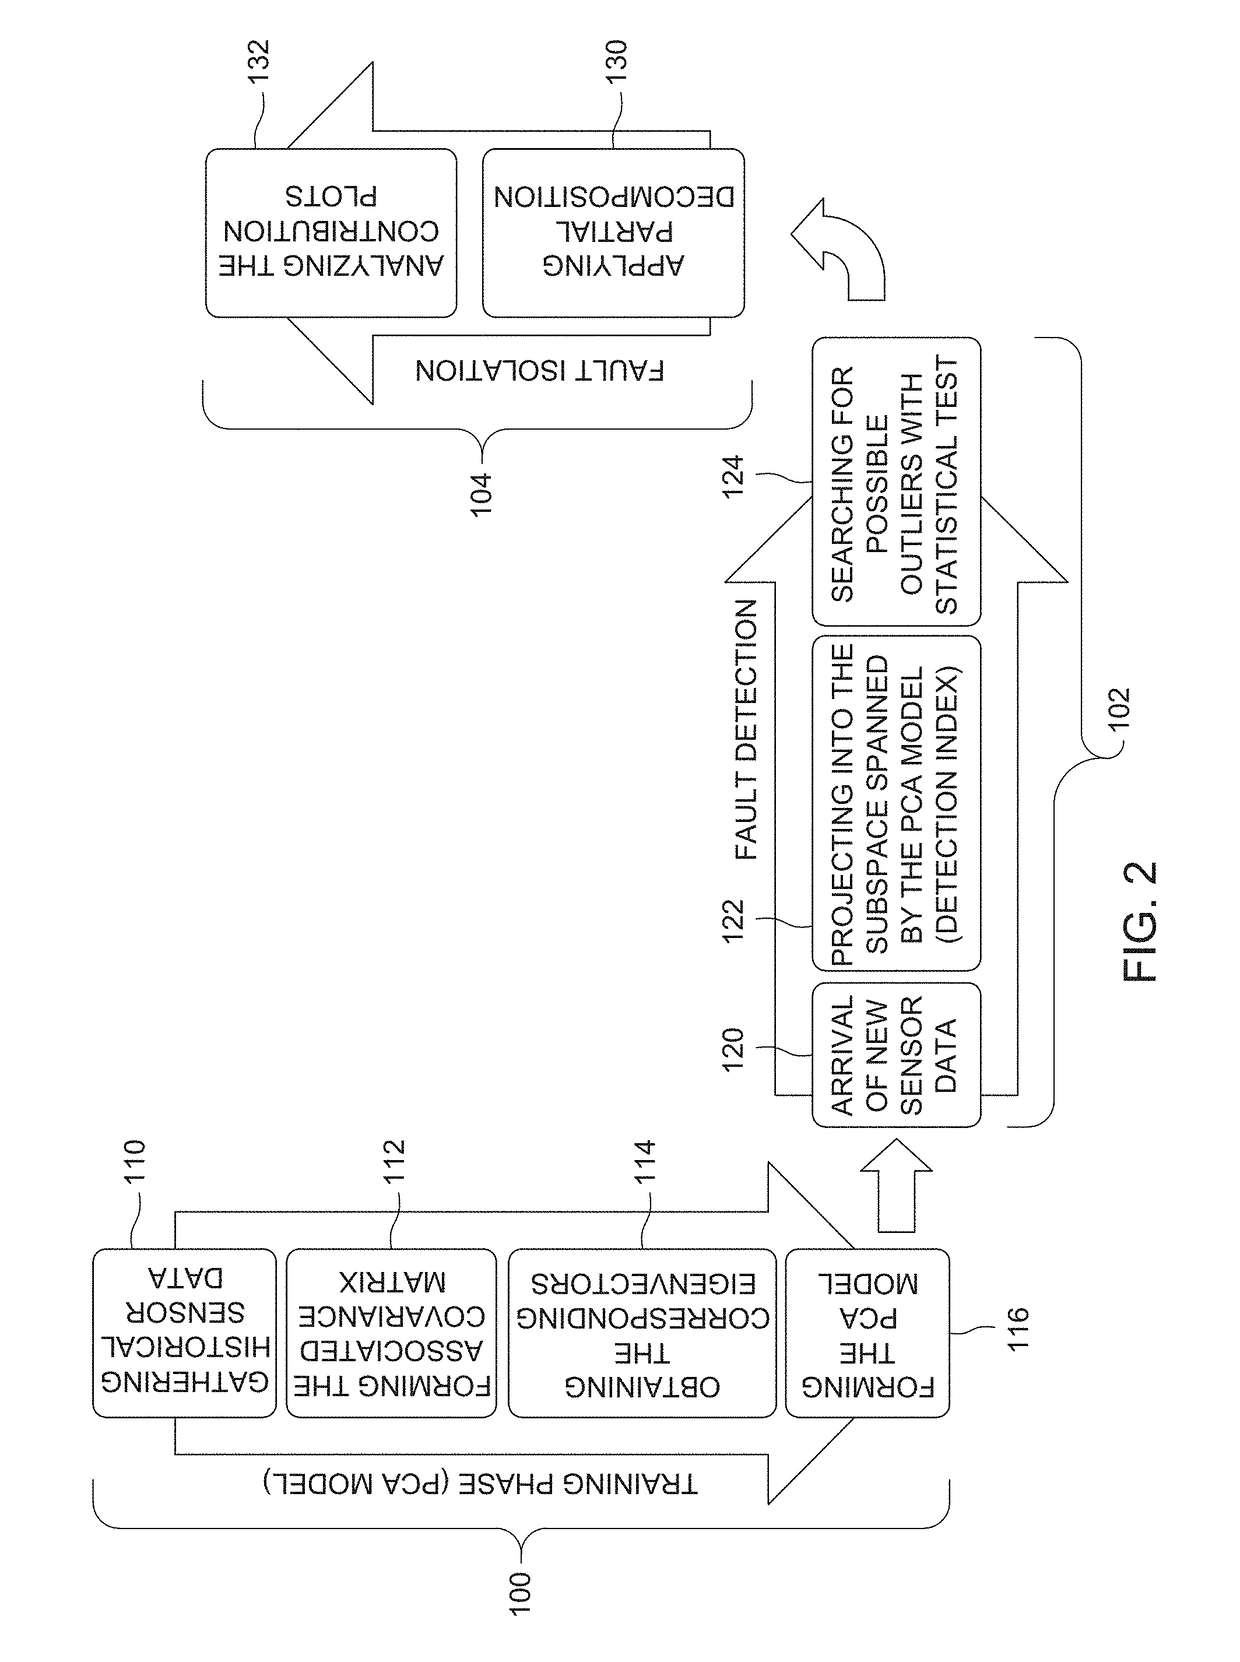
The invention relates to a virtual flow meter that can detect faults in a fluid production network. The method involves acquiring training data from sensors, performing a principal components analysis to create a model, and then measuring current data from the sensors. The data is then projected into the residual subspace to identify any outliers. If an outlier is detected, partial decomposition is applied to create contribution plots, which indicate which sensor is at fault. This approach allows for quicker identification of faults and reduces downtime in the network. The invention provides a useful tool for ensuring the accurate measurement of fluid flows in production networks.

Problems solved by technology

There may be various drawbacks associated with the use of physical flow meters, including cost (since expensive sensors are typically employed), reliability (since complex sensors are typically more susceptible to failure), communication and power supply issues (e.g., high power consumption to keep sensors working demands specific umbilical pipes), and precision and accuracy (generally, physical flow meters present measurement errors due to the complexity of a multiphase flow).
Both the physical and virtual flow metering approaches typically utilize complex data-fusion algorithms for estimating flow rates based on the measurements provided by the sensing units.
The maintenance of virtual flow meter accuracy over the life of a production site (e.g., an oil or gas field) is one challenge to the successful deployment of virtual flow meters at certain sites, such as subsea locations.
The use of virtual flow meters may be subject to errors attributable primarily to two sources: models and sensor measurements.
Model errors may be related either to mathematical modeling not adequately addressing the underlying physics or wrong (or varying) parameter assumptions (pipe roughness variation due to the incrustation of minerals, diameter variation due to the formation of wax, and so forth).
Sensor measurements can be subjected to bias, drifts, precision degradation, or even total sensor failure.
Such sensor failures or other sensor faults can compromise the quality in the results of a virtual flow metering approach.

Method used


Image

  • Method for detection and isolation of faulty sensors
  • Method for detection and isolation of faulty sensors
  • Method for detection and isolation of faulty sensors

Examples


Embodiment Construction

[0019]One or more specific embodiments of the present invention will be described below. In an effort to provide a concise description of these embodiments, all features of an actual implementation may not be described in the specification. It should be appreciated that in the development of any such actual implementation, as in any engineering or design project, numerous implementation-specific decisions are made to achieve the developers' specific goals, such as compliance with system-related and business-related constraints, which may vary from one implementation to another. Moreover, it should be appreciated that such a development effort might be complex and time consuming, but would nevertheless be a routine undertaking of design, fabrication, and manufacture for those of ordinary skill having the benefit of this disclosure.

[0020]When introducing elements of various embodiments of the present invention, the articles “a,”“an,”“the,” and “said” are intended to mean that there ar...


PUM


Abstract

Technical effects of the invention include use of a data-driven multivariate statistical method for the detection and isolation of sensor faults applied in a virtual flow metering context. In one implementation, the data-driven multivariate statistical method employs principal components analysis, weighted squared prediction error, and partial decomposition contribution plots.

Description

BACKGROUND[0001]The subject matter disclosed herein relates to the use of virtual flow metering in resource production contexts, such as oil and gas production.[0002]In various contexts where a fluid medium, either liquid or gas, is flowed between various locations, the control of the flow may be controlled at least in part using measured flow aspects. Various types of flow meters may be provided to provide data on the flow of the fluid at a given time and at a given location. By way of example, in a hydrocarbon production context, flow meters may measure flow at one or more locations in the production path to provide data on the flow of the production fluid through various parts of the production system.[0003]By way of example, two types of flow meter technologies are physical flow meters and virtual flow meters. In the context of physical multiphase flow meters, these flow meters typically estimate the flow rate of each phase in question by utilizing a combination of techniques, w...

Claims


Application Information

Patent Timeline
IPC IPC(8): G01F25/00G01F1/696G01F1/34
CPCG01F25/0007G01F1/34G01F1/696G01F25/00G01F1/68G05B23/024G01F1/74G01F25/10
Inventor GONZAGA, CARLOS ALBERTO CAVICHIOLIDE SOUZA, LUIZ FELIPE WILLCOXDOUAT, LUIZ RICARDONEMOTO, RAFAEL HORSCHUTZ
Owner GE OIL & GAS UK LTD
Learn More