[0012]The invention is advantageous in that an ultrasonic consumption meter is capable of measuring flow rate, e.g. as known in existing water or a heat meters, is also used to measure a noise level of the flow tube or the fluid therein, i.e. acoustic signals below 2 kHz, i.e. below the ultrasonic frequency range. One advantage of the invention is that the noise level is measured at the position of the consumer site. Even though the noise level may vary over time at each site, valuable information is still gained, especially if all or most consumption meters in a municipal distribution network deliver noise level data to the distributor. Hereby, a greater picture can be drawn up by the power of plurality, and anomalies in the distribution network, e.g. leaks in the piping system, can be more precisely uncovered. If in addition geographical data are available of the location of the individual consumption meters, the location of an anomaly can be estimated. The uncertainty of this location is likely to be reduced by the density of consumption meters and the accuracy of their respective positions.
[0013]Furthermore, distribution networks with so-called automatic meter reading (AMR) systems are common, in which consumption data are relayed from the consumption meters at the consumer site to the distributor with regular time intervals, spanning from hourly to yearly. Typically, data are transmitted between 1 and 24 times every day. The communication typically takes place via a wireless network, which is operated by either the distributor or a subcontractor, and hence is dedicated to the task. The capacity of such a communication network suffices to carry additional information besides the consumption data. Thus, such additional information could be data representing the noise level in the fluid distribution pipes from each consumption meter. Hereby, the distributor can store and / or process such noise level data in a dedicated processing system, e.g. for monitoring leaks or other anomalies in the piping system. The sensitivity of such monitoring system may be improved even more by combining noise level data with other data that from each consumer site, such as flow rate, pressure, and temperature. Such data may especially be useful when combined in a hydraulic model for the entire distribution network pipe system.
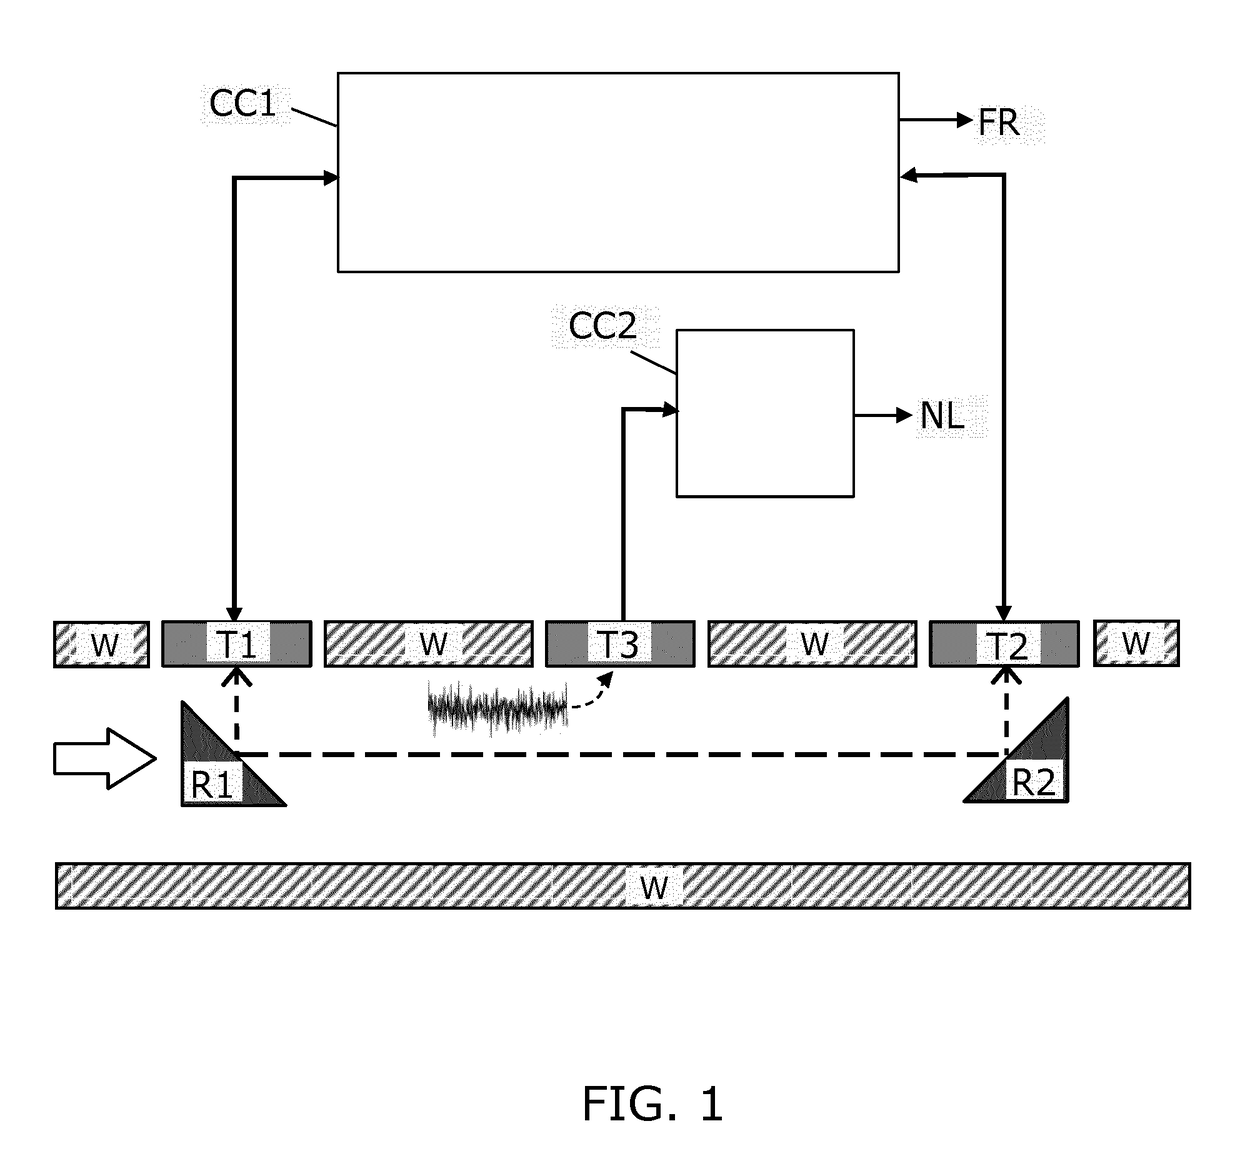
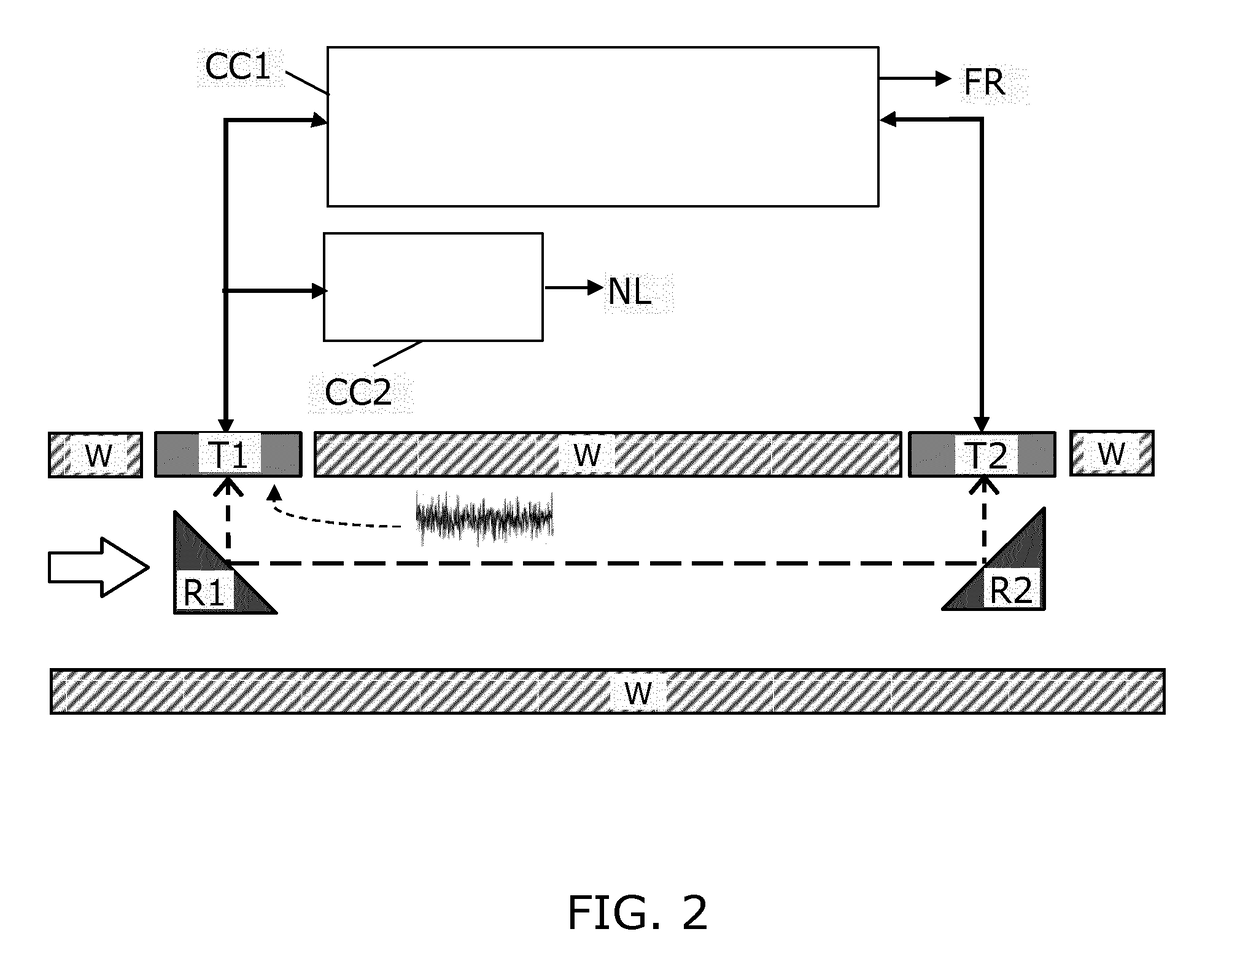
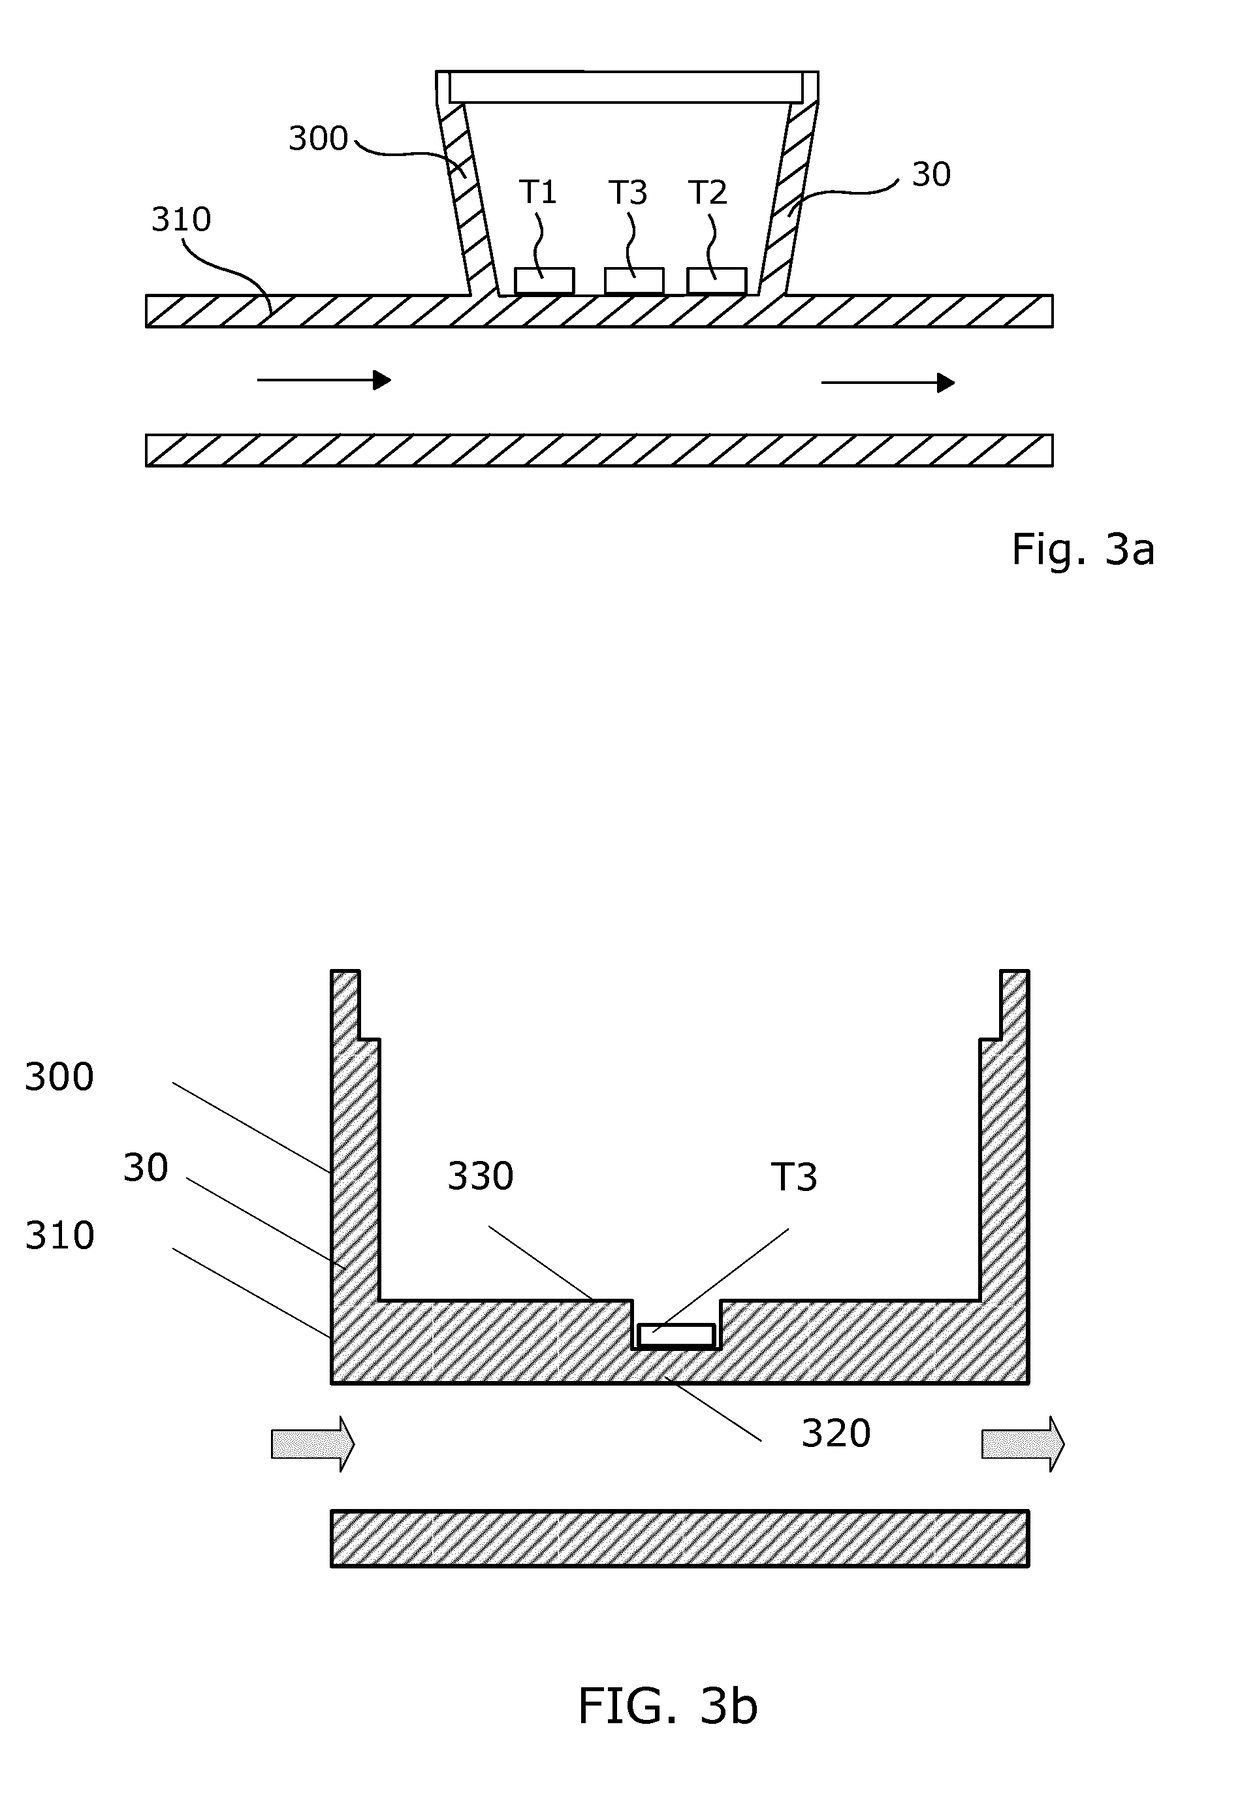
[0014]Studies have shown that acoustic noise due to leaks in pipes is dominant in the frequency range below 2 kHz, depending on the leak size, pipe material, flow rate and operating pressure. Ultrasonic flow meters are typically operated in the MHz range, thus the relevant noise level frequency range is significantly different from the frequencies used in flow rate measurements. The acoustic signals can be measured in a variety of different ways with different sensors, spanning from a simple moving coil microphone via capacitive sensors to piezoelectric sensors. Since a consumption meter based on ultrasonic measurement of flow already comprises ultrasonic transducers, such as piezoelectric transducers, in one embodiment, the same transducer(s) involved in flow rate measurements is used as sensor to detect acoustic signals relating to the noise level in the flow tube or the fluid therein. It is to be understood, however, that according to the invention the consumption meter may also comprise a dedicated noise level sensor for detection of acoustic signals, such as a third ultrasonic transducer, or a dedicated sensor based on another sensor technology.
[0015]Modern consumption meters employ one or more microcontrollers to perform the flow measurement and to calculate data representing a consumption amount. Thus, it is to be understood that the flow measurement sub-circuit and the noise measurement sub-circuit may be implemented in a single processor, or in separate processors. The computing power of a modern microcontroller is adequate to perform the data analysis of the signal recorded by the noise level sensor, e.g. to perform a statistical analysis of noise levels sensed over a period of time, thus reducing the amount of data to be transmitted rather than transmitting large numbers of unprocessed data.
[0016]Data processing of the output from the sensor may specifically be a simple root-mean-square (RMS) calculation to provide a value representing a measure of the overall noise level. E.g. in a selected frequency band, such as 10-500 Hz. Analysis that is more sophisticated may be frequency filtering into certain frequency bands, followed by an RMS calculation, to provide a range of noise figures associated with different frequency bands. Finally, a full Fast Fourier Transform (FFT) could be performed to provide the full spectrum of acoustic signals, involving noise power density as well the associated phase information. The latter level of analysis may be desirable, in order to perform a cross correlation calculation with the purpose of triangulating the location of the noise source. However, for many practical purposes the information coming from the simpler noise figure calculation suffice to indicate the position of the noise source.
[0017]The data processing on-board the consumption meter may comprise detecting if a measure of average or peak noise level exceeds a predetermined threshold value. In such case, the consumption meter may be arranged to transmit a special warning signal of the like. This may facilitate processing at the distributor side, since leakages or other anomalies can be easily monitored by observing such warnings.

