GNSS receiver protection levels

Active Publication Date: 2019-11-07
U-BLOX
View PDF0 Cites 18 Cited by
  • Summary
  • Abstract
  • Description
  • Claims
  • Application Information

AI Technical Summary

Benefits of technology

The present invention provides a method for determining the posterior error probability distribution of a parameter measured by a Global Navigation Satellite System (GNSS) receiver using a multivariate probability distribution model. The model takes into account measurement quality indicators associated with the GNSS measurement, such as carrier-to-noise density, carrier-to-noise density variability, carrier phase variance, and others. The method can be used in navigation systems, autonomous driving systems, and advanced driver assistance systems. The invention also provides a module for a navigation system and a vehicle comprising the autonomous driving system or advanced driver assistance system. The technical effect of the invention is to improve the accuracy and reliability of GNSS navigation and positioning in various applications.

Problems solved by technology

One source of error in GNSS measurements arises from GNSS signal distortion.
Signal distortion may be caused by, for example, the following processes occurring individually or in combination: obstructions between the satellite and the GNSS receiver, which may e.g. cause a temporary loss of lock in a carrier phase measurement; reflections, which may increase the time it takes for a signal to reach the receiver; or multipath propagation, in which interference is produced as a result of signals reaching the receiver by two or more paths.
Such signal distortion errors may depend strongly on the environment surrounding the GNSS receiver and can be particularly pronounced in built-up areas.
Signal distortion is therefore a significant source of error for GNSS receivers which are used in urban environments, e.g. GNSS receivers belonging to advanced driver assistance systems (ADASs).
However, because the error in each reported position varies randomly, there remains a small risk that any particular position reported by the navigation system differs from the true position of the user by a distance which exceeds the alert limit.
For example, if the navigation system reports positions at a rate of 10 Hz, and for each position there is a 10−5 chance that the error (but not the protection level) exceeds the alert limit, the risk of an integrity breach is 10−4 per second.
However, as these approaches are typically concerned with addressing errors associated with the GNSS satellites, they may fail to adequately account for the effects of signal distortion or errors associated with the GNSS receiver.
In particular, by assuming that only a single satellite is producing an erroneous measurement at a given time, many known approaches are ill-suited to situations in which signal distortion causes errors in multiple satellite signals simultaneously.
As a consequence of these kinds of problems, the known approaches for calculating integrity risk may be less reliable when used for road vehicles.

Method used


Image

  • GNSS receiver protection levels
  • GNSS receiver protection levels
  • GNSS receiver protection levels

Examples


Embodiment Construction

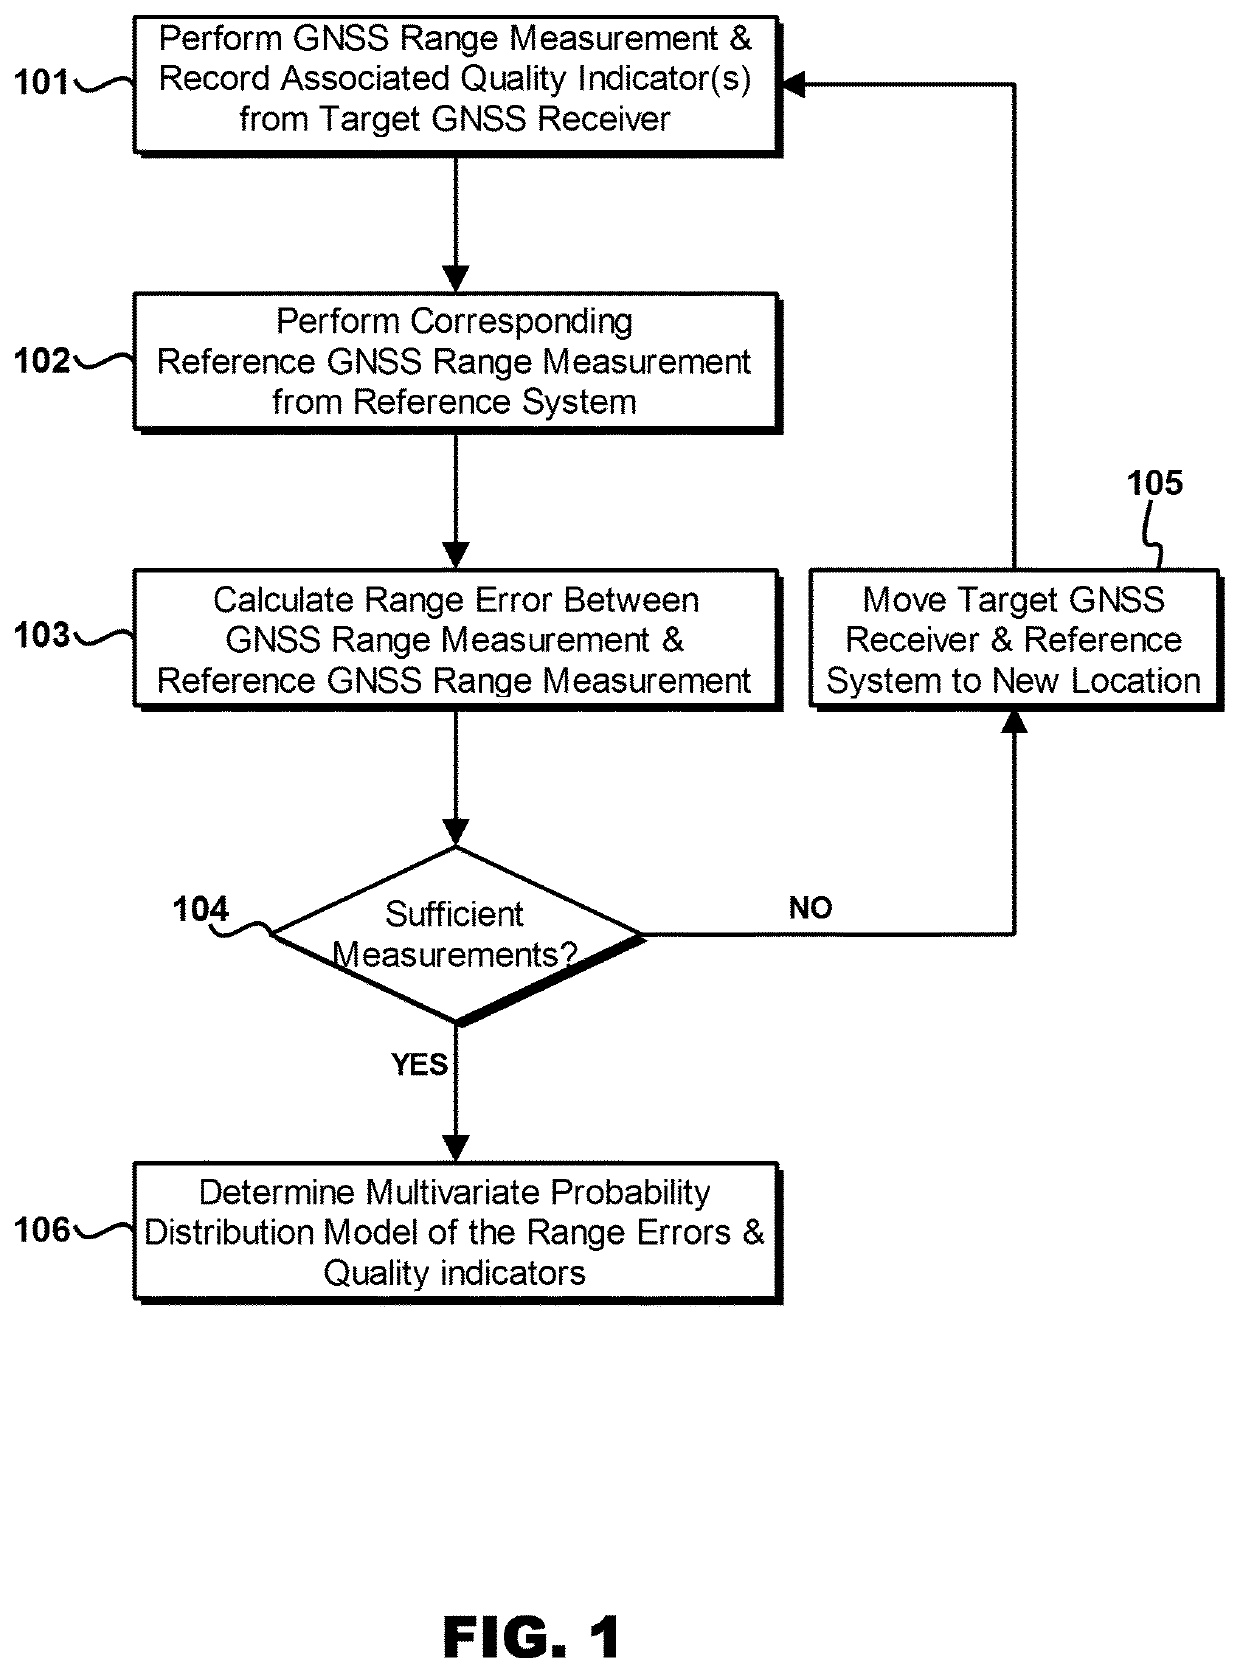
[0044]FIG. 1 is a flow chart illustrating the steps of a measurement campaign to determine a multivariate probability distribution model between the measurement error of a GNSS receiver and one or more indicators of GNSS measurement quality.

[0045]A GNSS receiver is typically able to make measurements including pseudorange and carrier-phase measurements, based on the signals it receives from the satellites in the GNSS. In addition to these measurements, the GNSS receiver may additionally provide measurement quality indicators, which may include signal parameters and / or performance indicators. Examples of signal parameters include carrier-to-noise ratio or density (C / N0), carrier-to-noise ratio variability, an estimate of the carrier phase and pseudorange variances as well as multipath deviation. Examples of performance indicators include loss-of-lock (cycle slip) detectors and counters for code lock time and phase lock time. The accuracy of GNSS measurements made by a GNSS receiver m...


PUM


Abstract

A method of determining a posterior error probability distribution for a parameter measured by a Global Navigation Satellite System (GNSS) receiver. The method comprises receiving a value for each of one or more GNSS measurement quality indicators associated with the GNSS measurement of the parameter. The or each received measurement quality indicator value is provided as an input into a multivariate probability distribution model to determine the posterior error probability distribution for the GNSS measurement, wherein the variates of the multivariate probability distribution model comprise error for said parameter, and the or each measurement quality indicator.

Description

TECHNICAL FIELD[0001]The present invention relates to a method for obtaining the posterior error probability distribution for a measurement made by a Global Navigation Satellite System (GNSS) receiver and a method for obtaining a multivariate probability distribution model mapping measurement error of a GNSS receiver to one or more indicators of GNSS measurement quality. The invention also relates to a navigation system or a module thereof, the system or module being for estimating the posterior error probability distribution in a GNSS measurement.BACKGROUND[0002]Global Navigation Satellite System (GNSS) receivers enable the accurate determination of user position by performing ranging measurements on radio frequency (RF) signals transmitted by at least four GNSS satellites. The distance to each satellite is determined by first measuring the time it takes for the RF signal to travel from the satellite to the receiver and then this travel time is converted into a corresponding “line-...

Claims


Application Information

Patent Timeline
IPC IPC(8): G01S19/26
CPCG01S19/26G01S19/20G01S19/14G01S19/39G01S19/08G01S19/44G01S19/22
Inventor TURUNEN, SEPPO
Owner U-BLOX
Why Eureka
Try Eureka