Devices for monitoring food freshness and methods of using same
a technology for food freshness and food products, applied in the field of food freshness monitoring devices, can solve the problems of food products, especially those containing substantial amounts of proteins, sugars and/or fats, spoiling over time, etc., and achieve the effect of detecting spoilage of food products
- Summary
- Abstract
- Description
- Claims
- Application Information
AI Technical Summary
Benefits of technology
Problems solved by technology
Method used
Image
Examples
example 1
Correlation Between Milk Storage Temperature and pH
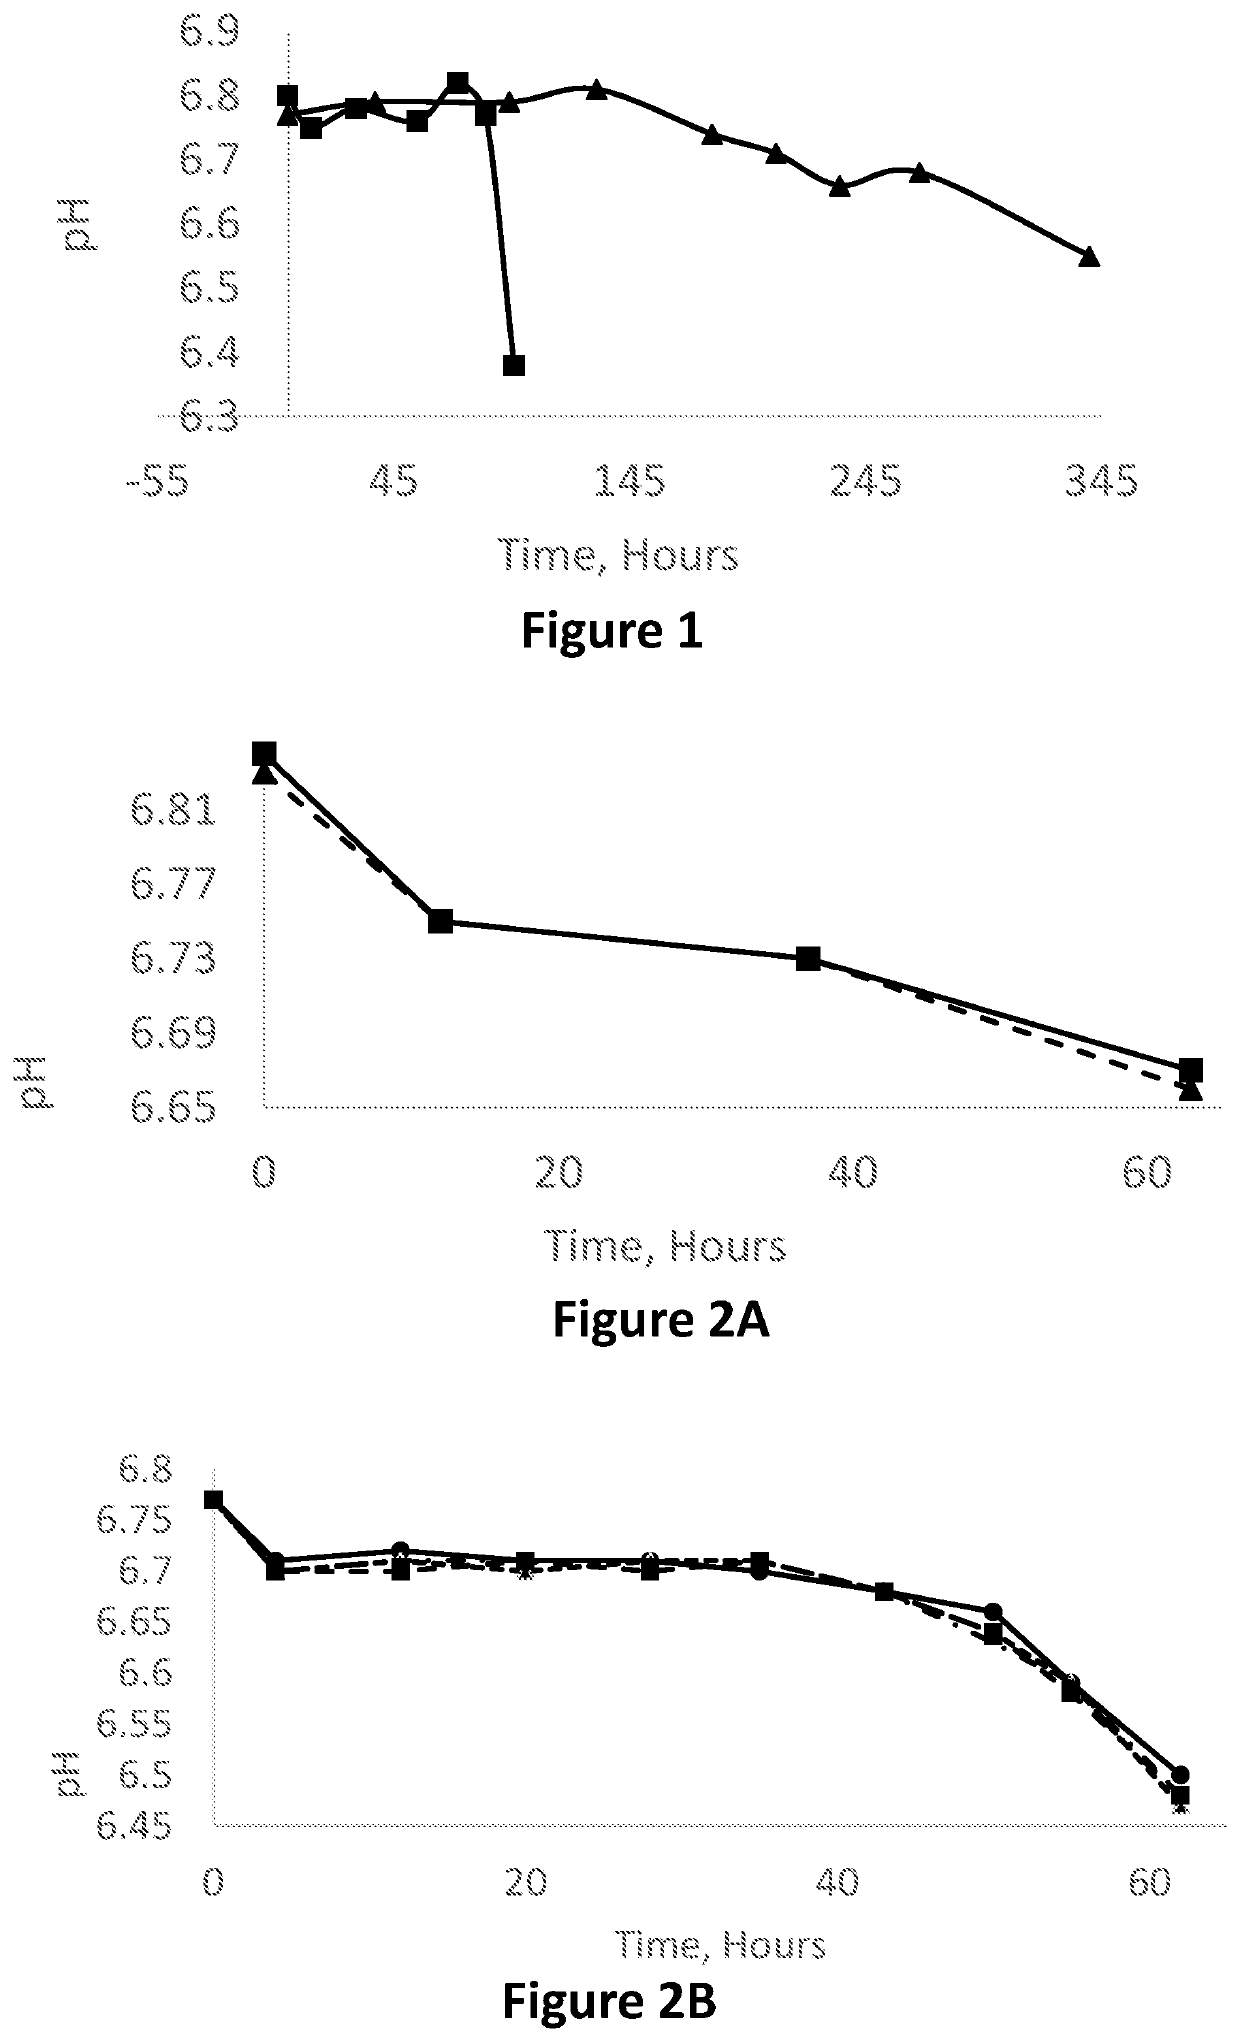
[0271]The pH values of milk samples were monitored for up to 345 hours, for a milk sample stored at 4° C. and for a milk sample stored at 18° C. FIG. 1 shows the pH over time of the milk sample stored 4° C. (triangles) and the milk sample stored 18° C. (squares). As freshness decreases over time, the pH values respectively decrease. It can be seen that the pH measurements of the milk sample stored at 18° C. sharply decreased after 95 h, indicating a rapid spoilage, while the milk sample stored at 4° C. remained fresh for a longer period, and the spoilage was slower.
example 2a
Correlation Between the Rate of Spoilage of Small and Large Milk Samples
[0272]The pH values of small (2-5 ml) and large (50-100 ml) milk samples were monitored for up to 60 hours, while being stored at room temperature, in order to compare their rates of spoilage. FIG. 2A shows the pH over time of the small milk samples (triangles) and the large milk samples (squares). As freshness decreased over time, the trend of decreasing pH values was witnessed in both large and small milk samples. More importantly, it was witnessed that both large and small milk samples are losing freshness and becoming spoiled at substantially the same rate. The results thus indicate that the rate of spoilage of a small food sample (such as the food sample in the at least one chamber) and a large food sample (e.g. the food product in the device from which the food sample has been derived) are similar.
example 2b
Correlation Between the Rate of Spoilage of Small and Large Samples Containing Milk and Indigo Carmine
[0273]In order to determine whether an external indicator indigo carmine has an influence over the measured pH the pH values of small (0.5 ml), medium (1.5 ml) and large (50 ml) milk samples were monitored. The samples were prepared by combining 500 ml row milk and 6 gr of 0.02% indigo carmine aqueous solution at 4° C. After 1 h in 4° C. the mixture was divided into four 50 ml samples, two sets of three 1.5 ml samples and fifteen 0.5 ml samples. All the samples were measured to have pH=6.77. The pH values of the samples were monitored for up to 60 hours, while being stored at 18-20° C., in order to compare their rates of spoilage. FIG. 2B shows the pH over time of the 0.5 ml milk samples (dashed line, squares), 1.5 ml milk samples set A (dashed line, triangles), 1.5 ml milk samples set B (dashed line, no marker) and 50 ml milk samples (solid line, circles). As freshness decreased ov...
PUM
| Property | Measurement | Unit |
|---|---|---|
| size distribution | aaaaa | aaaaa |
| size | aaaaa | aaaaa |
| average size distribution | aaaaa | aaaaa |
Abstract
Description
Claims
Application Information
 - R&D
- Intellectual Property
- Life Sciences
- Materials
- Tech Scout
- Unparalleled Data Quality
- Higher Quality Content
- 60% Fewer Hallucinations
Browse by: Latest US Patents, China's latest patents, Technical Efficacy Thesaurus, Application Domain, Technology Topic, Popular Technical Reports.
© 2025 PatSnap. All rights reserved.Legal|Privacy policy|Modern Slavery Act Transparency Statement|Sitemap|About US| Contact US: help@patsnap.com


