Systems and methods for testing and analysis of visual acuity and its changes

a visual acuity and system technology, applied in the field of systems and methods for testing and analysis of visual acuity and its changes, can solve the problems of difficult comparison and coordination of visual acuity testing obtained with different charts, unfeasible clinical testing by eye care specialists or general practitioners, and difficulty in chart design and testing standards. achieve the effect of increasing test resolution

Active Publication Date: 2020-04-16
ADAPTIVE SENSORY TECH INC
View PDF0 Cites 2 Cited by
  • Summary
  • Abstract
  • Description
  • Claims
  • Application Information

AI Technical Summary

Benefits of technology

[0003]Two approaches to visual acuity testing have come to dominate the current art: chart tests in which patients identify multiple lines of optotypes presented at one time, or computerized testing in which optotypes are presented one at a time. The computerized test has gained recent favor, because it provides the potential advantage of increased test resolution, via the flexible and precise sampling of optotype size on digital displays, and the application of adaptive and personalized test strategies that focus testing to the specific vision of the patient.
[0007]In some embodiments, disclosed herein is a scoring algorithm (interchangeable as algorithm S herein) that enables the analysis of visual acuity data collected optionally on different acuity chart designs. In some cases, disclosed herein is an adaptive algorithm (interchangeable as algorithm A) that improves the quality of visual acuity data by generating or selecting personalized chart designs that focus precisely on the acuity of the test subject. In some cases, disclosed herein is a combination algorithm, which combines algorithms A and S in a re-iterative fashion: the evaluation of previously collected acuity data (from the subject or from a population) is used to personalize chart designs for the collection of acuity chart data using algorithm A. In turn, that data can be scored using algorithm S, which provides an updated estimate of the patient's visual acuity. This re-iterative process can provide estimates of visual acuity with high precision and reduced testing times. In some embodiments, disclosed herein is an acuity model for analyzing visual acuity, which predicts visual performance during testing with different acuity chart designs. In some cases, such acuity models provide the foundation for algorithms S and A. In some embodiments, the acuity models disclosed herein provide a powerful description of acuity chart performance, which generalizes to predict visual performance across different acuity charts, using model parameters specific to the subject, and / or model parameters specific to each chart design. These model parameters specific to the subject (interchangeably herein as chart-invariant parameters) can provide the valuable acuity parameters that can be used to track visual health over time.
[0008]For instances, in the acuity models disclosed herein, the distinction of chart-specific and chart-invariant metrics (interchangeable as parameters) provides flexibility and versatility to the estimates of visual acuity. Such two sets of acuity metrics can be important and complementary. The set of chart-specific metrics may describe visual acuity within the context of the specific acuity chart used during testing. An alternative set of chart-invariant metrics can describe visual acuity independently of the design features of acuity charts. These comprehensive parameters therefore may have the flexibility to deliver acuity metrics that are specific to, or independent of, the acuity chart used for testing. The chart-specific metrics can be important for research and development applications that use the same chart over time. The chart-invariant metric approach is important to evaluate and compare data across different clinical practices and populations. As shown in FIG. 3A, a flow chart of an exemplary embodiment of generating the chart-invariant acuity model may include an operation 230 using chart-invariant acuity parameters, which then may be transformed into chart-specific acuity parameters 330, depending on the design factors of the acuity chart.
[0009]The acuity models disclosed herein can also provide a foundation for novel presentations of visual acuity data. The visualization tools may help patients and clinicians to understand the changes in acuity that are being measured.
[0011]Unlike traditional adaptive acuity testing methods that optimize optotype selection for only one letter at one size, the system and method disclose herein can advantageously enable composite optimization of acuity charts that concurrently estimate chart-specific and chart-invariant acuity metrics. Additional advantages associated with the methods and systems disclosed herein includes but are not limited to: a precise personalized focus on each individual subject while adhering to chart design standards, rapid testing times, comparable precision to time-consuming single-letter acuity tests, and visual acuity metrics that described the subject's vision independently of optotype sizes, test charts, or testing procedures. Both sets of acuity parameters, whether chart-specific or chart-invariant are interchangeable and inter-translatable, given knowledge of acuity chart design.
[0012]In some embodiments, the systems and methods disclosed herein includes a chart-based adaptive acuity test, which provides the advantages of standardization provided by chart-based testing, with the advantages of flexibility and precision provided by single-letter testing. The systems and methods disclosed herein can apply Bayesian adaptive algorithms to personalize and precisely focus acuity charts to optimally test the vision of each subject, while adhering to design constraints or recommendations from ruling committees, or more generally, while maintaining any desired design constraints at all. In some embodiments, the development of design-constrained optimization methods for visual acuity testing optionally using Bayesian adaptive algorithms and a signal detection framework provides one or more of: the adherence to chart design standards; precise personalization by adaptive testing that focuses on the individual; the short testing time of charts; the precision of longer single-letter acuity tests; correction for guessing behavior with different optotype sets; and visual acuity estimates that are invariant with respect to practical issues of acuity testing, e.g., the design of the visual test or the optotypes used.

Problems solved by technology

Due to long testing times needed for clinical trials, this chart design and testing standard remains unfeasible for clinical testing by eye care specialists or general practitioners.
The testing of visual acuity with precision presents a challenge.
Furthermore, the variety of chart designs in circulation across clinical testing sites can make it difficult to compare and coordinate acuity testing obtained with different charts.
Without precision and concordance between the charts used for clinical vision testing, it remains difficult to track how vision changes with disease or treatment.

Method used


Image

  • Systems and methods for testing and analysis of visual acuity and its changes
  • Systems and methods for testing and analysis of visual acuity and its changes
  • Systems and methods for testing and analysis of visual acuity and its changes

Examples


example 1

[0359]A computer-based medical system as disclosed herein is used for tests and analyses of visual acuity of a diabetic subject by presenting to the subject with three out of the ten Sloan letters at a time on a digital screen. The prior information used to initiate the testing is a population-based study of visual acuity. With those population estimates, the device applies algorithm A to present the subject with high-rank single-line sub-charts on each test slide. After applying algorithm S to evaluate the acuity chart data collected on each slide, with respect to an acuity model that is predicting the respective probabilities of reporting 0, 1, 2, or 3 letters correctly on each slide, the next slide is selected based on a re-iterative application of algorithm A. When the patient returns for the next testing, the test starts with information from the population-based study of visual acuity, or instead considers the data from the previous testing session.

example 2

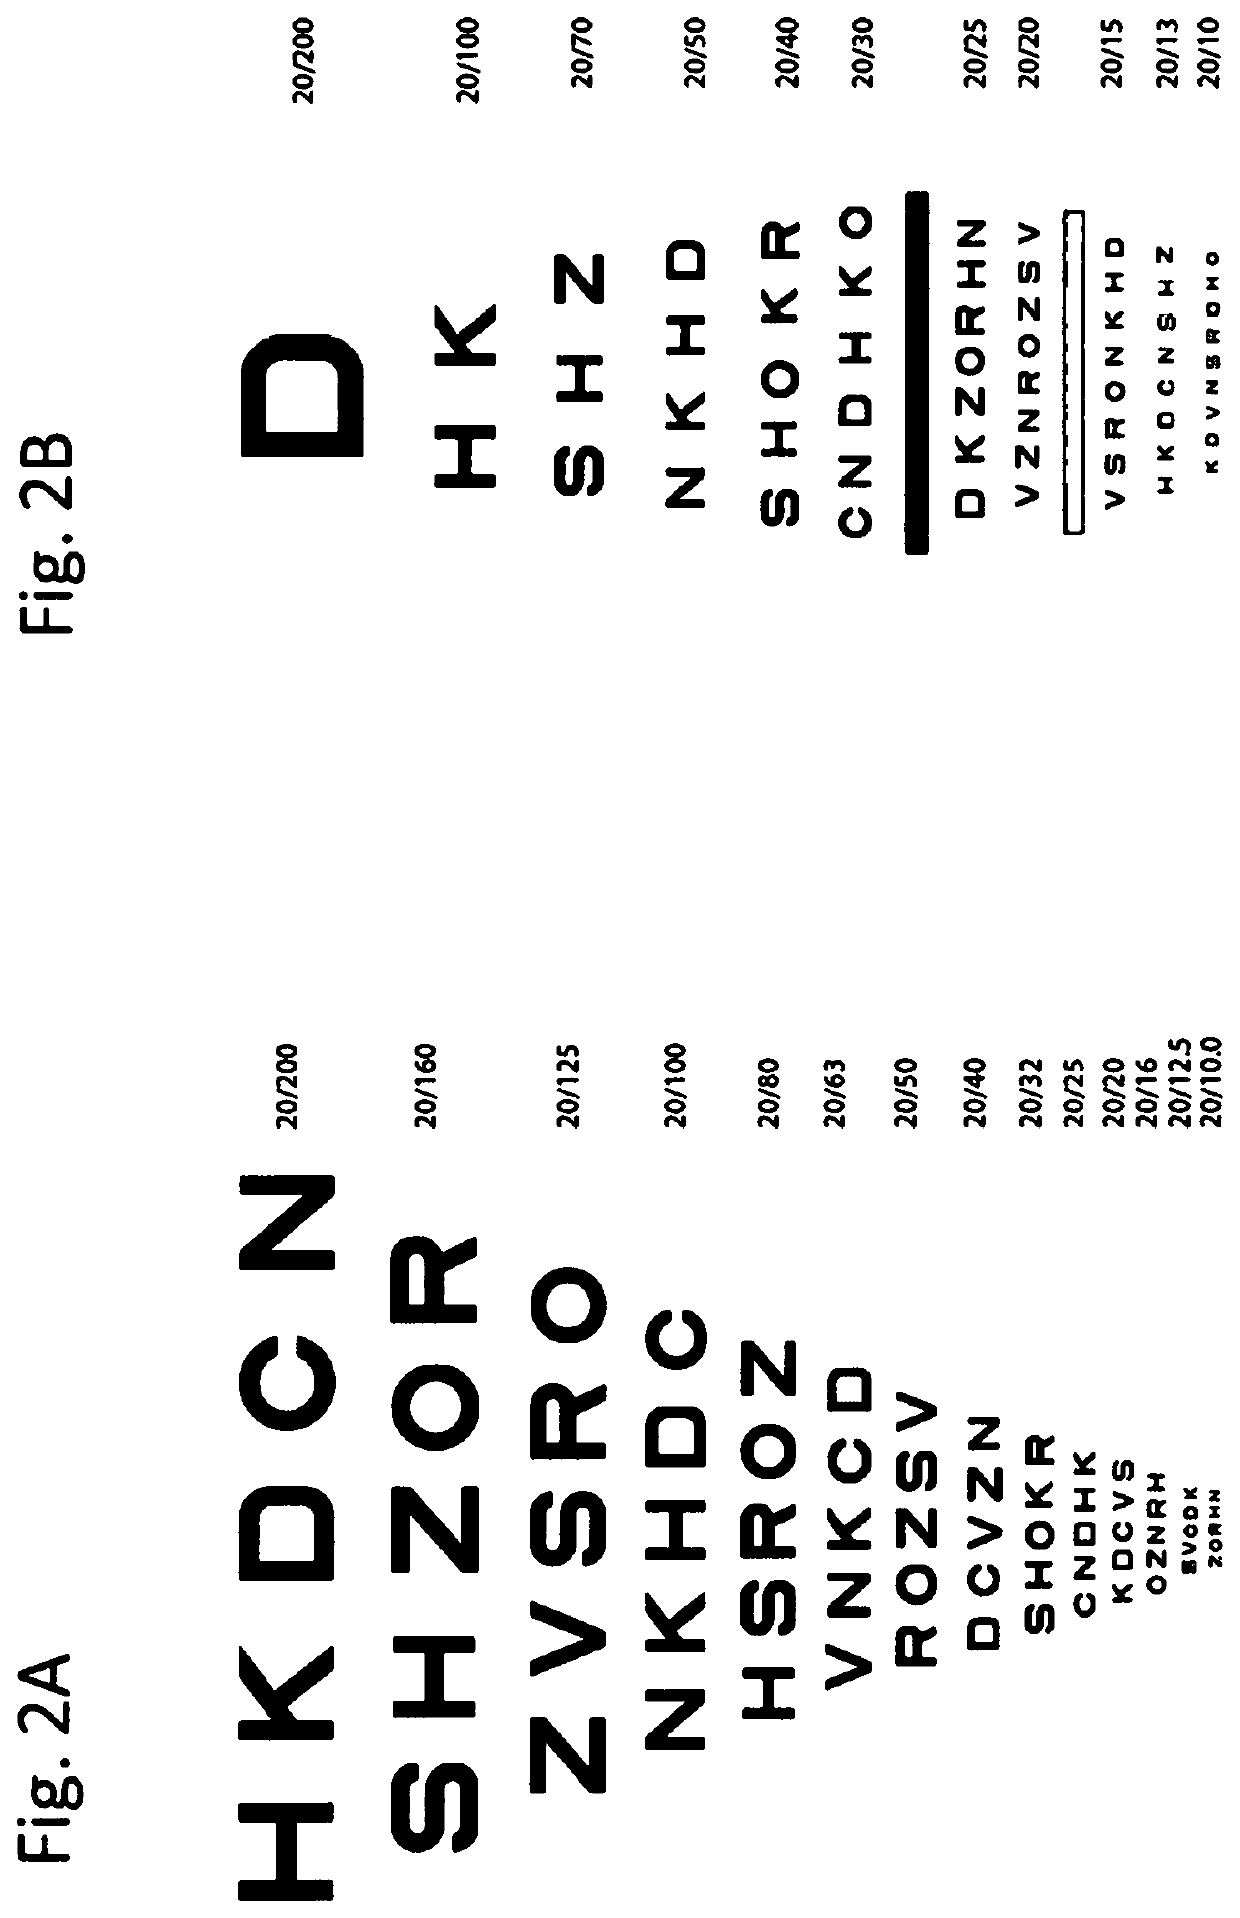
[0360]A computer-based medical device that applies the combination Algorithm to test visual acuity with personalized versions of the full Snellen or ETDRS acuity charts. Current testing with paper acuity charts is based on one reading, or “run”, through the full acuity chart, as the subject reads from the top of the chart to the bottom. In practice, when testing the visual acuity of two eyes, it is common to ask subjects to read through a single full acuity chart: first with one eye and then with the other. This confound, which prevents the independent testing of the two eyes, would be addressed and corrected by the personalization of different acuity charts to test each eye.

[0361]Like the application described above, general or specific clinical information can be used to initiate Algorithm A. Based on that information, Algorithm A is applied to select a personalized Snellen or ETDRS design. Following scoring with Algorithm S, the testing can terminate after the presentation of a s...

example 3

[0363]A web-based software service that allows retrospective analysis of acuity chart data. Customers uses this web interface to apply algorithm S to analyze visual acuity data they have previously collected using established visual chart designs. Current analyses of these data provide qualitative results with limited precision. This application of the scoring algorithm provides the richer information needed for detecting changes in visual acuity.

[0364]This is accomplished by detecting changes in sensitivity parameters that are independent of the specifics of the chart design. In the case of testing changes in contrast sensitivity, (Hou et al 2016, which are incorporated herein entirely by reference) proposed a novel Bayesian signal detection analysis that computes an area under the ROC to characterize the change between two experimental conditions, using the Bayesian posterior distributions estimated in independent experimental conditions. They calculated Bayesian posterior distrib...


PUM


Abstract

Disclosed herein are system and method for testing and analysis of visual acuity and changes using an acuity model, the acuity model generated based on one or more acuity chart design parameters and candidate acuity parameters calculated using the acuity test data of the subject, the acuity model comprising a chart-specific psychometric function determined using a family of multiple-optotype psychometric functions, and wherein the acuity model is configurable to estimate possibility of obtaining the acuity test data of the subject.

Description

CROSS-REFERENCE[0001]The present application claims the benefit of U.S. Provisional Application No. 62 / 524,414, filed Jun. 23, 2017, which is entirely incorporated herein by reference.BACKGROUND[0002]Visual acuity charts are commonly used to measure visual acuity because they are standardized and easy to use, and can be widely distributed. Testing of visual acuity typically involves asking a patient to identify optotypes—visual patterns of letters or objects—presented on a test slide (or series of slides). Each slide includes one or more optotypes, arranged in one or more lines at one time. The patient's ability to identify optotypes as a function of their size is registered and scored to yield an estimate of visual acuity. The estimate of visual acuity obtained, e.g., the smallest optotype size that the patient can reliably see, can depend fundamentally on the design of testing and scoring, which is based on pre-determined rules and heuristics specific to each chart.SUMMARY OF THE ...

Claims


Application Information

Patent Timeline
Patent Type & Authority Applications(United States)
IPC IPC(8): A61B3/032A61B3/00A61B5/16G16H50/50G16H10/60G16H50/20
CPCA61B3/0025G16H50/50G16H50/20A61B3/0041A61B5/163A61B3/032G16H10/60A61B3/022A61B3/00
Inventor LESMES, LUIS ANDRES
Owner ADAPTIVE SENSORY TECH INC
Why Eureka
Try Eureka