System and method for the detection and digitalization of the state of fresh concrete using infrared thermography and mathematical trend functions
a technology of infrared thermography and digitalization, applied in the field of measuring or testing, can solve problems such as defective prior solutions
- Summary
- Abstract
- Description
- Claims
- Application Information
AI Technical Summary
Benefits of technology
Problems solved by technology
Method used
Image
Examples
example 1
on of a Plurality of Infrared Thermography Images
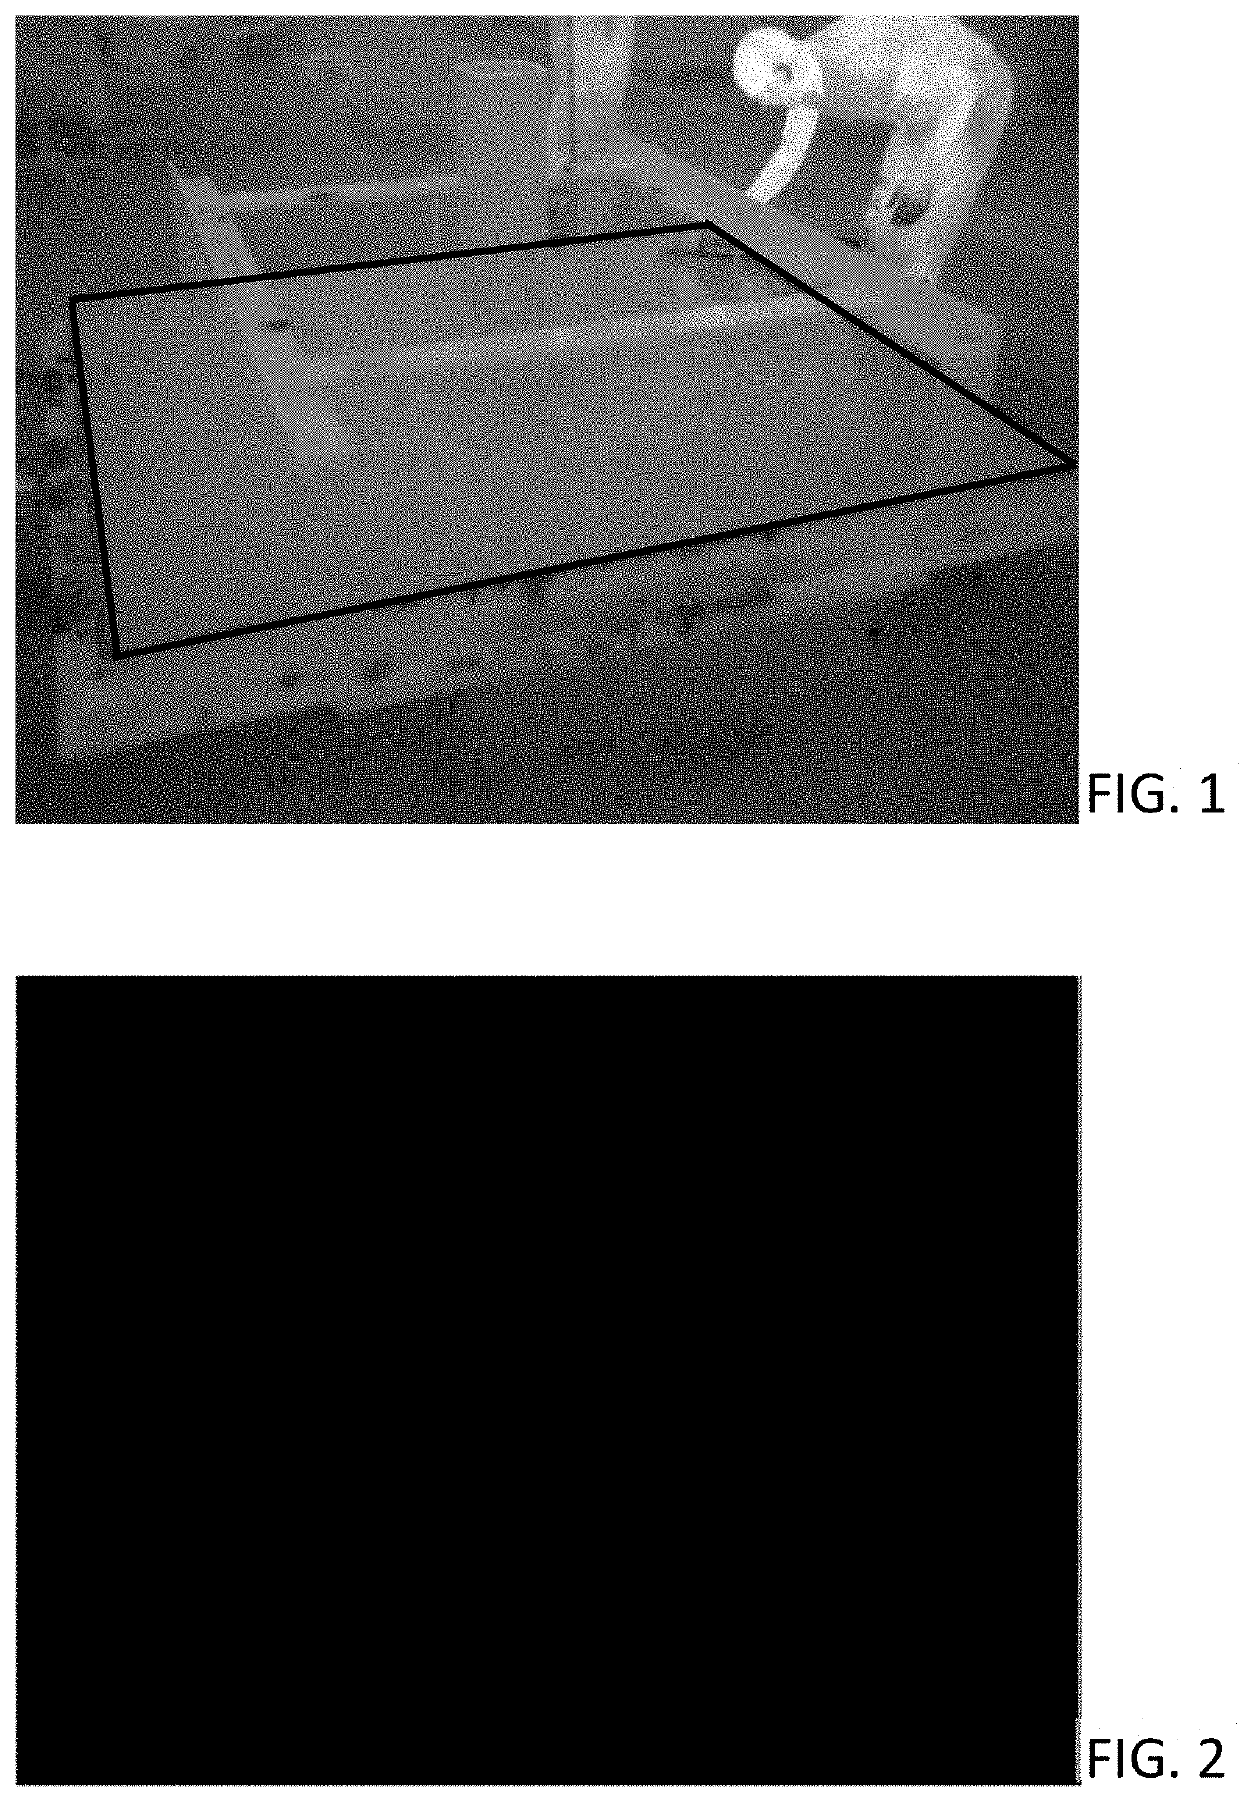
[0089]In FIG. 1 it is shown an infrared thermography image captured in a test of the method of the present invention. In this case, a fresh concrete sample was provided. The portion containing fresh concrete has been delimited by means of a black polygon that is not part of the original image, but that was incorporated for a better understanding of the present invention. Additionally, over the fresh concrete portion it is seen a metallic structure surrounding the concrete sample, as well as a general background of the test.
[0090]A plurality of infrared thermography images of said concrete sample was obtained at regular intervals of 15 minutes.
example 2
of the Temperature Profile and Curve of Temperature as Function of Time
[0091]FIGS. 8 and 9 show plots of temperature as a function of time corresponding, respectively, to a pixel containing concrete and to a pixel not containing concrete.
[0092]In said plots, the label ‘A’ corresponds to the temperature points measured from the thermographic images, ‘B’ corresponds to the curve of temperature as a function of time fitting said temperature profile, ‘C’ corresponds to the variation of ambient temperature and ‘D’ corresponds to the variation of the ambient temperature in the time range of interest.
[0093]Additionally, the values ΔTA and ΔTCD, respectively corresponding to the maximum ambient temperature difference and to the difference between the maximum and initial temperatures in the curve of temperature as a function of time in the time range of interest are shown at both figures.
[0094]The value ΔTA is the same in FIGS. 8 and 9, whereas the value ΔTCD differs in said figures.
example 3
tion of Whether a Pixel Corresponds to Concrete
[0095]In the case of FIG. 8, it is seen that the value ΔTCD, corresponding to the indicating value, is greater than the value ΔTA, which has been used as threshold value in this example. Consequently, the pixel that originated the temperature profile of FIG. 8 will be identified as a pixel containing fresh concrete.
[0096]In contrast, in the case of FIG. 9, it is seen that the value ΔTCD is lower than the value ΔTA. Consequently, the pixel that originated the temperature profile of FIG. 9 will be identified as a pixel not containing fresh concrete.
PUM
| Property | Measurement | Unit |
|---|---|---|
| time | aaaaa | aaaaa |
| time | aaaaa | aaaaa |
| time | aaaaa | aaaaa |
Abstract
Description
Claims
Application Information
 - R&D
- Intellectual Property
- Life Sciences
- Materials
- Tech Scout
- Unparalleled Data Quality
- Higher Quality Content
- 60% Fewer Hallucinations
Browse by: Latest US Patents, China's latest patents, Technical Efficacy Thesaurus, Application Domain, Technology Topic, Popular Technical Reports.
© 2025 PatSnap. All rights reserved.Legal|Privacy policy|Modern Slavery Act Transparency Statement|Sitemap|About US| Contact US: help@patsnap.com


