

Hydrogen breath analyzer and breath test method
a breath analyzer and breath technology, applied in the field of breath analyzer and breath test method, can solve the problem of too large response time for gas flow detection, and achieve the effect of increasing the ph sensitivity of polyaniline and increasing the concentration of hydrogen
- Summary
- Abstract
- Description
- Claims
- Application Information
AI Technical Summary
Benefits of technology
Problems solved by technology
Method used
Image

Examples
example 1
say for Detection
[0130]Patients abstain from food and drink except for small quantity of water for at least 8 hours before this test. A breath sample is delivered to the hydrogen biosensor as below:[0131]Step 1: Collect breath sample in Tedlar bag.[0132]Step 2: Breath is delivered to biosensor using dilutor in the 0.1 L / min flow rate.[0133]Step 3: Electronic data is taken until signal is stable within 2 minutes.[0134]Step 4: Two known concentrations of hydrogen gas in breath are used to generate the calibration curve for the biosensor.[0135]Step 5: Customized program is used to perform the modeling and to calculate the hydrogen gas concentration.
[0136]Result
[0137]An example result is shown in FIG. 25, where the amount of hydrogen gas is 5.2 ppm with a variance of 5%.
example 2
lidation Using Quintron
[0138]This example describes the comparative analysis of a breath sample with a commercial device, Quintron, and the hydrogen gas polyaniline biosensor of the present disclosure.
[0139]The same breath sample of Example 1 was also characterized using Quintron, and the measuring value is consistent with gas sensor 50. The deviation of two devices, Quintron and biosensor, is ˜0.12%.
example 3
alyzer
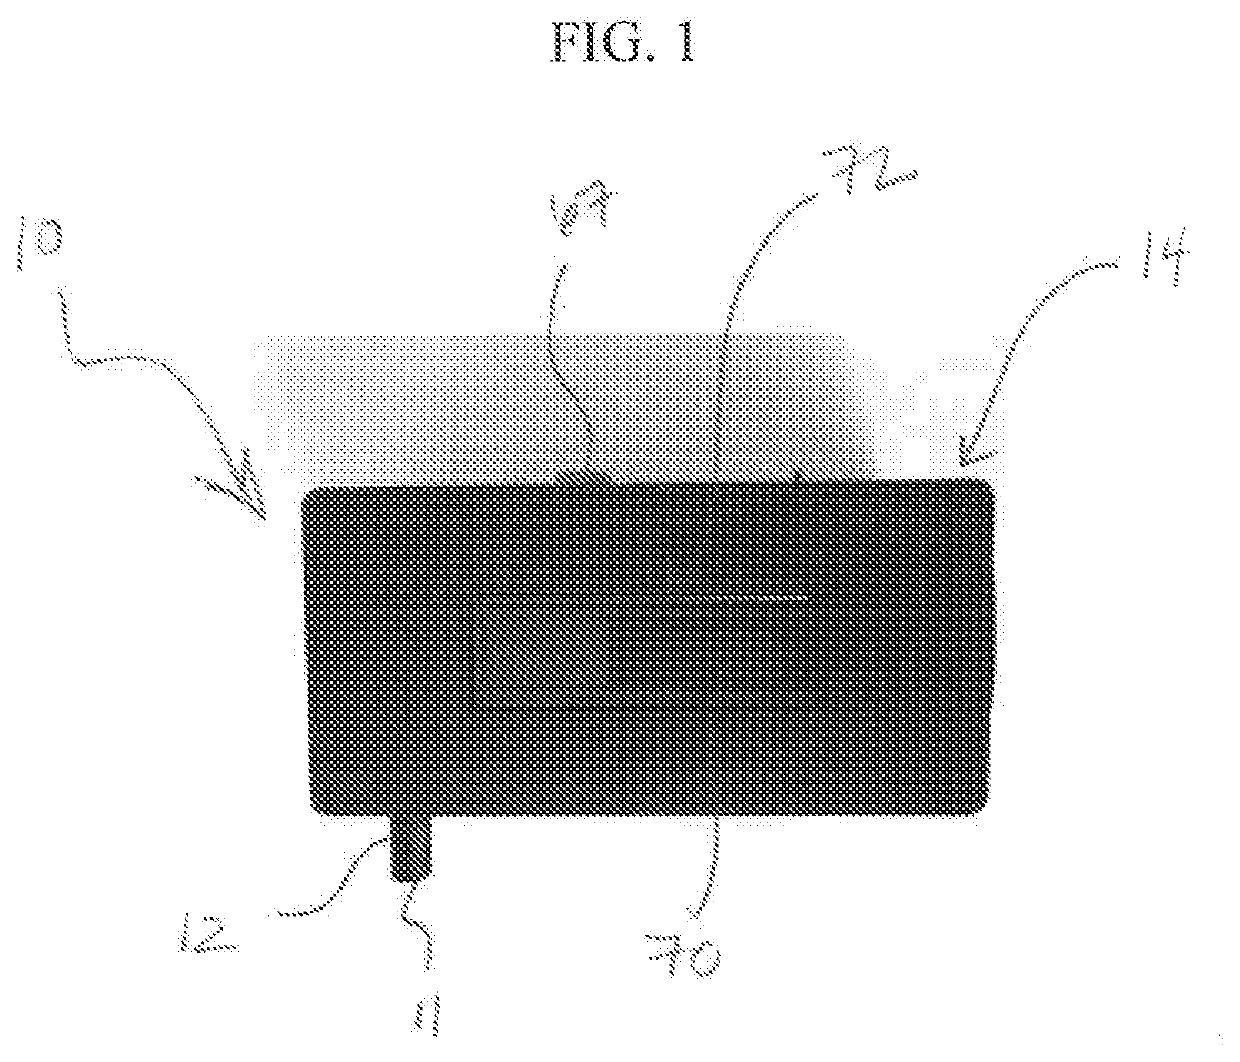
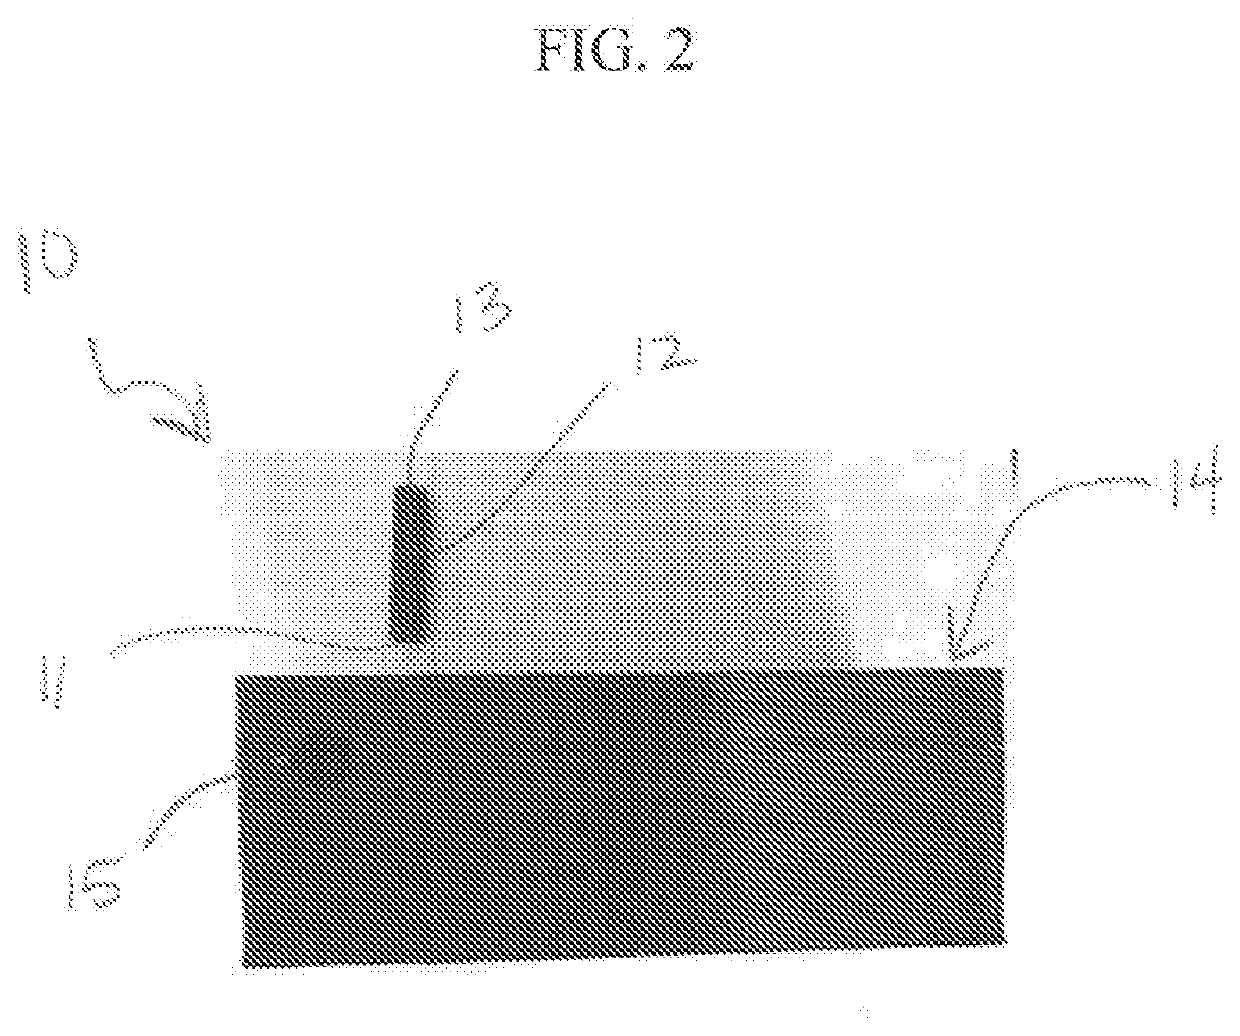
[0140]A standalone breath analyzer using PANI / CSA / Pt (Pt=platinum) biosensor was built and tested. The structure of the breath analyzer 10 contains a flow system regulating breath flow and humidity for the gas sensor 50 using a desiccant / breath filter, a real-time LED display 70 for displaying results from the gas sensor 50, a gas sensor 50 mounted behind the desiccant / breath filter, and an arduino microchip to acquire data and analyze. Three breath samples were tested and able to establish a relationship curve for H2 detection. The curve was fitted with a 2nd order polynomial equation as a function of change in slope due to the breath sample (FIG. 27). Equation 3, shown below, can be used, which will allow display 70 to display the hydrogen gas concentration present in the breath sample tested.
ppm→-a2-a22-4a1a3+4a1slope2a1,Equation3
where a1=4E-19, a2=0.0047, a3=0.4009
[0141]The system shown in FIG. 48 provides a universal readout circuit system 100 for sensors ...
PUM
| Property | Measurement | Unit |
|---|---|---|
| humidity | aaaaa | aaaaa |
| humidity | aaaaa | aaaaa |
| humidity | aaaaa | aaaaa |
Abstract
Description
Claims
Application Information