Determination of light absorption pathlength in a vertical-beam photometer

a technology of light absorption pathlength and photometer, which is applied in the field of photometry, can solve the problems of difficult reproducibility control, large error in the determination of either relative optical pathlength or the concentration of analytes in unknown optical vessels, and the existence of undefined light absorption pathlength in vertical-beam photometers

Inactive Publication Date: 2001-02-13
MOLECULAR DEVICES
View PDF4 Cites 59 Cited by
  • Summary
  • Abstract
  • Description
  • Claims
  • Application Information

AI Technical Summary

Problems solved by technology

The problem of an undefined light absorbance pathlength in vertical-beam photometers has existed since the advent of vertical-beam photometers, i.e., for over 20 years.
Substantial errors in determination of either relative optical pathlength or the concentration of analytes in vessels of unknown optical pathlength by prior art methods occur because of 1) substantial variation in solvent temperature, 2) substantial variation in solvent composition and 3) substantial presence of materials in the samples which absorb light in the wavelength region where the optical pathlength of the solvent is being monitored.
1 usually is unknown and difficult to control reproducibly.
Vertical-beam photometry has become a popular technique despite the disadvantage of not having a fixed optical pathlength through the sample.
1, but instead must be determined from a "standard curve" constructed for each analytical measurement, s

Method used


Image

  • Determination of light absorption pathlength in a vertical-beam photometer
  • Determination of light absorption pathlength in a vertical-beam photometer
  • Determination of light absorption pathlength in a vertical-beam photometer

Examples


example 2

The method described in this example allows measurements of optical pathlength with mixtures of aqueous and nonaqueous solvents. It also provides for correction when substances, other than water, tl at may absorb at the NIR wavelengths selected to monitor optical pathlength in vertical-beam photometry are present in the solvent. In this example, the NIR wavelength difference, A.sub.970 -A.sub.900, is used to monitor pathlength in aqueous samples. Alternatively, the "pseudo-isobestic pairs," described above provide superior results under certain conditions. For example, the (A.sub.1000 -A.sub.900) pair will provide superior results with silicon photodetectors when the light absorption pathlength is in excess of about 0.4 cm. because in this case an absorbance value of about 0.060 will be obtained. The (A.sub.1185 -A.sub.1100) pair will provide superior results when a vertical-beam photometer is used which employs photodetectors sensitive to light at wavelengths of 1100 and 1185 nanom...

example 3

The method described in this example may be employed with any solvent, including solvents substantially free of water. For this method the absorbance spectrum of the desired solvent is determined in the NIR. Two wavelengths are then selected, a first wavelength near an absorbance maximum, denoted as A.sub.max, of the solvent; and a second wavelength near an absorbance minimum denoted as A.sub.min, of the solvent. The difference in absorbance of samples at the first and second wavelengths, A.sub.max -A.sub.min, should preferably be selected to be between 0.050 and 5.0. It is particularly preferred that the value of A.sub.max -A.sub.min be selected to be between 0.1 and 1.0. The method is conducted as follows:

1A. Load the solvent employed to dissolve the analyte into a cuvette of known optical pathlength, for example, a 1 cm optical path cuvette. This optical pathlength is known as the Solvent Pathlength. Place the cuvette in a photometer and measure A.sub.max -A.sub.min. This paramet...

example 4

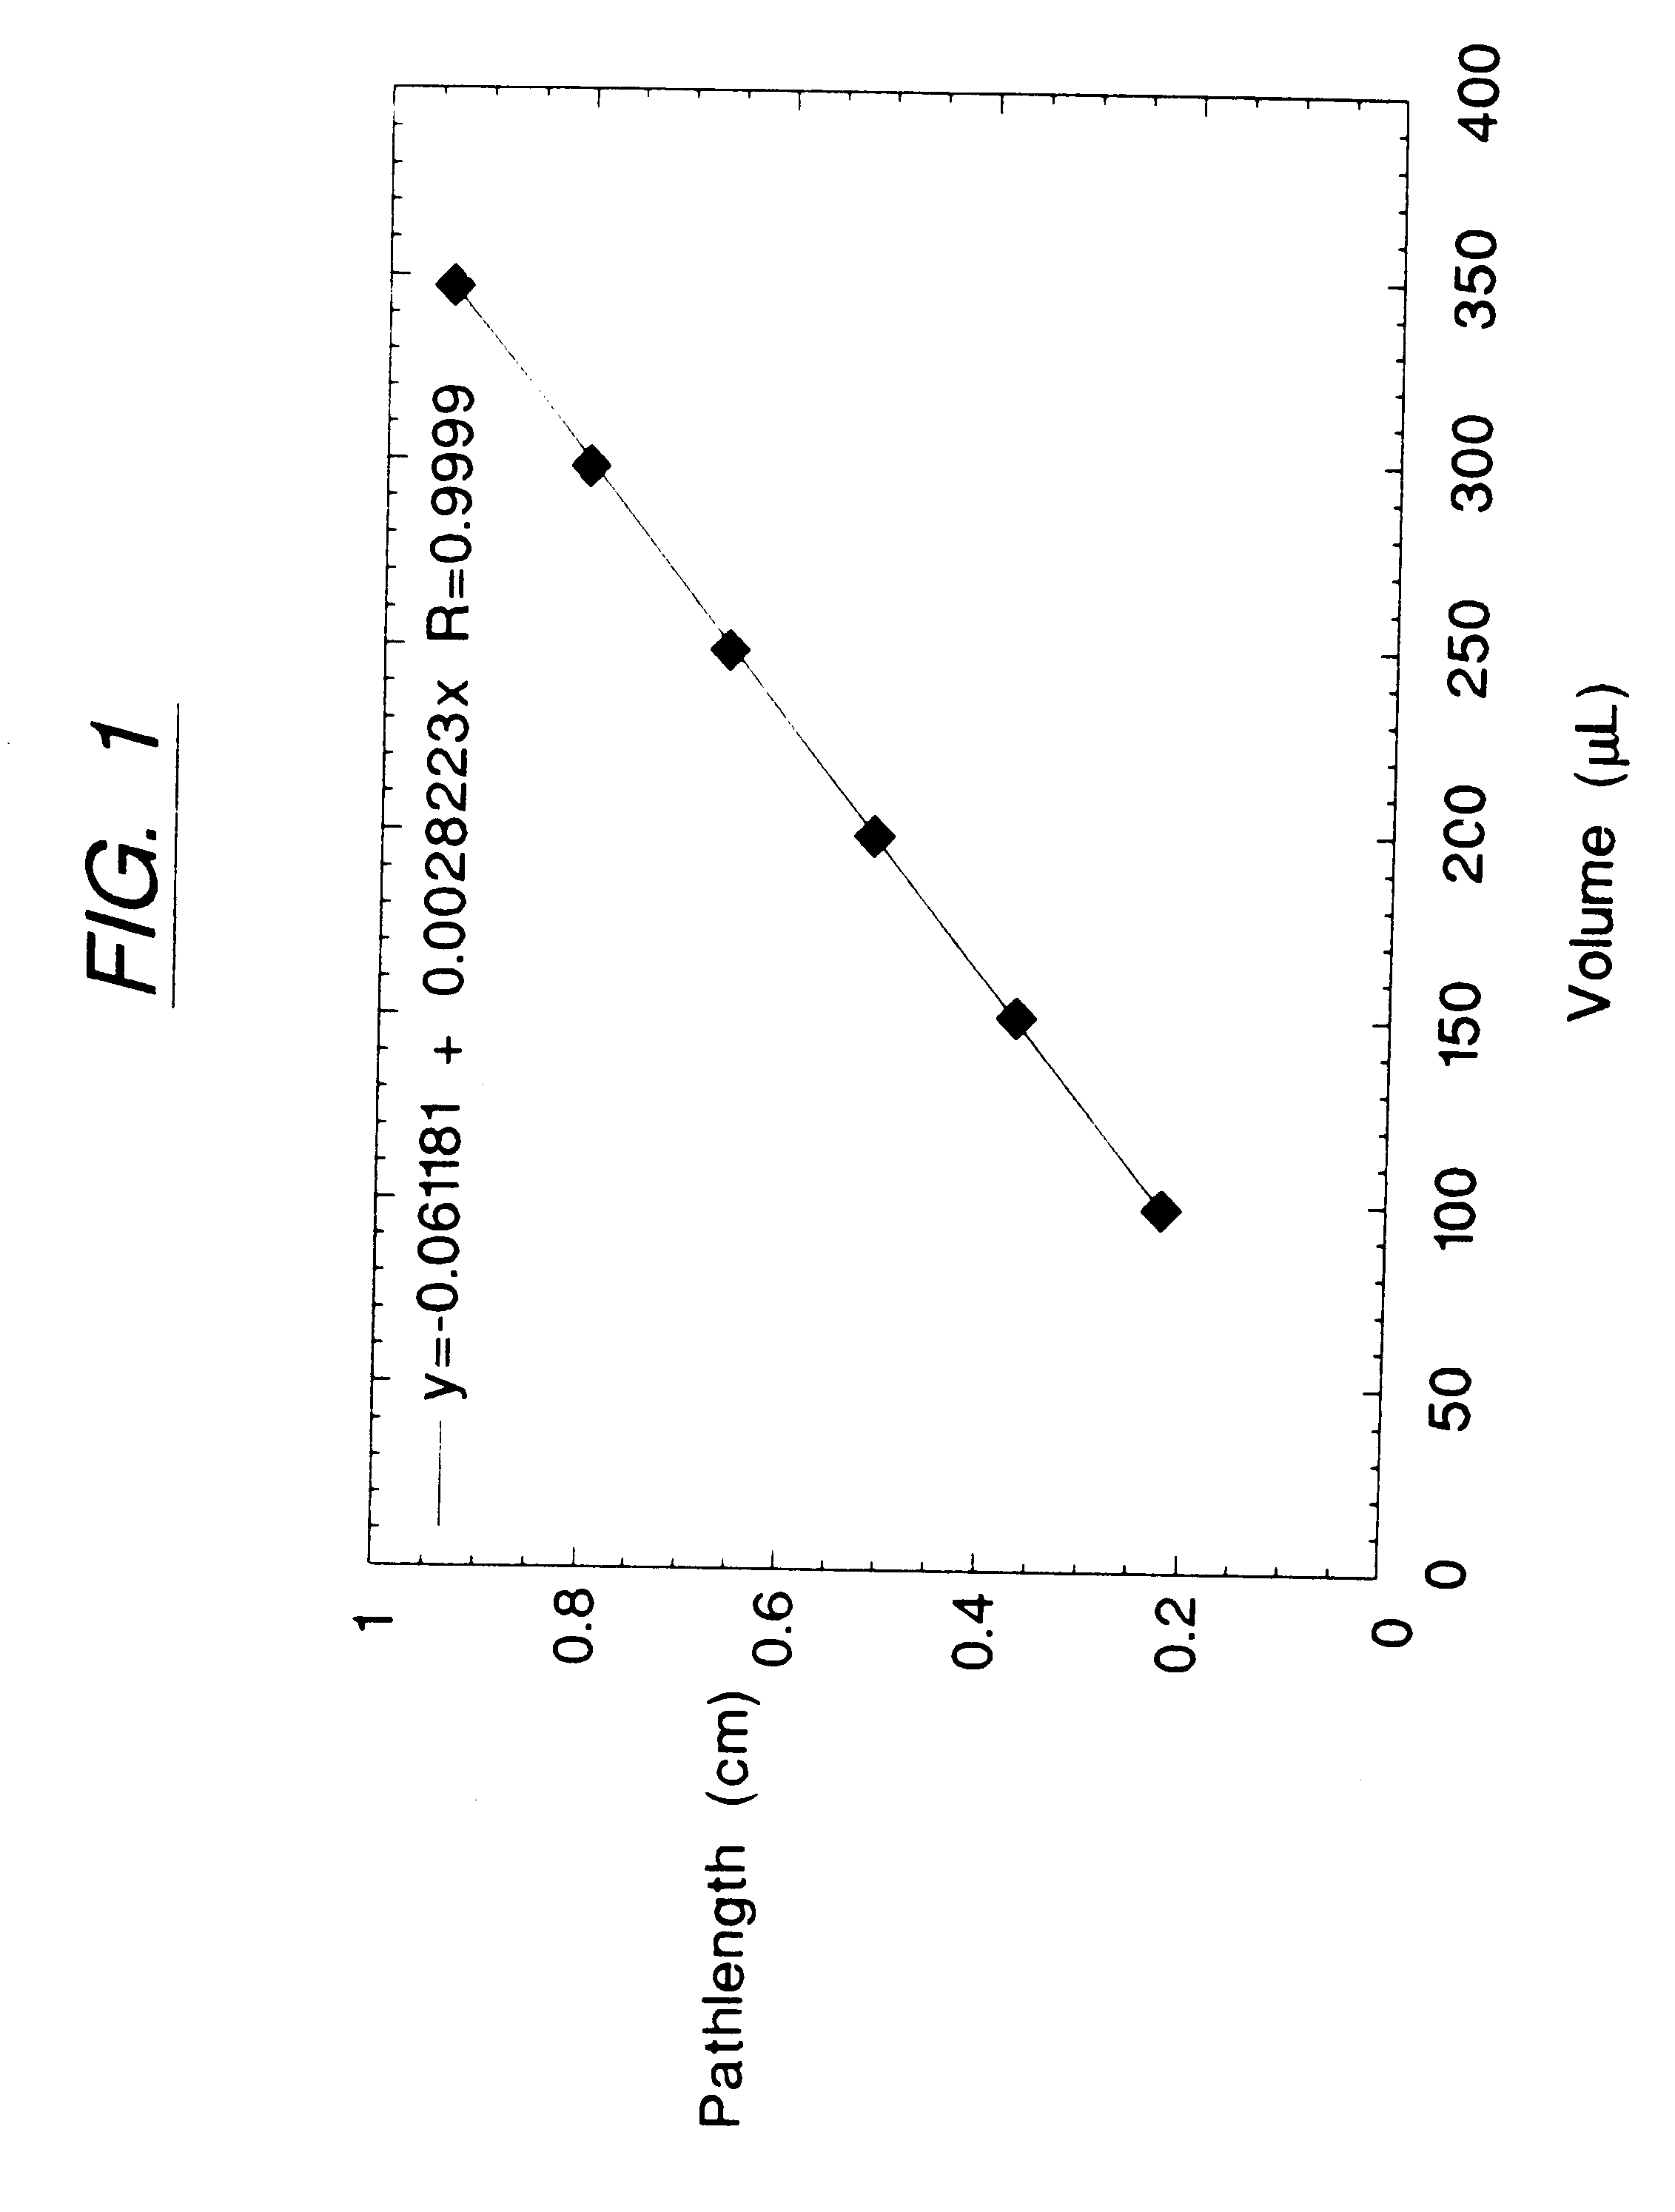
The data established in Example 1 above were used to determine the relationship between Light Absorption Pathlength and Sanple Volume in the Nunclon.TM. Delta 96-well, flat-bottom multi-assay plates utilized in that Example. Measurements of A.sub.970 -A.sub.900 were performed on six different chromophoric analytes, Acid Orange 8, Acid Orange 74, Azure B, Direct Yellow 62, Durkee Yellow Food Color, and Schilling Blue Food Color, in aqueous solvent. The sample solutions were dispensed into the wells of the multi-assay plate at either 350, 300, 250, 200, 150, or 100 .mu.l sample volume per well. Each sample and volume combination was tested in 8 replicate wells of the microplate.

The values of A.sub.970 -A.sub.970 obtained experimentally were used to determine Light Absorption (i.e., optical) Pathlength for each well according to Eq. 2. FIG. 1 shows the volume of sample pipetted into each well vs. the mean Light Absorption Pathlength so determined and averaged for all wells of a given v...


PUM


Abstract

Disclosed are photometric methods and devices for determining optical pathlength of liquid samples containing analytes dissolved or suspended in a solvent. The methods and devices rely on determining a relationship between the light absorption properties of the solvent and the optical pathlength of liquid samples containing the solvent. This relationship is used to establish the optical pathlength for samples containing an unknown concentration of analyte but having similar solvent composition. Further disclosed are methods and devices for determining the concentration of analyte in such samples where both the optical pathlength and the concentration of analyte are unknown. The methods and devices rely on separately determining, at different wavelengths of light, light absorption by the solvent and light absorption by the analyte. Light absorption by the analyte, together with the optical pathlength so determined, is used to calculate the concentration of the analyte. Devices for carrying out the methods particularly advantageously include vertical-beam photometers containing samples disposed within the wells of multi-assay plates, wherein the photometer is able to monitor light absorption of each sample at multiple wavelengths, including in the visible or UV-visible region of the spectrum, as well as in the near-infrared region of the electromagnetic spectrum. Novel photometer devices are described which automatically determine the concentration of analytes in such multi-assay plates directly without employing a standard curve.

Description

1. Field of the InventionThis invention relates to the field of photometry. In particular, the invention relates to spectrophotometric methods and apparatus capable of determining the light absorption pathlength for various samples to be analyzed with a spectrophotometer.2. Description of the Related ArtThe problem of an undefined light absorbance pathlength in vertical-beam photometers has existed since the advent of vertical-beam photometers, i.e., for over 20 years. Substantial errors in determination of either relative optical pathlength or the concentration of analytes in vessels of unknown optical pathlength by prior art methods occur because of 1) substantial variation in solvent temperature, 2) substantial variation in solvent composition and 3) substantial presence of materials in the samples which absorb light in the wavelength region where the optical pathlength of the solvent is being monitored.Photometry is a common measurement technique employed to monitor optical char...

Claims


Application Information

Patent Timeline
IPC IPC(8): G01N21/31G01N21/25
CPCG01N21/253G01N21/3151G01F22/00
Inventor HAFEMAN, DEAN G.CHOW, CALVIN T.
Owner MOLECULAR DEVICES
Why Eureka
Try Eureka