First, there is a selectivity estimation method using a correlation fractal dimension that is used for queries in a
geographic information system[reference: A. Belussi, C. Faloutsos. Estimating the Selectivity of Spatial Queries Using `Correlation` Fractal Dimension. VLDB Conference 1995]. However, the selectivity estimation using the correlation fractal dimension can compute only the average of the estimation results for the same shape and size queries and cannot compute the
estimation result for the query in a specified position. Additionally, the selectivity estimation can be practically used in two and three dimensions.
Secondly, there is an estimation method that uses a multi-dimensional file organization called the multilevel
grid file(MLGF)[Reference: K. Y. Whang, S. W. Kim, G. Wiederhold.
Dynamic Maintenance of Data Distribution for Selectivity
Estimation, VLDB Journal Vol.3, No. 1, p29-51, 1994]. The MLGF partitions the multi-dimensional
data space into several disjoint nodes, called grids, that act as histogram buckets. A new field, count, is added to each grid node for saving the number of data in the grid. The selectivity is estimated by accessing grid nodes overlapping with a query. This method supports
dynamic data updates because MLGF itself is a dynamic
access method, thus to reflect histogram information for the selectivity estimation immediately when data are updated. Therefore, in an environment where data is updated frequently, the overhead for periodical reconstructions of the histogram information can be eliminated. However, the MLGF suffers from the dimensionality curse that means severe performance degradation in high dimensions [Reference: S. Berchtold, C. Bohm, H. Kriegel. The
Pyramid Technique: Towards Breaking the
Curse of Dimensionality. ACM SIGMOD Conference 1998]. So, the method can not be applied in dimensions higher than three.
Third, there is proposed a
Singular Value Decomposition(SVD) method. The SVD method decompose the joint data
distribution matrix J into three matrices U, D, and V that satisfy J=UDV.sup.T. Large magnitude
diagonal entries of the
diagonal matrix D are selected together with their pairs, left singular vectors from U and right singular vectors from V. These singular vectors are partitioned using any one-dimensional
histogram method. There are many efficient SVD algorithms, but the SVD method can be used only in two dimension.
Fourth, there is proposed a Hilbert
Numbering method. The Hilbert
numbering method converts the multi-dimensional joint data distribution into the 1-dimensional one and partitions it into several disjoint histogram buckets using any one-dimensional
histogram method. The buckets made by this method may not be rectangles. Therefore, it is difficult to find the buckets that overlap with a query. The estimates may be inaccurate because it does not preserve the multi-dimensional proximity in 1-dimension.
Fifth, there are proposed the PHASED method and the MHIST method. The PHASED method partitions an n-dimensional space along one dimension chosen arbitrarily by the Equi-depth
histogram method, and repeats this until all dimensions are partitioned. The MHIST method is an improvement to the PHASED method. It selects the most important dimension in each state and partitions it. From the V-optimal point of view as an applied partitioning method in MHIST, the dimension that has the largest variance is the most important. The experiments showed that the MHIST technique is the best among a variety of multi-dimensional histogram techniques [Reference: V.
However, even though it produces low error rates in 2-dimensional cases, it has relatively high error rates in the 3 or more dimensional space.
As the dimension increases, however, the number of histogram buckets that can achieve low error rates increases explosively.
It causes a severe storage overheads problem, which results in failure in sufficient small-sized buckets so as to have low error rates.
Therefore, it is impossible to maintain a reasonably small storage with low error rates in high dimensions.
Also it is difficult to partition a multi-dimensional space into disjoint histogram buckets efficiently so that the error rates are kept small.
From a practical point of view, these methods cannot be used in dimensions higher than three.
Another problem is that all methods except the MLGF method cannot reflect
dynamic data updates immediately to the statistics for the selectivity estimation.
This leads to an additional overhead such as the periodical reconstruction of statistics for the estimation.
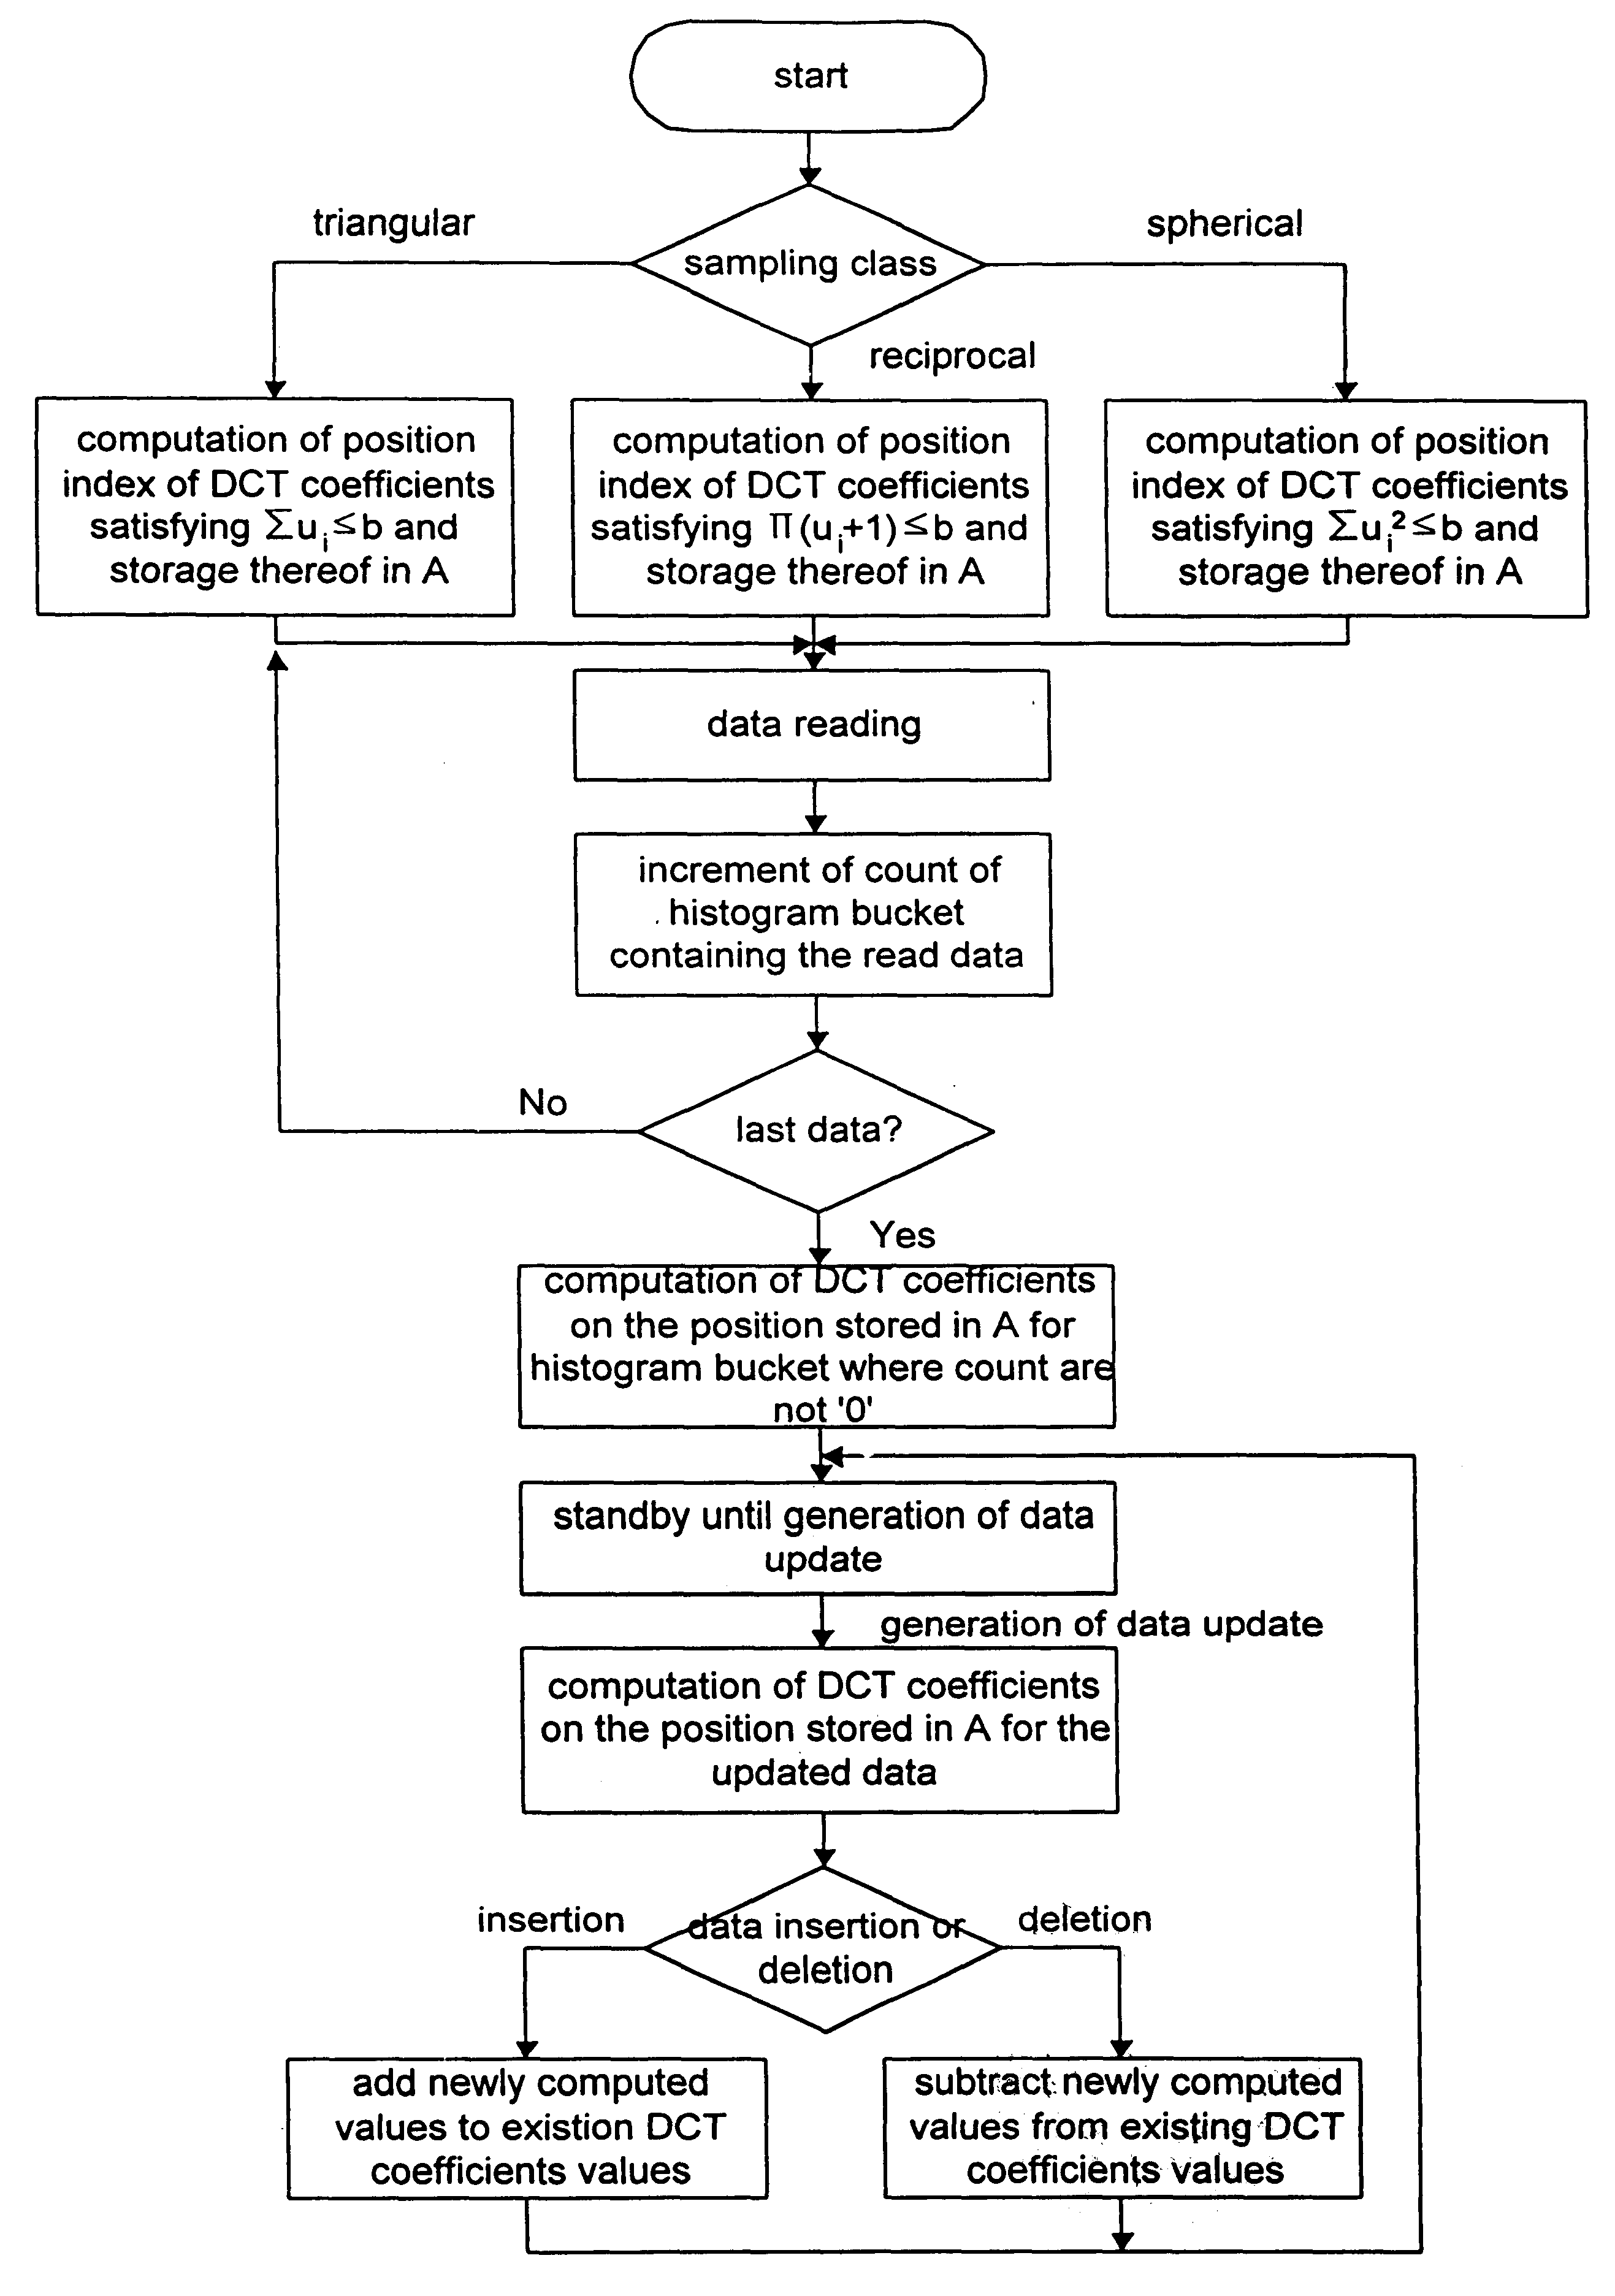
First, compressed histogram information from a large number of small-sized buckets is maintained using the
discrete cosine transform(DCT). This can be achieved from the fact that DCT can compress the information remarkably. DCT has been widely used in the image and
signal processing area usually in 2-dimensional domain. Therefore, in the preferred embodiment of the present invention, the DCT is extended to a general n-dimensional domain.
Second, low error rates can be achieved by small-sized buckets.
Third, low storage overheads can be achieved by compressing a large amount of histogram bucket information.
Fourth, this method has the
advantage in that it is not necessary to periodically reconstruct statistics for selectivity estimation, because it reflects
dynamic data updates into the statistics for the estimation immediately using the
linearity of DCT.


