Eureka AIR delivers breakthrough ideas for toughest innovation challenges, trusted by R&D personnel around the world.

Method for direct hydrocarbon reservoir detection and delineation by low frequency acoustic spectroscopy

a low frequency acoustic spectroscopy and hydrocarbon reservoir technology, applied in the direction of gravity wave measurement, geological measurement, reradiation, etc., can solve the problems of inability to make definite statements regarding the existence of deposits and their geographic composition, the detection of such deposits, in particular oil and gas deposits, and the accident of detection

Inactive Publication Date: 2002-10-29
ADNR TECH SERVICES
View PDF3 Cites 49 Cited by
  • Summary
  • Abstract
  • Description
  • Claims
  • Application Information

AI Technical Summary

Benefits of technology

The method of this invention provides a direct statement regarding the type and extent of deposits without necessarily first sinking exploration drill holes. It thus saves costs, is ecologically advantageous and is also suitable for monitoring changes in the deposits, which is important for an efficient working of such deposits.
During examination of deposits having multiphase fluid systems in porous bodies, an effect can be observed, which can be used to determine the type of the deposits and which is the subject of this invention.
Thus the method of this invention provides information regarding the type and location of the deposits, has considerable economic advantages and also ecological advantages in comparison with the known methods. The number of test drillings, which up to now was necessary, can be drastically reduced with this invention, which results in a considerable reduction of the costs required for an exploration. At the same time destruction of the environment is prevented to a large extent, which otherwise had to be accepted when sinking test bores.

Problems solved by technology

Historically, the detection of such deposits, in particular oil and gas deposits, occurred by accident.
This is also still the case to a large extent today and is extremely unsatisfactory.
Methods have been developed which are of a technical nature and make confirmation of hypotheses easier but which are not suitable to make definite statements regarding the existence of deposits and their geographic composition.
The amount of knowledge in regard to searching for hydrocarbon deposits is still very limited, and is basically limited to performing seismic, geologic, geo-physical or geo-chemical explorations, all of which, however, still have a more or less experimental character and do not permit direct statements regarding the type of deposits.
Such explorations can be evaluated using two-dimensional, as well as three-dimensional methods, however, they are not suited for determining the type of the inhomogeneity but only provide information as to its existence, which is important but not sufficient.
Although it is possible by evaluating the reflections to recognize formations as an image of the reflection properties, it is not possible to determine the type of these formations.
These known methods are very expensive to perform, and their result can be to find that which is not sought.
One disadvantage of these known methods is that they are almost impossible to perform technically and the frequency of the resonance to be exited, to the extent that it is based on workable deposits, is strictly a function of the geometric spread of the deposits, and not of their nature.
Moreover, the effect is not a resonance effect in the sense of a periodically exited resonator, but the energy release with the characteristic frequencies takes place chaotically.
However, this value B.sub.min can only be exactly determined from a correlation of the deposit to be examined with already known deposits and with other geologic and seismic data.
The detection of these signals by measuring techniques and the recognition of the anomalies requires a great cost outlay in apparatus and mathematics, because the signal to be detected is hidden in the noise spectrum because of its small amplitude, and because the characteristic frequencies are not strictly monochromatic, but distributed over a defined range of the spectrum.

Method used


Image

  • Method for direct hydrocarbon reservoir detection and delineation by low frequency acoustic spectroscopy
  • Method for direct hydrocarbon reservoir detection and delineation by low frequency acoustic spectroscopy
  • Method for direct hydrocarbon reservoir detection and delineation by low frequency acoustic spectroscopy

Examples


Embodiment Construction

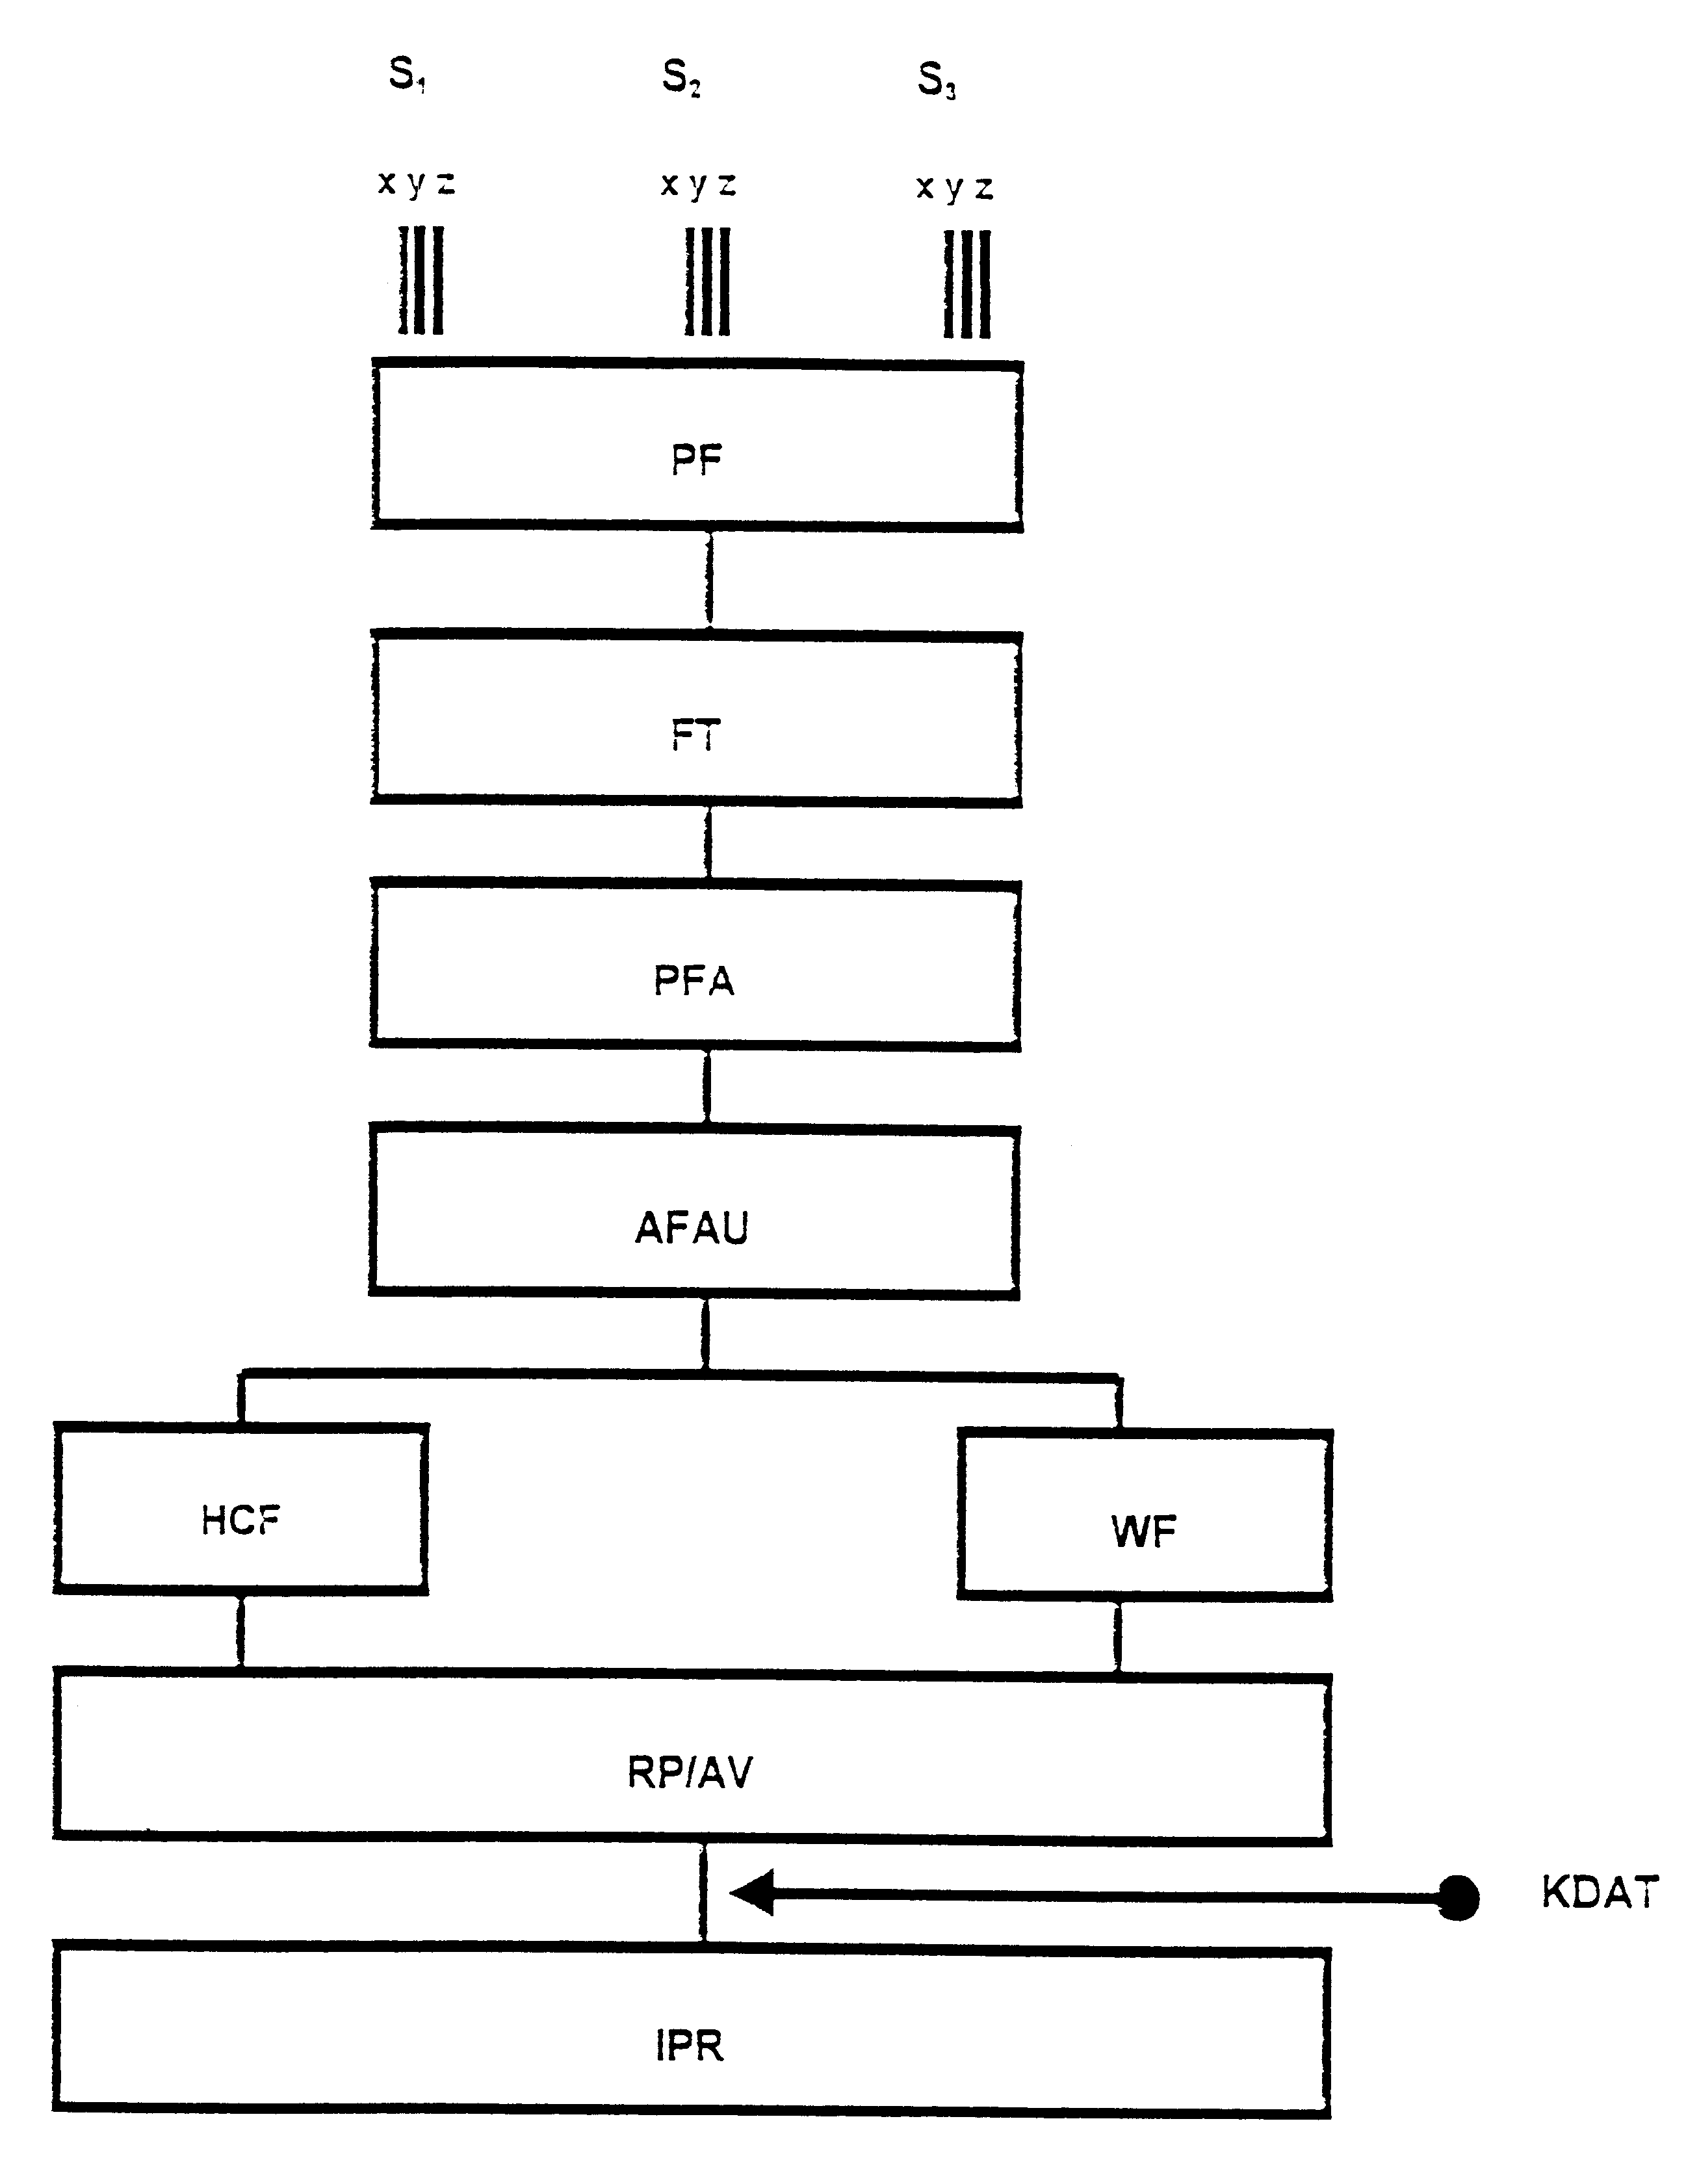
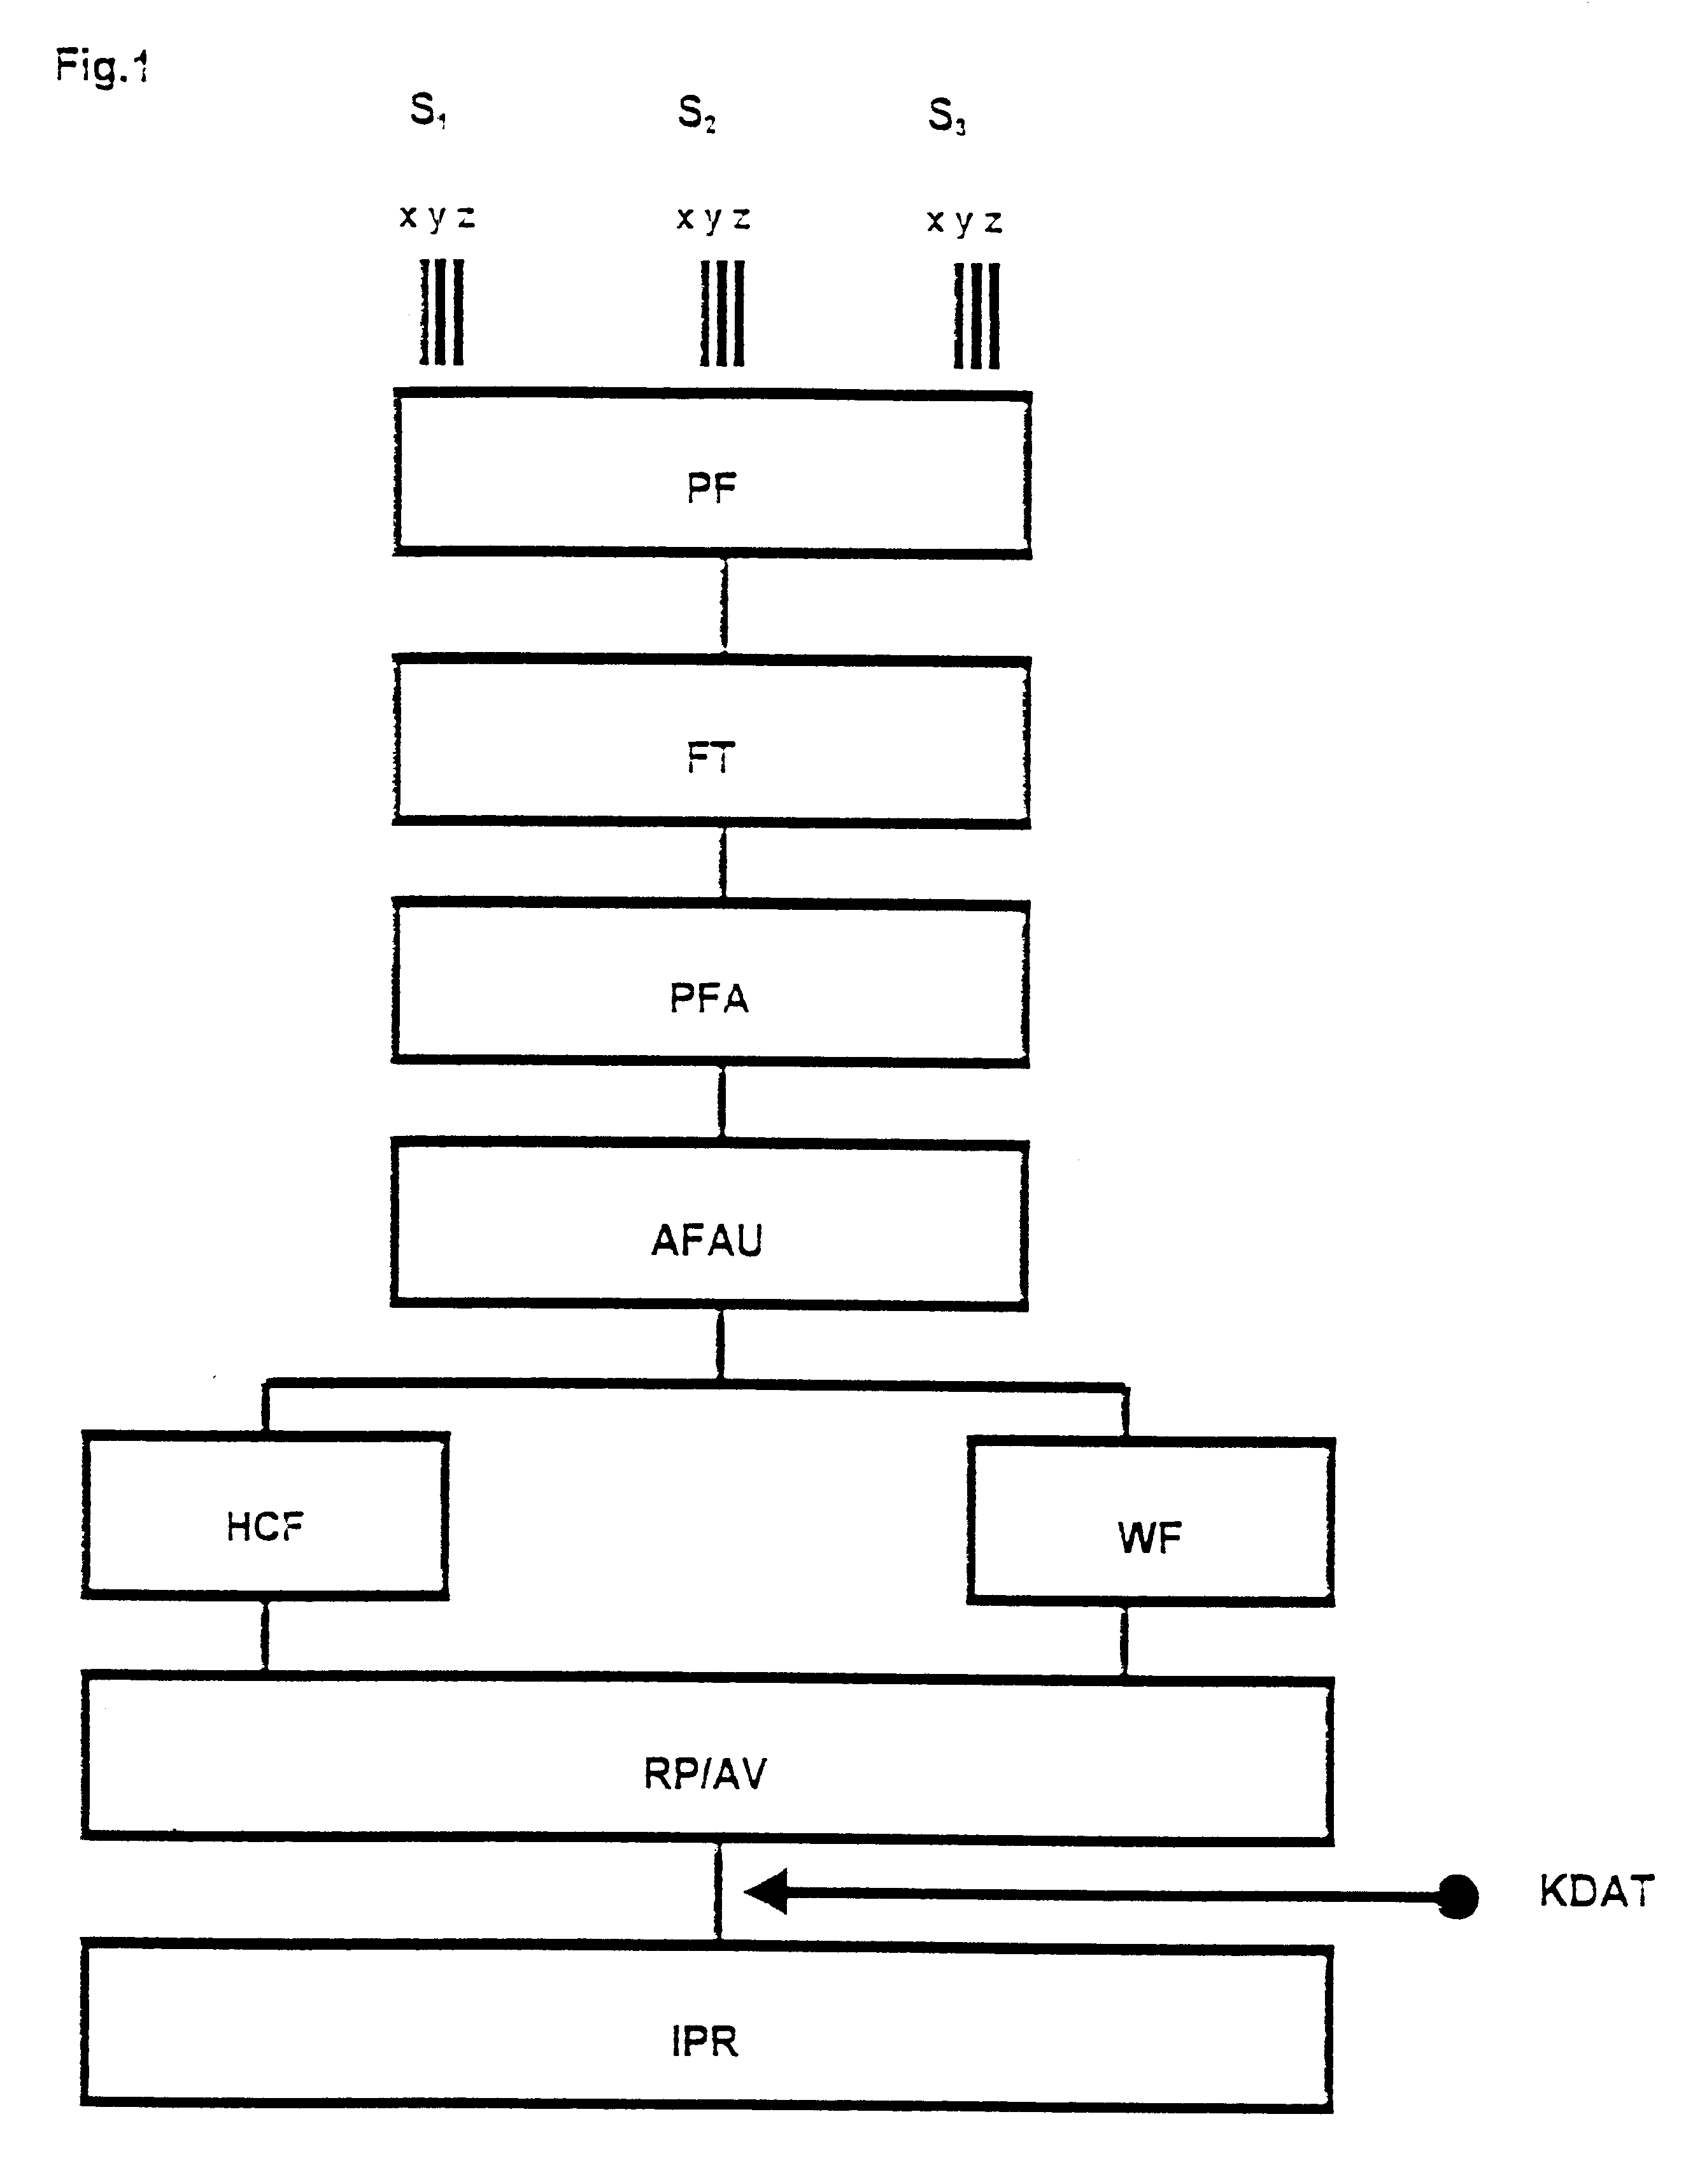
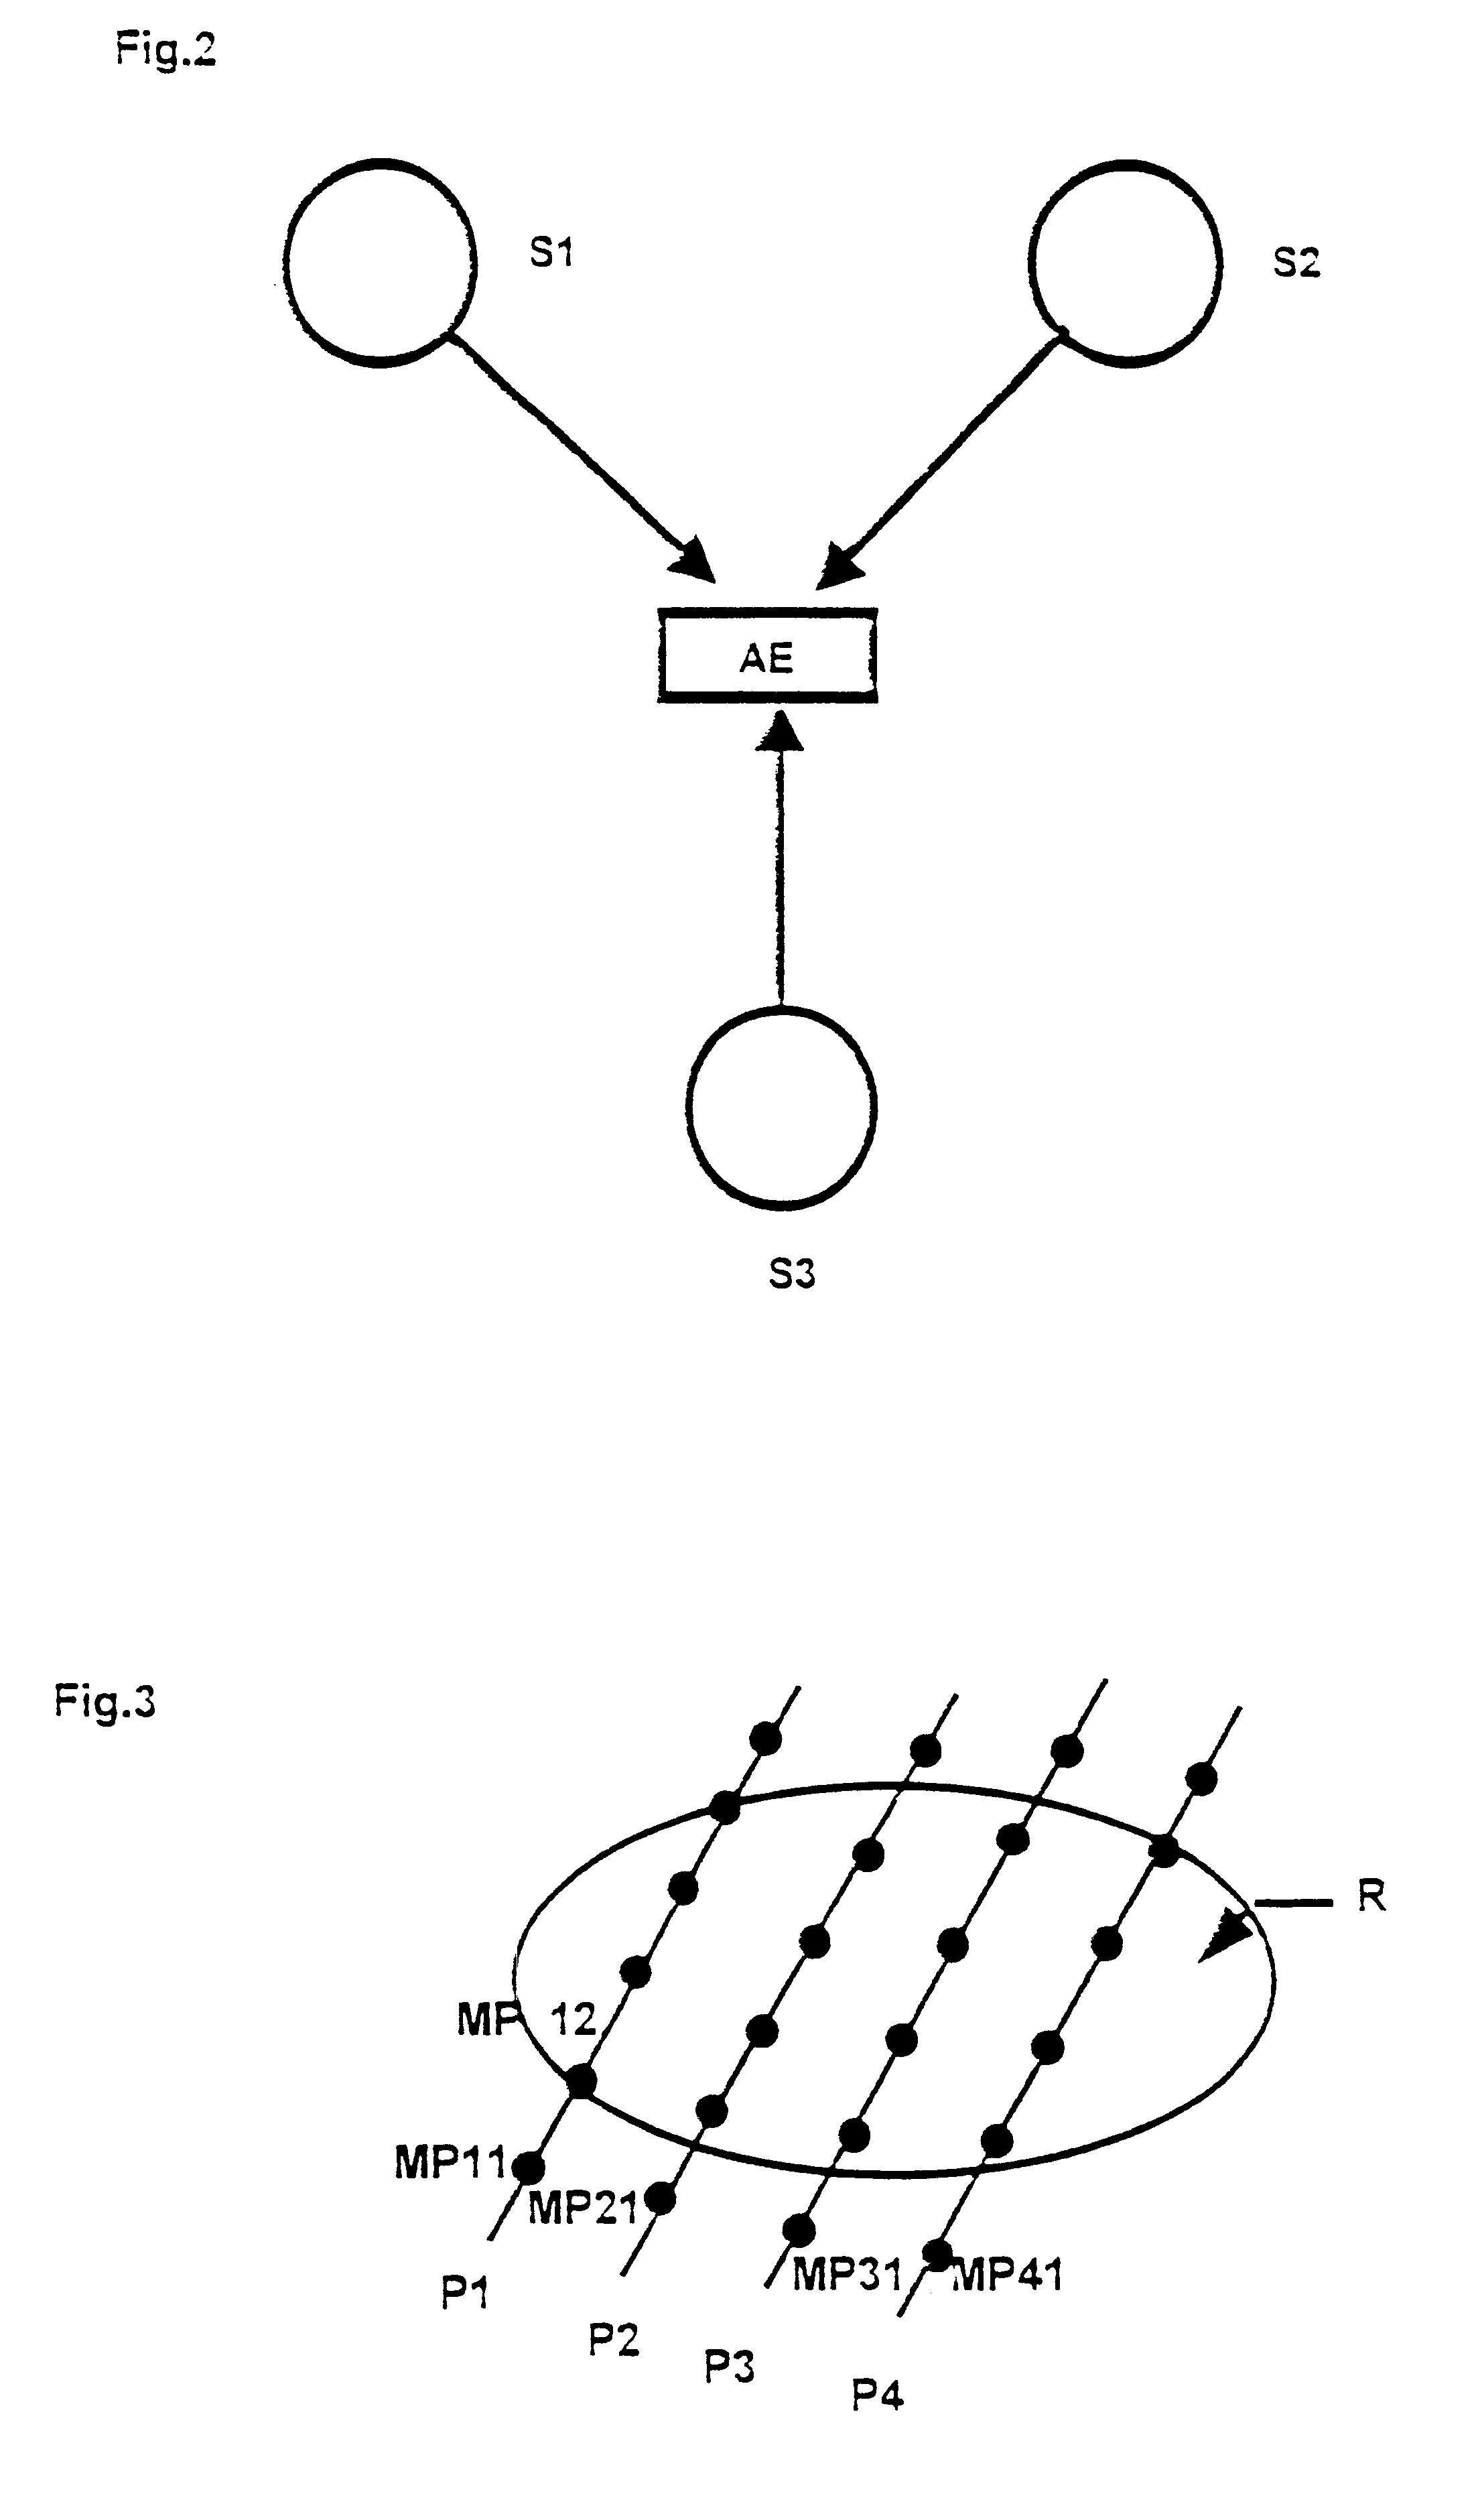
Phase 1: The measuring data are picked up by the sensors S1, S2, S3 by means of the arrangement shown in FIG. 2, and are recorded as digital information in the recorder AE. Recording takes place simultaneously for all sensors S1, S2, S3 and is separated into the components x, y, z.

The recording time is on the order of several minutes for each individual measurement.

In accordance with FIG. 3, the measurements take place at the measuring points Mij along the profiles Pi.

Phase 2: Following processing in a correlation filter (PF), the measured data or primary data are subjected to a frequency analysis (FT), and following the comparison of phase, frequency and amplitude (PFA), the frequency and amplitude values are determined from the correlated data and transferred to the appropriate windows, the hydrocarbon window (HCF) and the water window (WF).

Phase 3: A reservoir profile is produced from the received data, and the course of the amplitude ratio of the maxima from the separate frequen...


PUM


Abstract

A method for detecting and identifying a type and geometric dimensions of hydrocarbon deposits and other underground fluid deposits. Sensors are used to measure anomalies caused by a deposit in a natural earth frequency spectrum. Different frequencies are filtered out and analyzed, for respective deposits. Amplitudes of maxima are separately evaluated, corresponding to separately measured frequencies. Amplitude values of the maxima are placed into correlation with each other and measuring points are determined.

Description

1. Field of the InventionThis invention relates to a method for detecting and for identifying the type and the geometric dimensions of hydrocarbon deposits and other underground fluid deposits.2. Description of Prior ArtVarious, mostly incomplete methods, which partially complement each other, are known for finding deposits of raw materials and deposits having other anomalies in the crust of the earth. Historically, the detection of such deposits, in particular oil and gas deposits, occurred by accident. This is also still the case to a large extent today and is extremely unsatisfactory. A system has been developed through the frequency of such discoveries which initially only referred to the geological structure of the earth and its development over time.Methods have been developed which are of a technical nature and make confirmation of hypotheses easier but which are not suitable to make definite statements regarding the existence of deposits and their geographic composition. Wit...

Claims


Application Information

Patent Timeline
Patent Type & Authority Patents(United States)
IPC IPC(8): G01V1/00
CPCG01V1/001
Inventor CHUTOV, GENNADIJ J.RODE, ERNST D.MORITZ, JUERGEN
Owner ADNR TECH SERVICES
Why Eureka
Eureka Blog
Learn More