Method, apparatus and product for evaluating test data

a technology of test data and apparatus, applied in the field of methods, apparatus and products for quality control, can solve the problems of difficult determining the contribution, not easy to determine the effect of confidence level, and not good candidates for sampling reduction or elimination

Inactive Publication Date: 2004-03-23
PDF SOLUTIONS INC
View PDF3 Cites 35 Cited by
  • Summary
  • Abstract
  • Description
  • Claims
  • Application Information

AI Technical Summary

Problems solved by technology
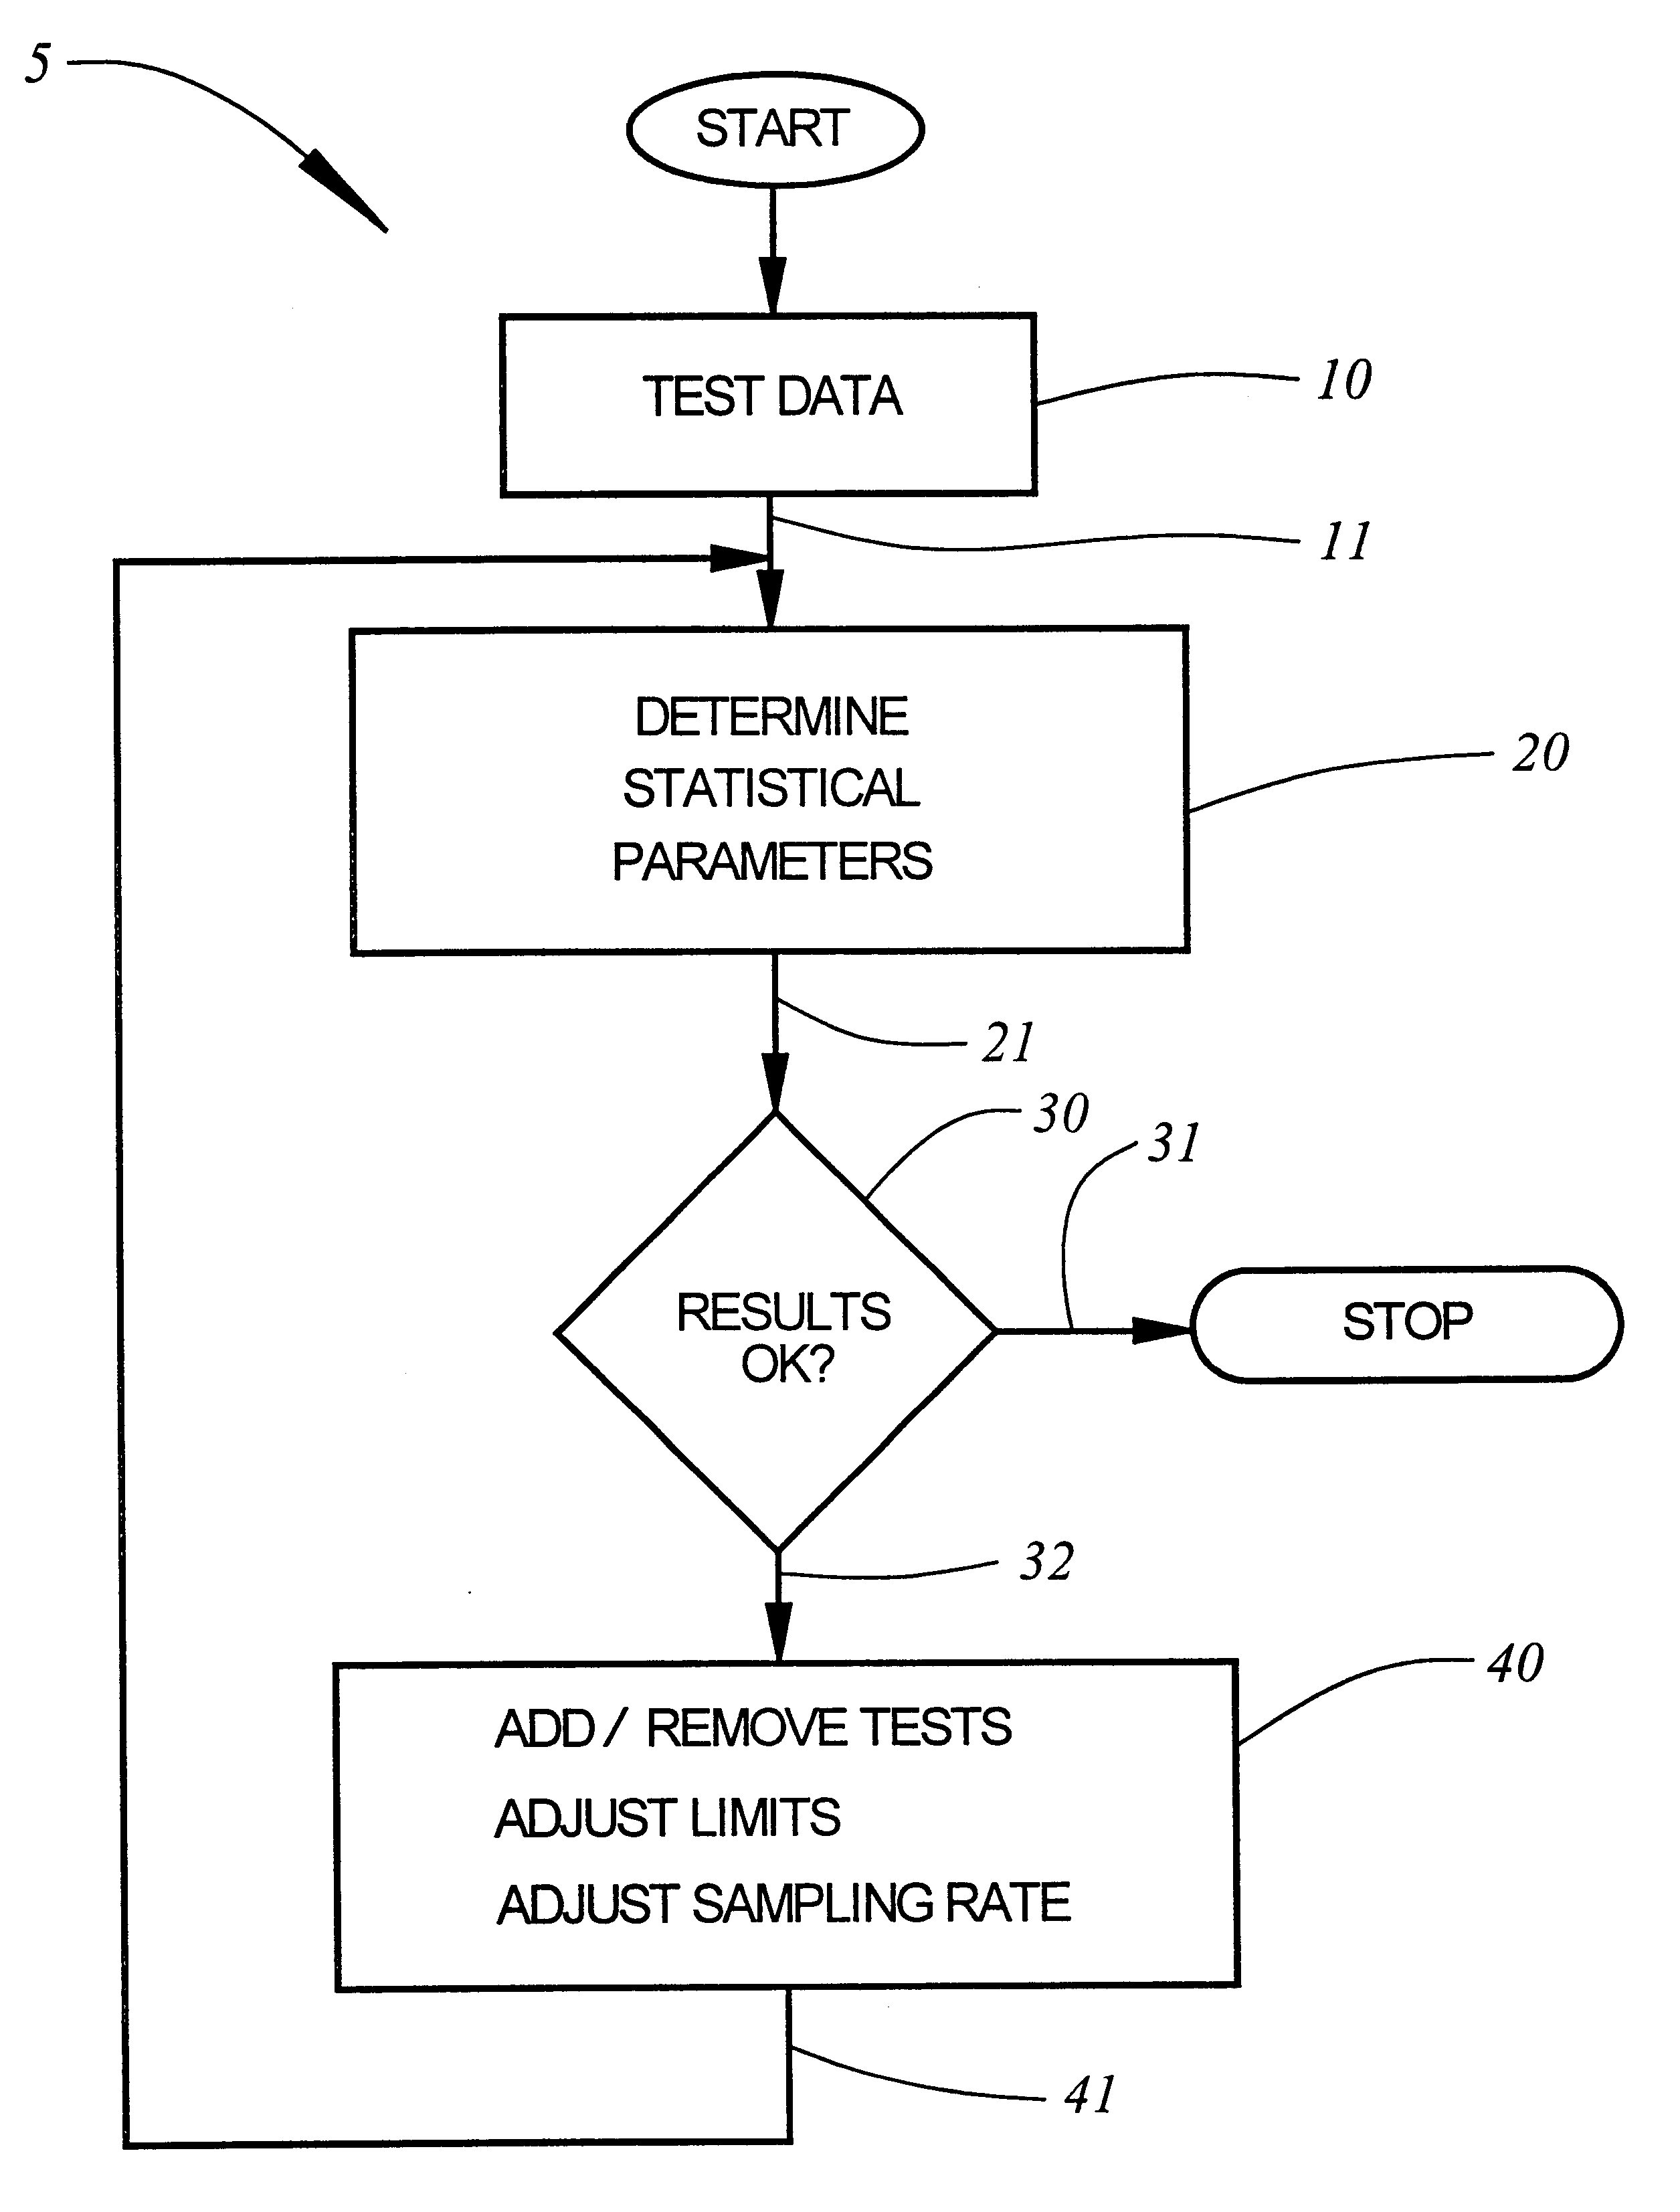
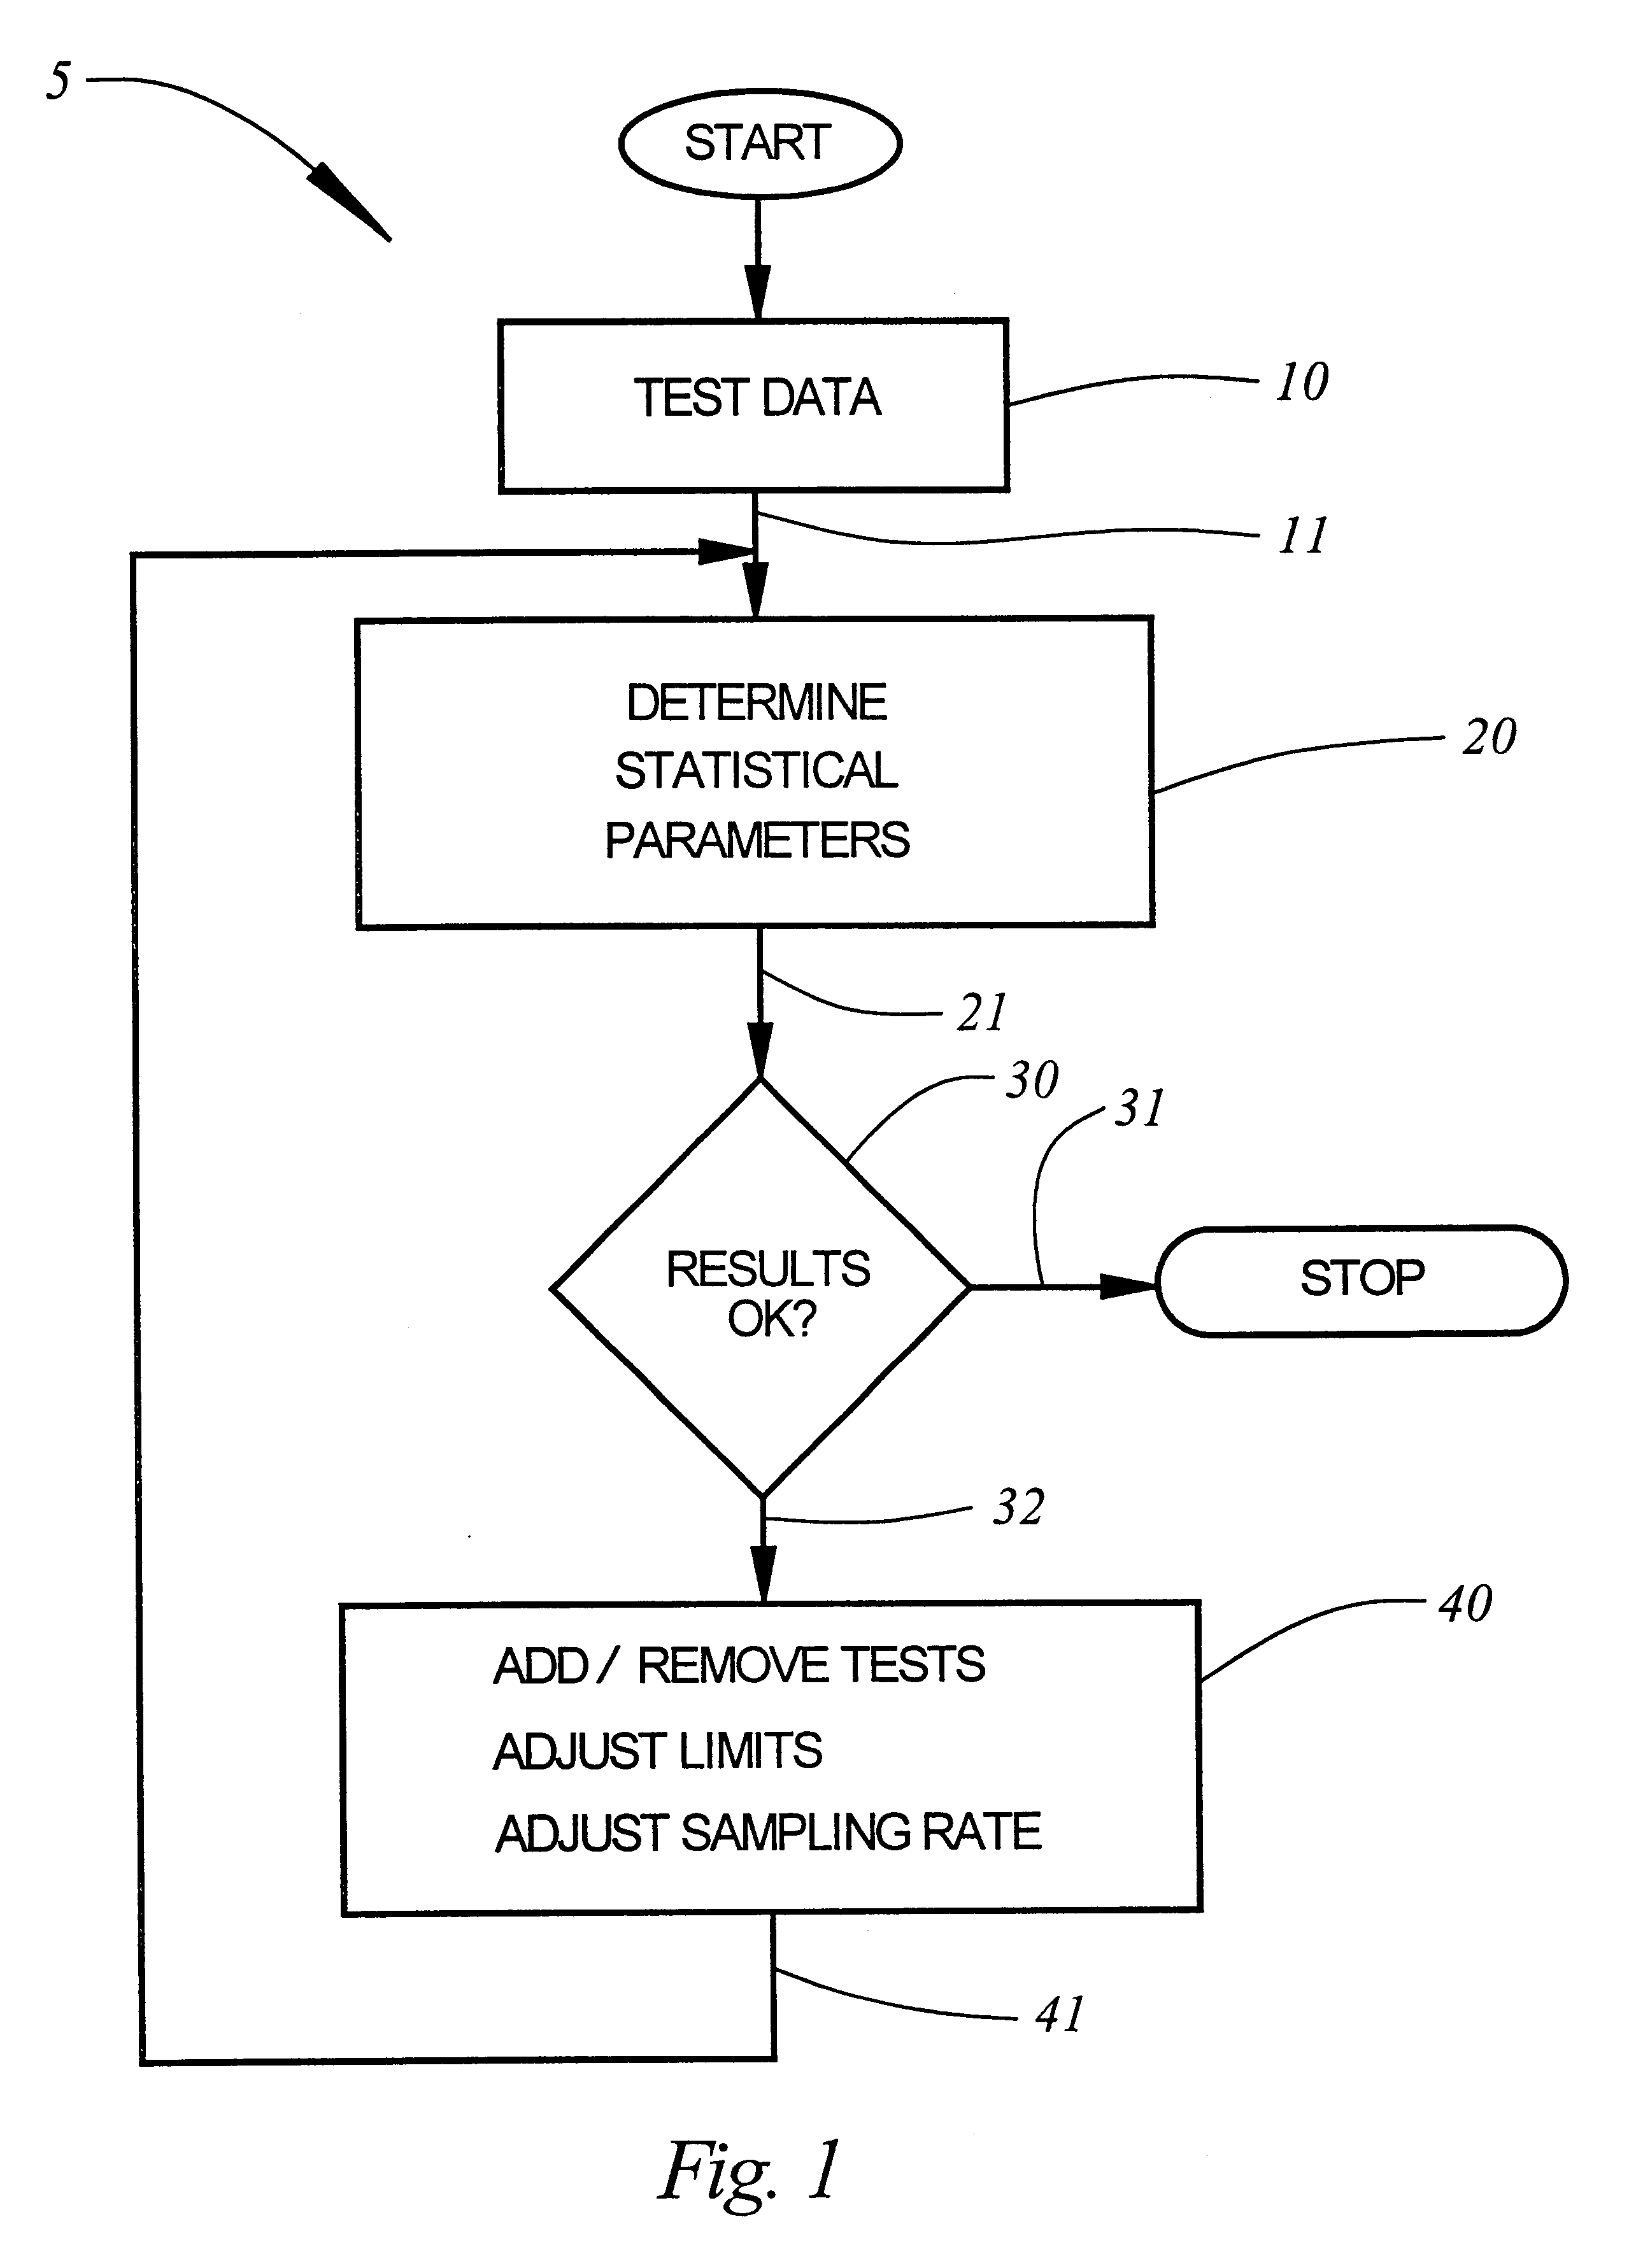
As it is generally impractical to test each and every component or good, resort is made to statistical sampling.
Additionally, while the level of confidence may also be effected by conducting more or fewer quality control tests, the effect on the level of confidence is not so easily determined, as each test contributes differently to the confidence level, and determining that contribution is difficult.
However, merely because a test finds the fewest number of failures, doesn't necessarily mean that it may be eliminated.
Tests that have large heights (more than half the distance between 0 and 1) or are close to 0 or are close to 1, are not good candidates for sampling reduction or elimination, and perhaps need to be sampled at a greater sampling rate or need adjustment to some other parameter like the limits.
If the test is absolutely necessary to check the functionality of the tested object, then it is not a good candidate for sampling rate reduction or elimination.
It is recognized that where there are a number of tests, manually changing the sampling rate could be tedious.

Method used


Image

  • Method, apparatus and product for evaluating test data
  • Method, apparatus and product for evaluating test data
  • Method, apparatus and product for evaluating test data

Examples


Embodiment Construction

The following example is provided merely to illustrate one embodiment of the present invention, and this example does not limit the scope of the claims of the invention.

Description of the Data

There are a total of 200 samples that represent a series of 10 tests on 20 integrated circuits. Each test result represents a parametric measurement of current, frequency, voltage, or resistance.

For sake of illustration, this Example represents 20 devices sampled from a total of 200 or a 10% sampling, and included a selected number of 10 tests.

Because the STDF file used in this example is binary format and is generally unreadable as text, FIG. 7 is a spreadsheet showing the raw data after conversion form the STDF file in the method of the present invention. The raw data is listed by device number 1-20 across the rows of the spreadsheet, and the results of each of the 10 tests are listed down the columns. The header information is at the top of the spreadsheet and represents the test description...


PUM

PropertyMeasurementUnit
Riaaaaaaaaaa
sizeaaaaaaaaaa
RAaaaaaaaaaa

Abstract

Method, apparatus and product for analyzing a quality control regimen comprising one or more quality control tests, to determine if the tests are in statistical control, and therefore could be removed from the regimen or sampled at a different rate. On sample data relating to each of the tests, there is determined Cpi, a measure of the spread of the data, which is simply the ratio of the magnitude of the actual range of the data, to the magnitude of calculated statistical range of the data. There is also determined CPKi, which is a measure of how close the spread of the data is to the upper or lower limit of the data. For convenience, the magnitude of Cpi is represented as a vertical bar graph, with the value of CPKi shown as a position of the bar graph within normalized limits. Using Cpi and CPKi decisions regarding removal of each the test can be made. One or more tests are then selected for removal or to have a different sampling rate, and "What If" scenarios then performed to see how the testing regimen would have performed without the test(s) or at the different sampling rate.

Description

1. Field of the InventionThe present invention relates to methods, apparatus and products for quality control. In another aspect, the present invention relates to methods, apparatus and products for analyzing a quality control regimen. In even another aspect, the present invention relates to methods, apparatus and products for analyzing a quality control regimen comprising one or more quality control tests and determining which tests can be eliminated from the regimen or sampled at a different rate. In still another aspect, the present invention relates to methods, apparatus, and products for analyzing a quality control regimen comprising one or more quality control tests, determining which tests can be eliminated from the regimen or sampled differently, and then conducting "what if" scenarios on the data absent the eliminated tests or at the different sampling rate.2. Description of the Related ArtStatistical sampling is generally employed where there is a concern with quality cont...

Claims


Application Information

Patent Timeline
Patent Type & Authority Patents(United States)
IPC IPC(8): G01N37/00G06F17/00G06F17/18G06F19/00G06Q10/06
CPCG06Q10/06
Inventor BIBBEE, JEFFREY N.
Owner PDF SOLUTIONS INC
Why Eureka
Try Eureka