Methods and systems for energy and emissions monitoring

a technology of energy and emissions monitoring and methods, applied in the field of air quality management, can solve the problems of consuming energy, generating emissions, burning of boilers, furnaces, etc., and achieve the effect of easy dissemination

Inactive Publication Date: 2004-05-04
GENERAL ELECTRIC CO
View PDF6 Cites 266 Cited by
  • Summary
  • Abstract
  • Description
  • Claims
  • Application Information

AI Technical Summary

Benefits of technology

FIG. 3 is a block diagram describing one embodiment of the Emissions Monitoring Module 20. The Emissions Monitoring Module 20 acquires information from the communications network (shown as reference numeral 48 in FIG. 2) and uses this information to track, predict, and model emissions outputs from multiple sources. As FIG. 3 illustrates, the Emissions Monitoring Module 20 acquires energy usage information 66 and emissions information 68 and stores this information in a database 70. The energy usage information 66 may include, yet is not limited to, electrical power usage, natural gas usage, fuel oil usage, coal usage, and gasoline usage. The emissions information 68 may include, yet is not limited to, nitrogen oxides (NO.sub.X), carbon monoxide (CO), carbon dioxide (CO.sub.2) methane (CH.sub.4), nitrous oxide (N.sub.2 O), sulfur dioxide (SO.sub.2), volatile organic compounds, and particulate matter. The Emissions Monitoring Module 20 could also acquire other plant variables, such as plant productivity and operating variables. The Emissions Monitoring Module 20 acquires this information from multiple emissions sources, and this information is used to predict and to model emissions outputs from those multiple sources in a complex industrial process. The Emissions Monitoring Module 20 thus supplies emissions profiles that help plant operators understand emissions releases. The Emissions Monitoring Module 20 also provides real time data, or near-real time data, that allows plant operators to adjust modes of operation, to review compliance levels, and to trade emissions credits on-line.
The Emissions Monitoring Module 20 may also report emissions data to governmental regulatory agencies. As FIG. 3 shows, the Emissions Monitoring Module 20 may communicate the acquired information to a regulatory agency. The Emissions Monitoring Module 20 could thus format the acquired energy usage information 66 and the emissions information 68 to the reporting requirements of, for example, the Environmental Protection Agency. The Environmental Protection Agency requires the reporting of SO.sub.X, NO.sub.X, and other pollutants to fulfill air permitting needs. See 42 U.S.C.A. .sctn.7651(k) (West 1995 & Supp. 2000). Europe, too, requires industrial reductions in emissions. The Emissions Monitoring Module 20 may communicate formatted energy usage data 72, and formatted emissions data 74, along the communications network, in real-time and on-line, to a regulatory agency 76. The Emissions Monitoring Module 20 may even accept manually-entered data 78 from plant operators, engineers, and others with access to the database 70. The Emissions Monitoring Module 20 thus reduces, and could even eliminate, the need for plant personnel to monitor and to report emissions outputs information.
The Emissions Monitoring Module 20 also improves energy and emissions management programs. Because multiple emissions sources can be tracked, the Emissions Monitoring Module 20 allows engineers to monitor and to characterize variations in energy usage and emissions between different operations and between different plants. The Emissions Monitoring Module 20 thus helps identify and share the best energy and emissions practices. Because the Emissions Monitoring Module 20 provides a real-time measurement of energy usage, or a near-real-time measurement, dispersed plant locations can easily leverage aggregate purchases of energy requirements. Even diverse industries can band together and make aggregate, on-line purchases of their energy requirements. The Emissions Monitoring Module 20 also provides actual energy data for utility rate negotiations and actual emissions data for air quality programs. The Emissions Monitoring Module 20, in addition, allows plant operators to forecast emissions based upon production targets. Because the Emissions Monitoring Module 20 maintains a database of energy usage and emissions data, this data can be correlated to production measurements. Plant operators can thus forecast future energy requirements and emissions based upon past data and production goals. Plant operators may thus optimize production to keep the plant in compliance.
The Emissions Monitoring Module 20 may be physically embodied on or in a computer-readable medium. This computer-readable medium may be CD-ROM, DVD, tape, cassette, floppy disk, memory card, and a large-capacity disk (such as IOMEGA.RTM. ZIP.RTM., JAZZ.RTM., and other large-capacity memory products) (IOMEGA.RTM., ZIP.RTM., and JAZZ.RTM. are registered trademarks of Iomega Corporation, 1821 W. Iomega Way, Roy, Utah 84067, 801.332.1000, www.iomega.com). This computer-readable medium, or media, could be distributed to end-users, licensees, and assignees. These types of computer readable media, and other types not mentioned here but considered within the scope of the present invention, allow the Emissions Monitoring Module 20 to be easily disseminated. A computer program product for tracking, monitoring, and reporting energy usage and emissions comprises a computer-readable medium and the Emissions Monitoring Module. The Emissions Monitoring Module is stored on the medium, and the Emissions Monitoring Module couples to energy usage monitors and to emissions monitors over a communication network. The Emissions Monitoring Module acquires at least one of energy usage information associated with sources of emissions and emissions information associated with sources of emissions.

Problems solved by technology

Boilers, furnaces, generators, and engines, for example, consume energy and produce emissions.

Method used


Image

  • Methods and systems for energy and emissions monitoring
  • Methods and systems for energy and emissions monitoring
  • Methods and systems for energy and emissions monitoring

Examples


Embodiment Construction

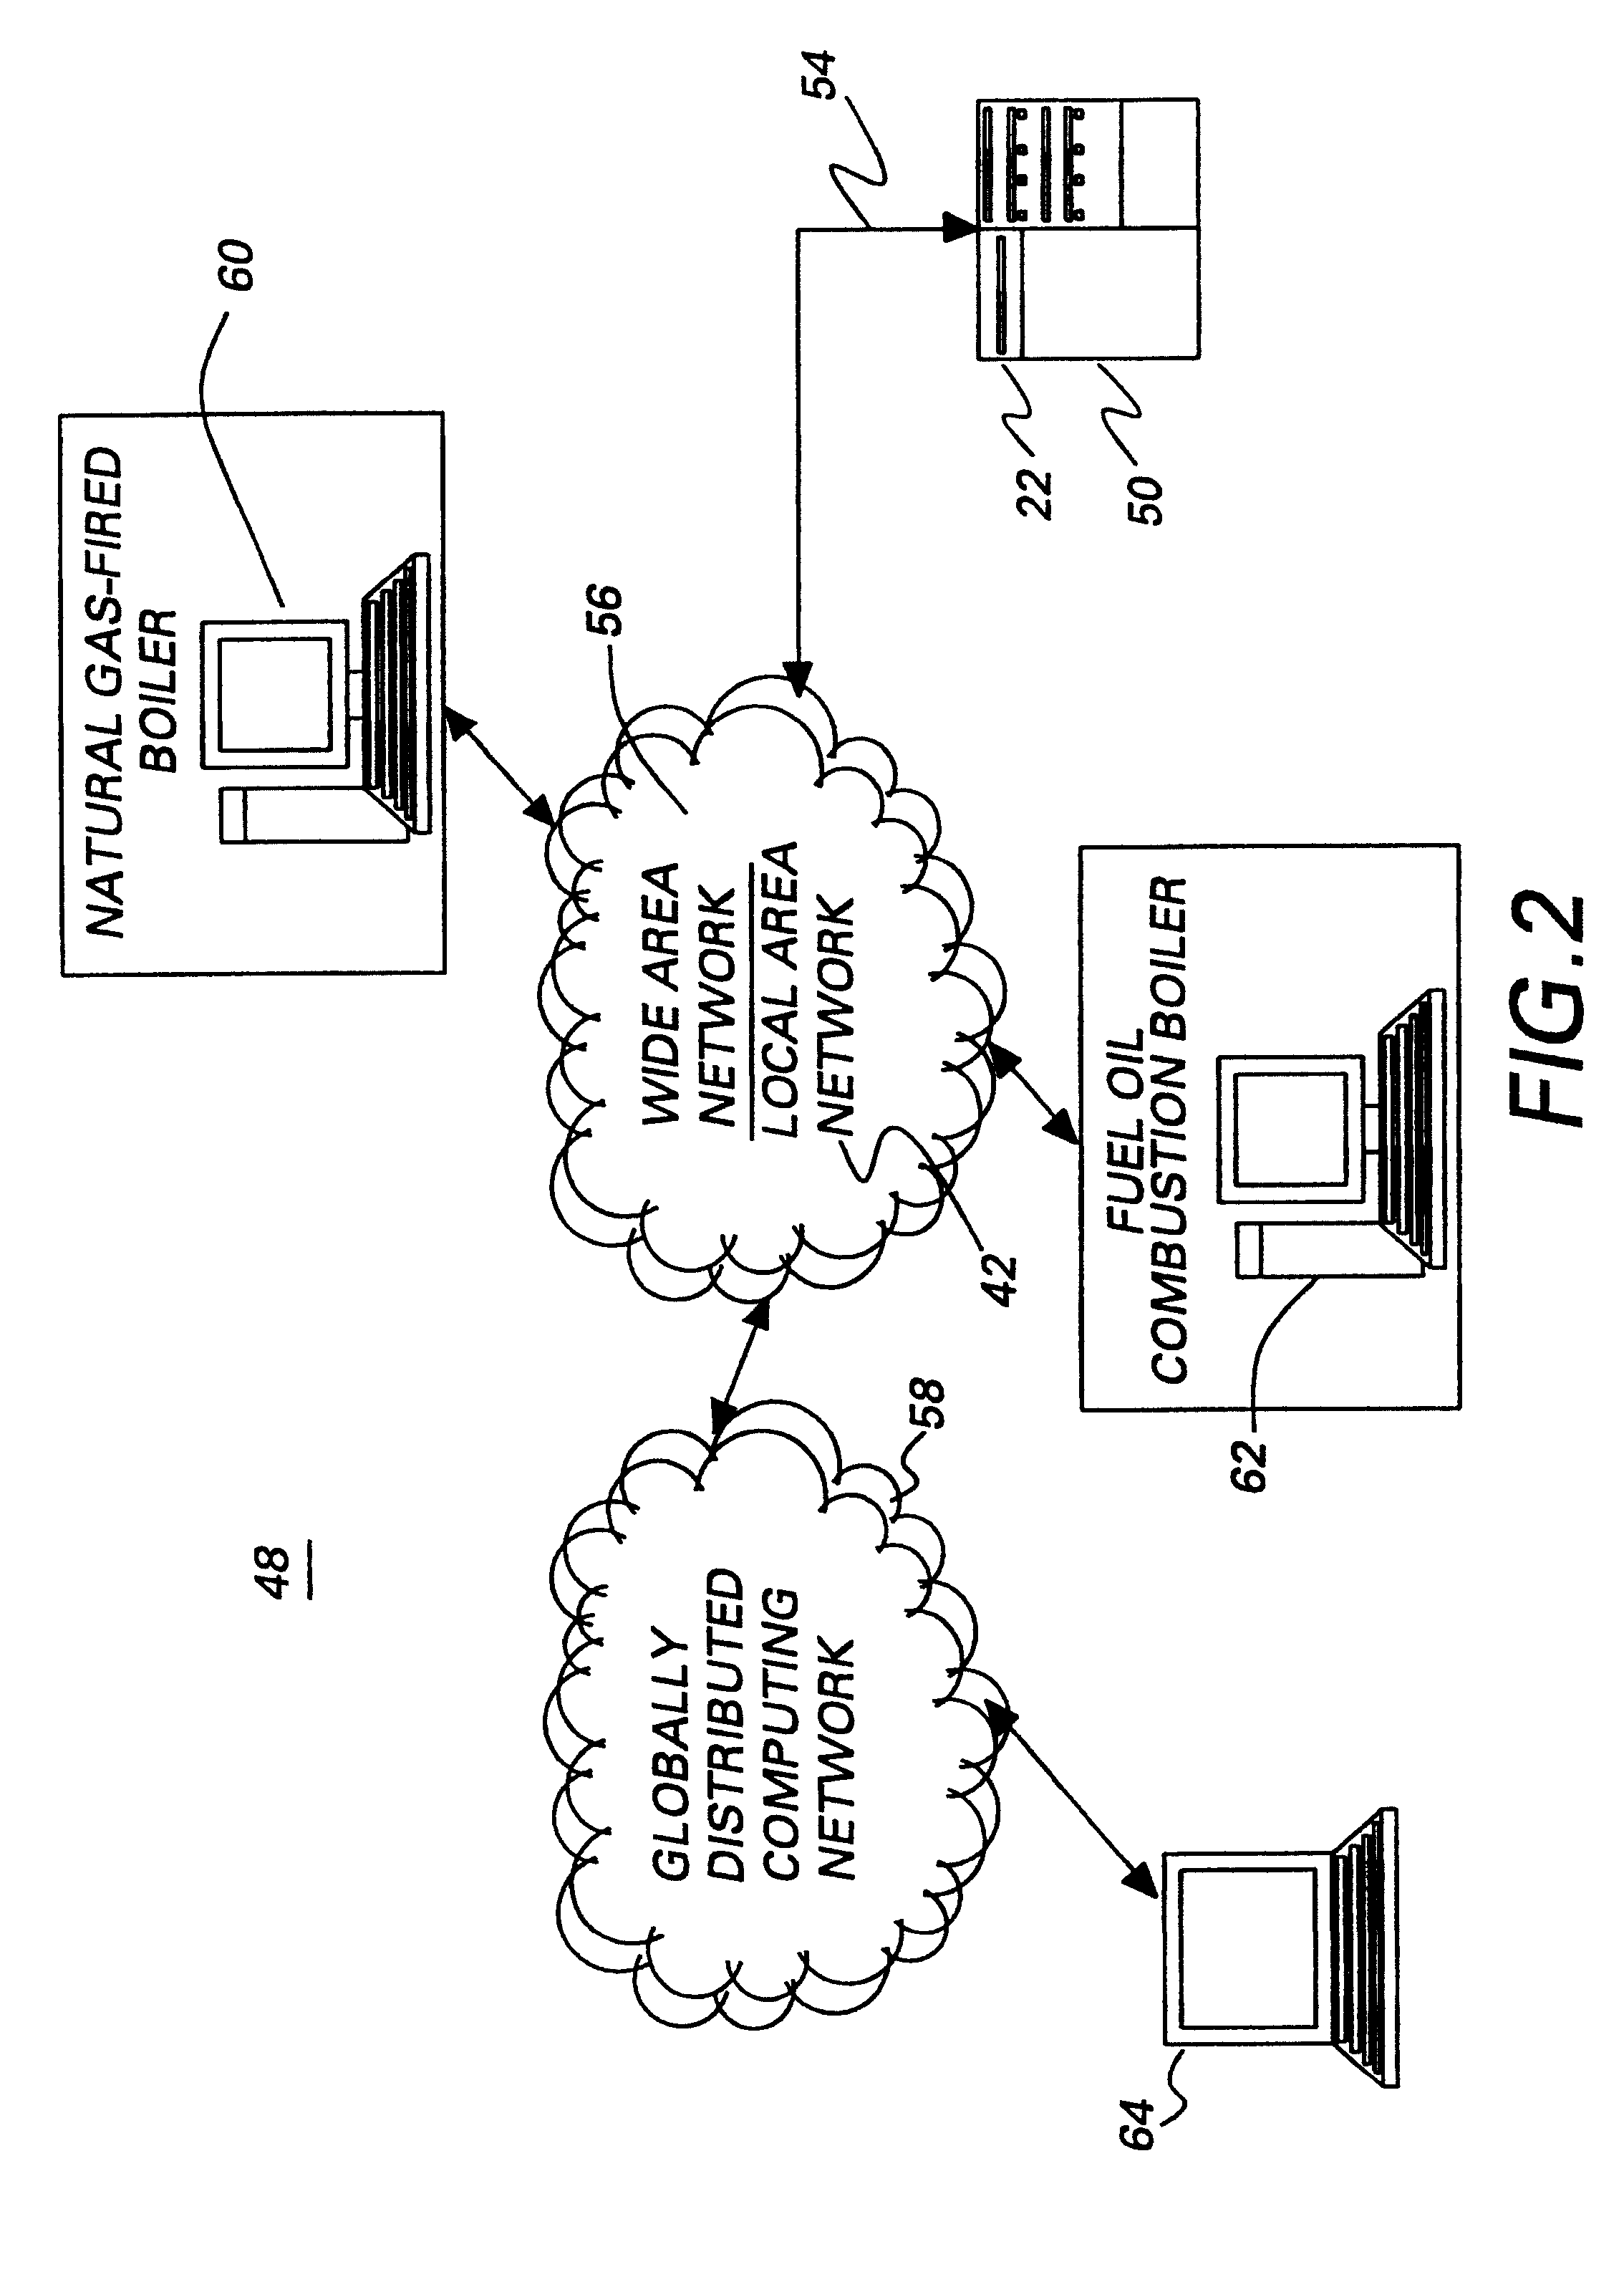
The Emissions Monitoring Module 20 is further illustrated by the following non-limiting example. This non-limiting example reflects a prototype industrial demonstration. The Emissions Monitoring Module 20 monitors natural gas (NG) usage, and production measurements were taken, so all information was known in order to track and to predict very conservative estimates of actual emissions. As those of ordinary skill in the art understand, emissions permits sometimes allow the use of mathematical models for predicting emissions based upon energy usage. The transfer functions for NO.sub.X, SO.sub.X, and CO.sub.2, as a function of natural gas (NG) usage, are below: ##EQU1##

Here the local permit assumes NO.sub.X from Machine "A" and from Recuperator "A" are constant. NO.sub.X from other NG applications can be fitted to a simple expression. ##EQU2##

where the constants C.sub.1, C.sub.2, . . . C.sub.7 approximate sources of emissions that are independent of natural gas usage. In this example, ...


PUM

PropertyMeasurementUnit
energy usageaaaaaaaaaa
energyaaaaaaaaaa
real timeaaaaaaaaaa

Abstract

Methods, systems, and processes are disclosed for determining emissions outputs. One method communicates with a communications network and acquires at least one of energy usage information associated with sources of emissions and emissions information associated with sources of emissions. The energy usage information and the emissions information is acquired as each occurs in real time. The method reports emissions outputs based upon the acquired real time information. Another method communicates with a communications network and acquires at least one of energy usage information associated with sources of emissions and emissions information associated with sources of emissions. This embodiment stores the acquired information as each occurs in real time. Emissions outputs are reported for the industrial process, the emissions outputs based upon the acquired real time information.

Description

BACKGROUND OF INVENTIONThis invention generally relates to air quality management and, more particularly, to methods and systems for monitoring and predicting emissions outputs from emissions sources.The United States Congress requires reductions in annual emissions of sulfur dioxide and nitrogen oxides. See Clean Air Act (Title IV, Acid Rain Program) .sctn.401, 42 U.S.C.A. .sctn.7651 (West 1995 & Supp. 2000). Congress requires that any operator of an emissions source, subject to the laws, must sample the emissions source and record sulfur dioxide and nitrogen oxide emissions. This record of sulfur dioxide and nitrogen oxide emissions must then be submitted to the United States Environmental Protection Agency.Sampling and reporting these emissions, however, can be a slow, cumbersome, and expensive task. Emissions monitoring equipment ("CEMS" for continuous emissions monitoring system), required by Congress, can cost up to about $200,000 per unit. One CEMS is often required for each ...

Claims


Application Information

Patent Timeline
Patent Type & Authority Patents(United States)
IPC IPC(8): G01N31/00G05B21/00G06F19/00H04Q9/00
CPCH04Q9/00
Inventor BAGEPALLI, SRINIVAS KRISHNASNAMYDEROSE, LYNN ANNHUNG, STEPHEN LAN-SUNKIM, BANG MOWIGHT, TARA HEALYSALVO, JOSEPH JAMES
Owner GENERAL ELECTRIC CO
Why Eureka
Try Eureka