
Removal of noise from seismic data using high resolution radon transformations

a technology of radon transformation and seismic data, applied in the field of processing seismic data, can solve the problems of increasing the odds of hitting an economically recoverable reserve, difficult to reach new reservoirs, and high drilling costs, and achieves the effects of enhancing the accuracy of many different seismic processing methods, accurate processing and filtering, and improving the accuracy of stacking velocity functions

Inactive Publication Date: 2006-01-17
JOHN M ROBINSON +1
View PDF16 Cites 24 Cited by
  • Summary
  • Abstract
  • Description
  • Claims
  • Application Information

AI Technical Summary

Benefits of technology

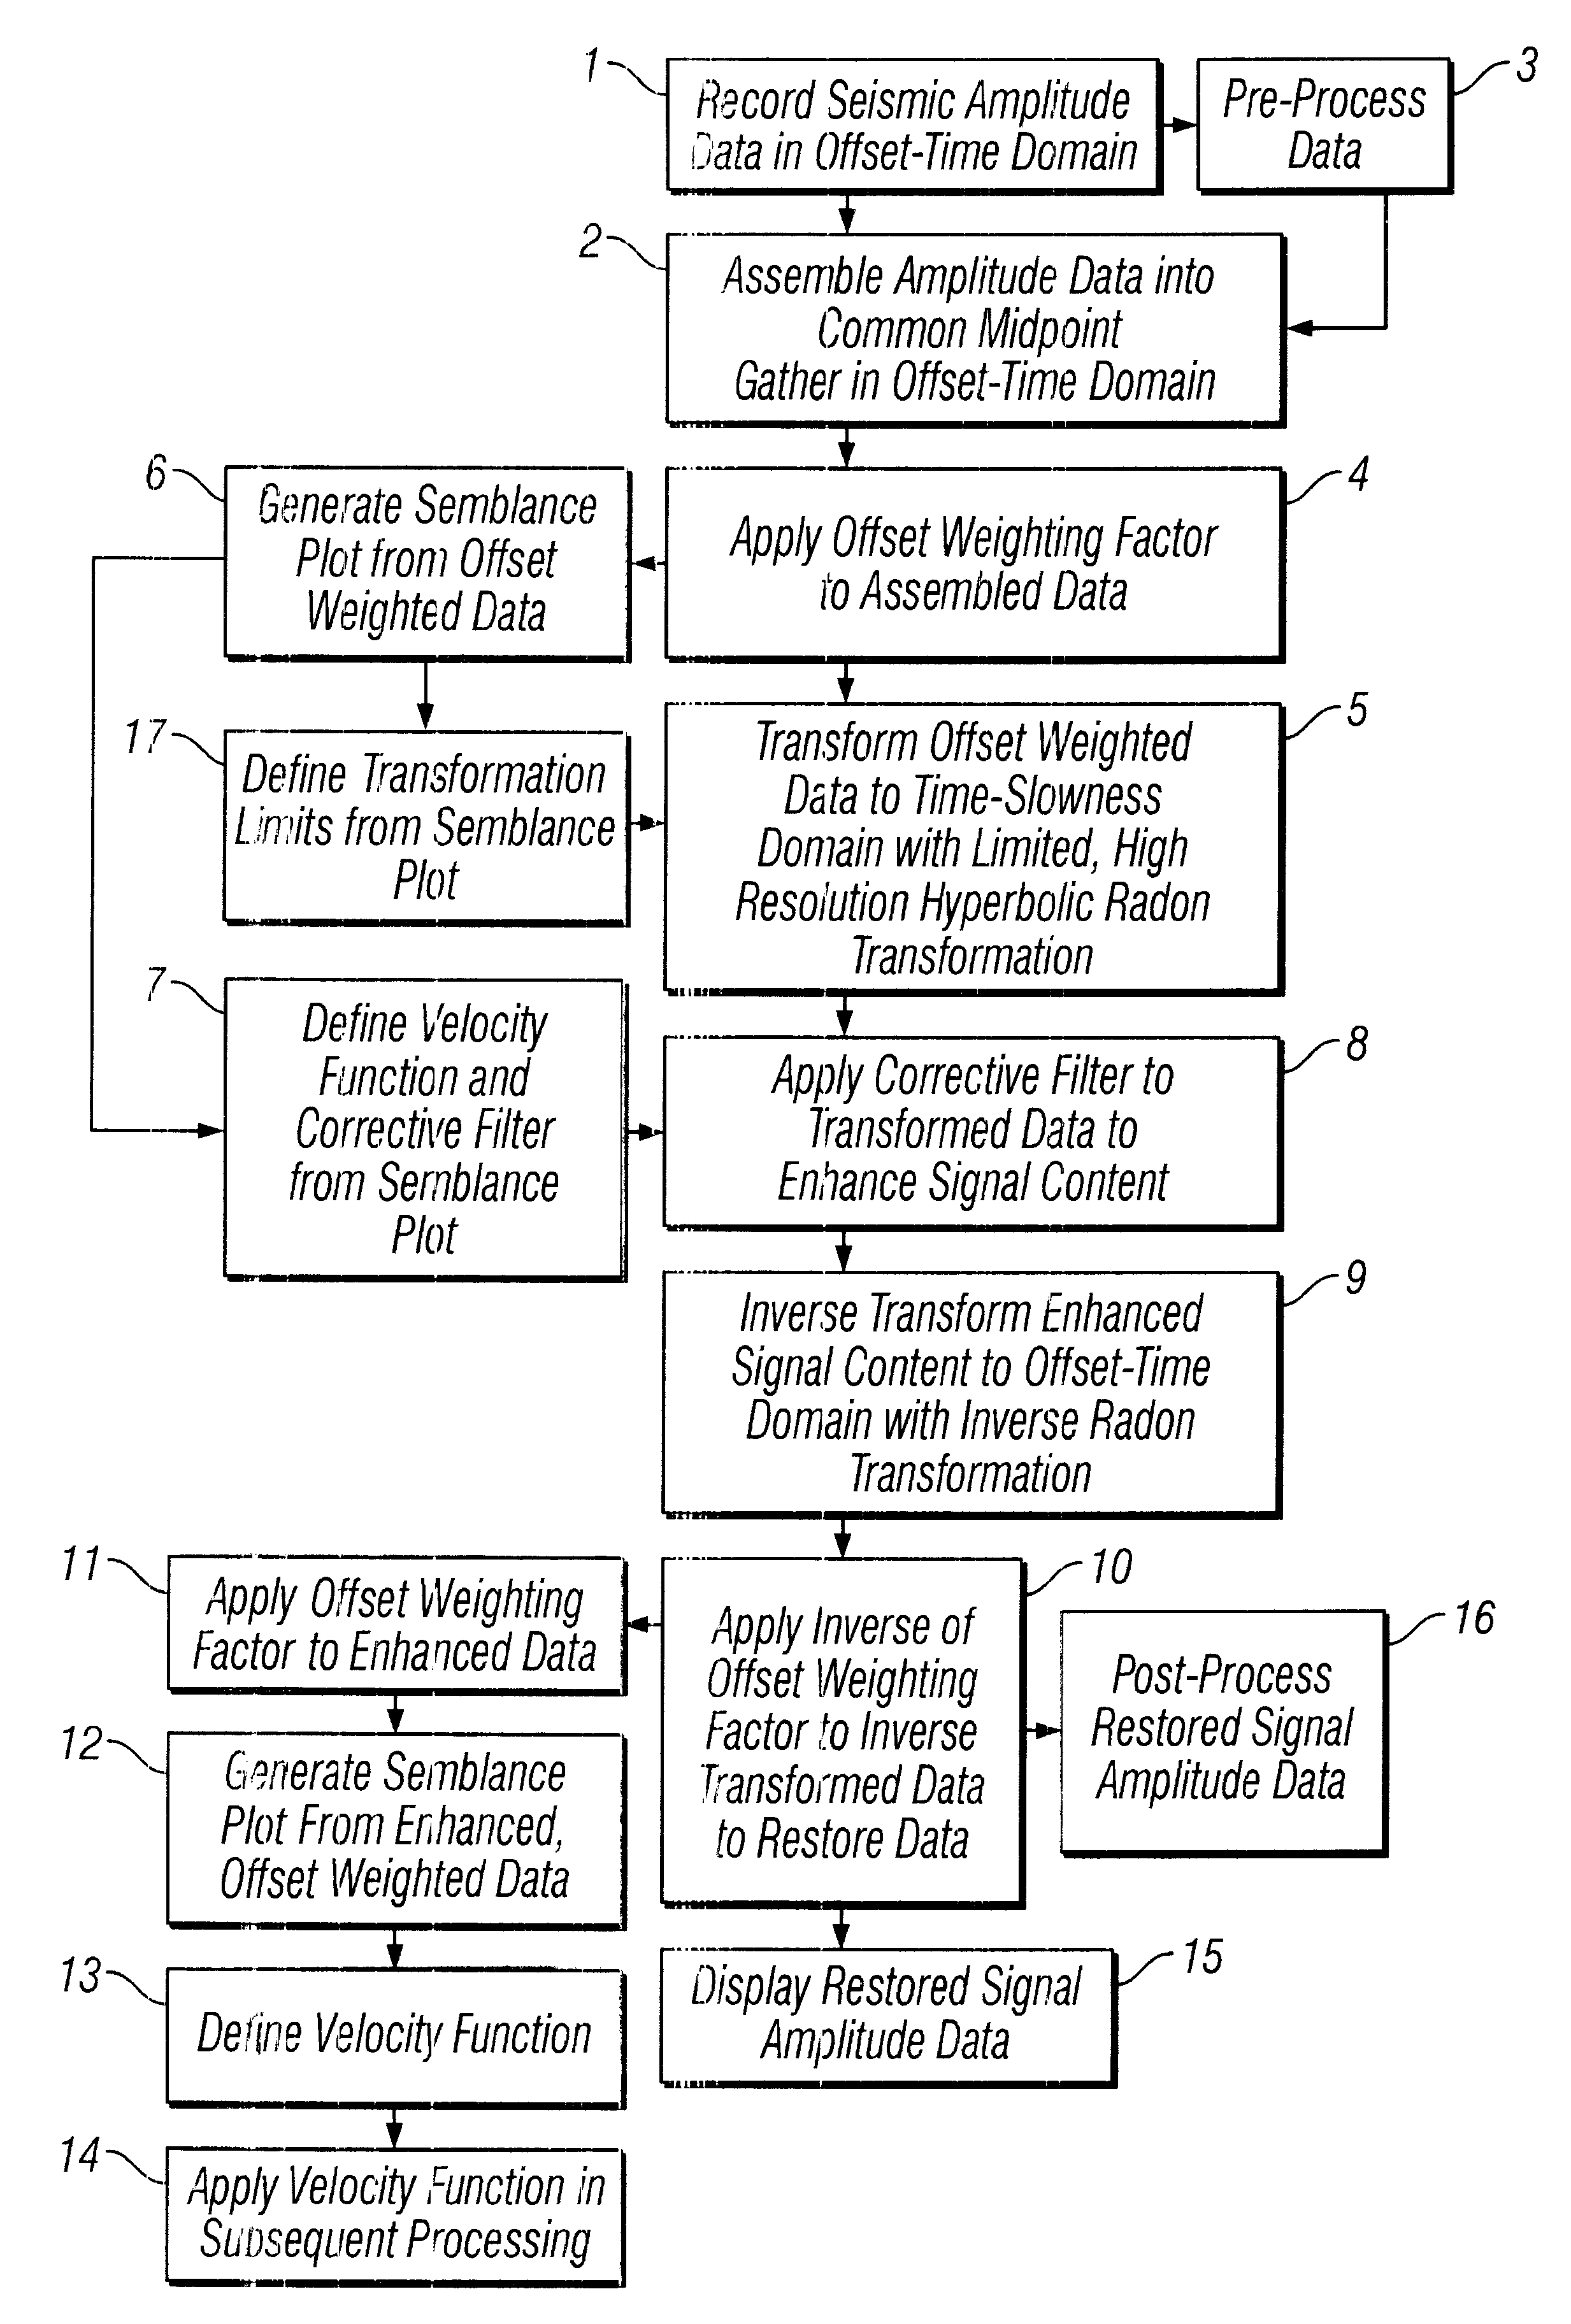
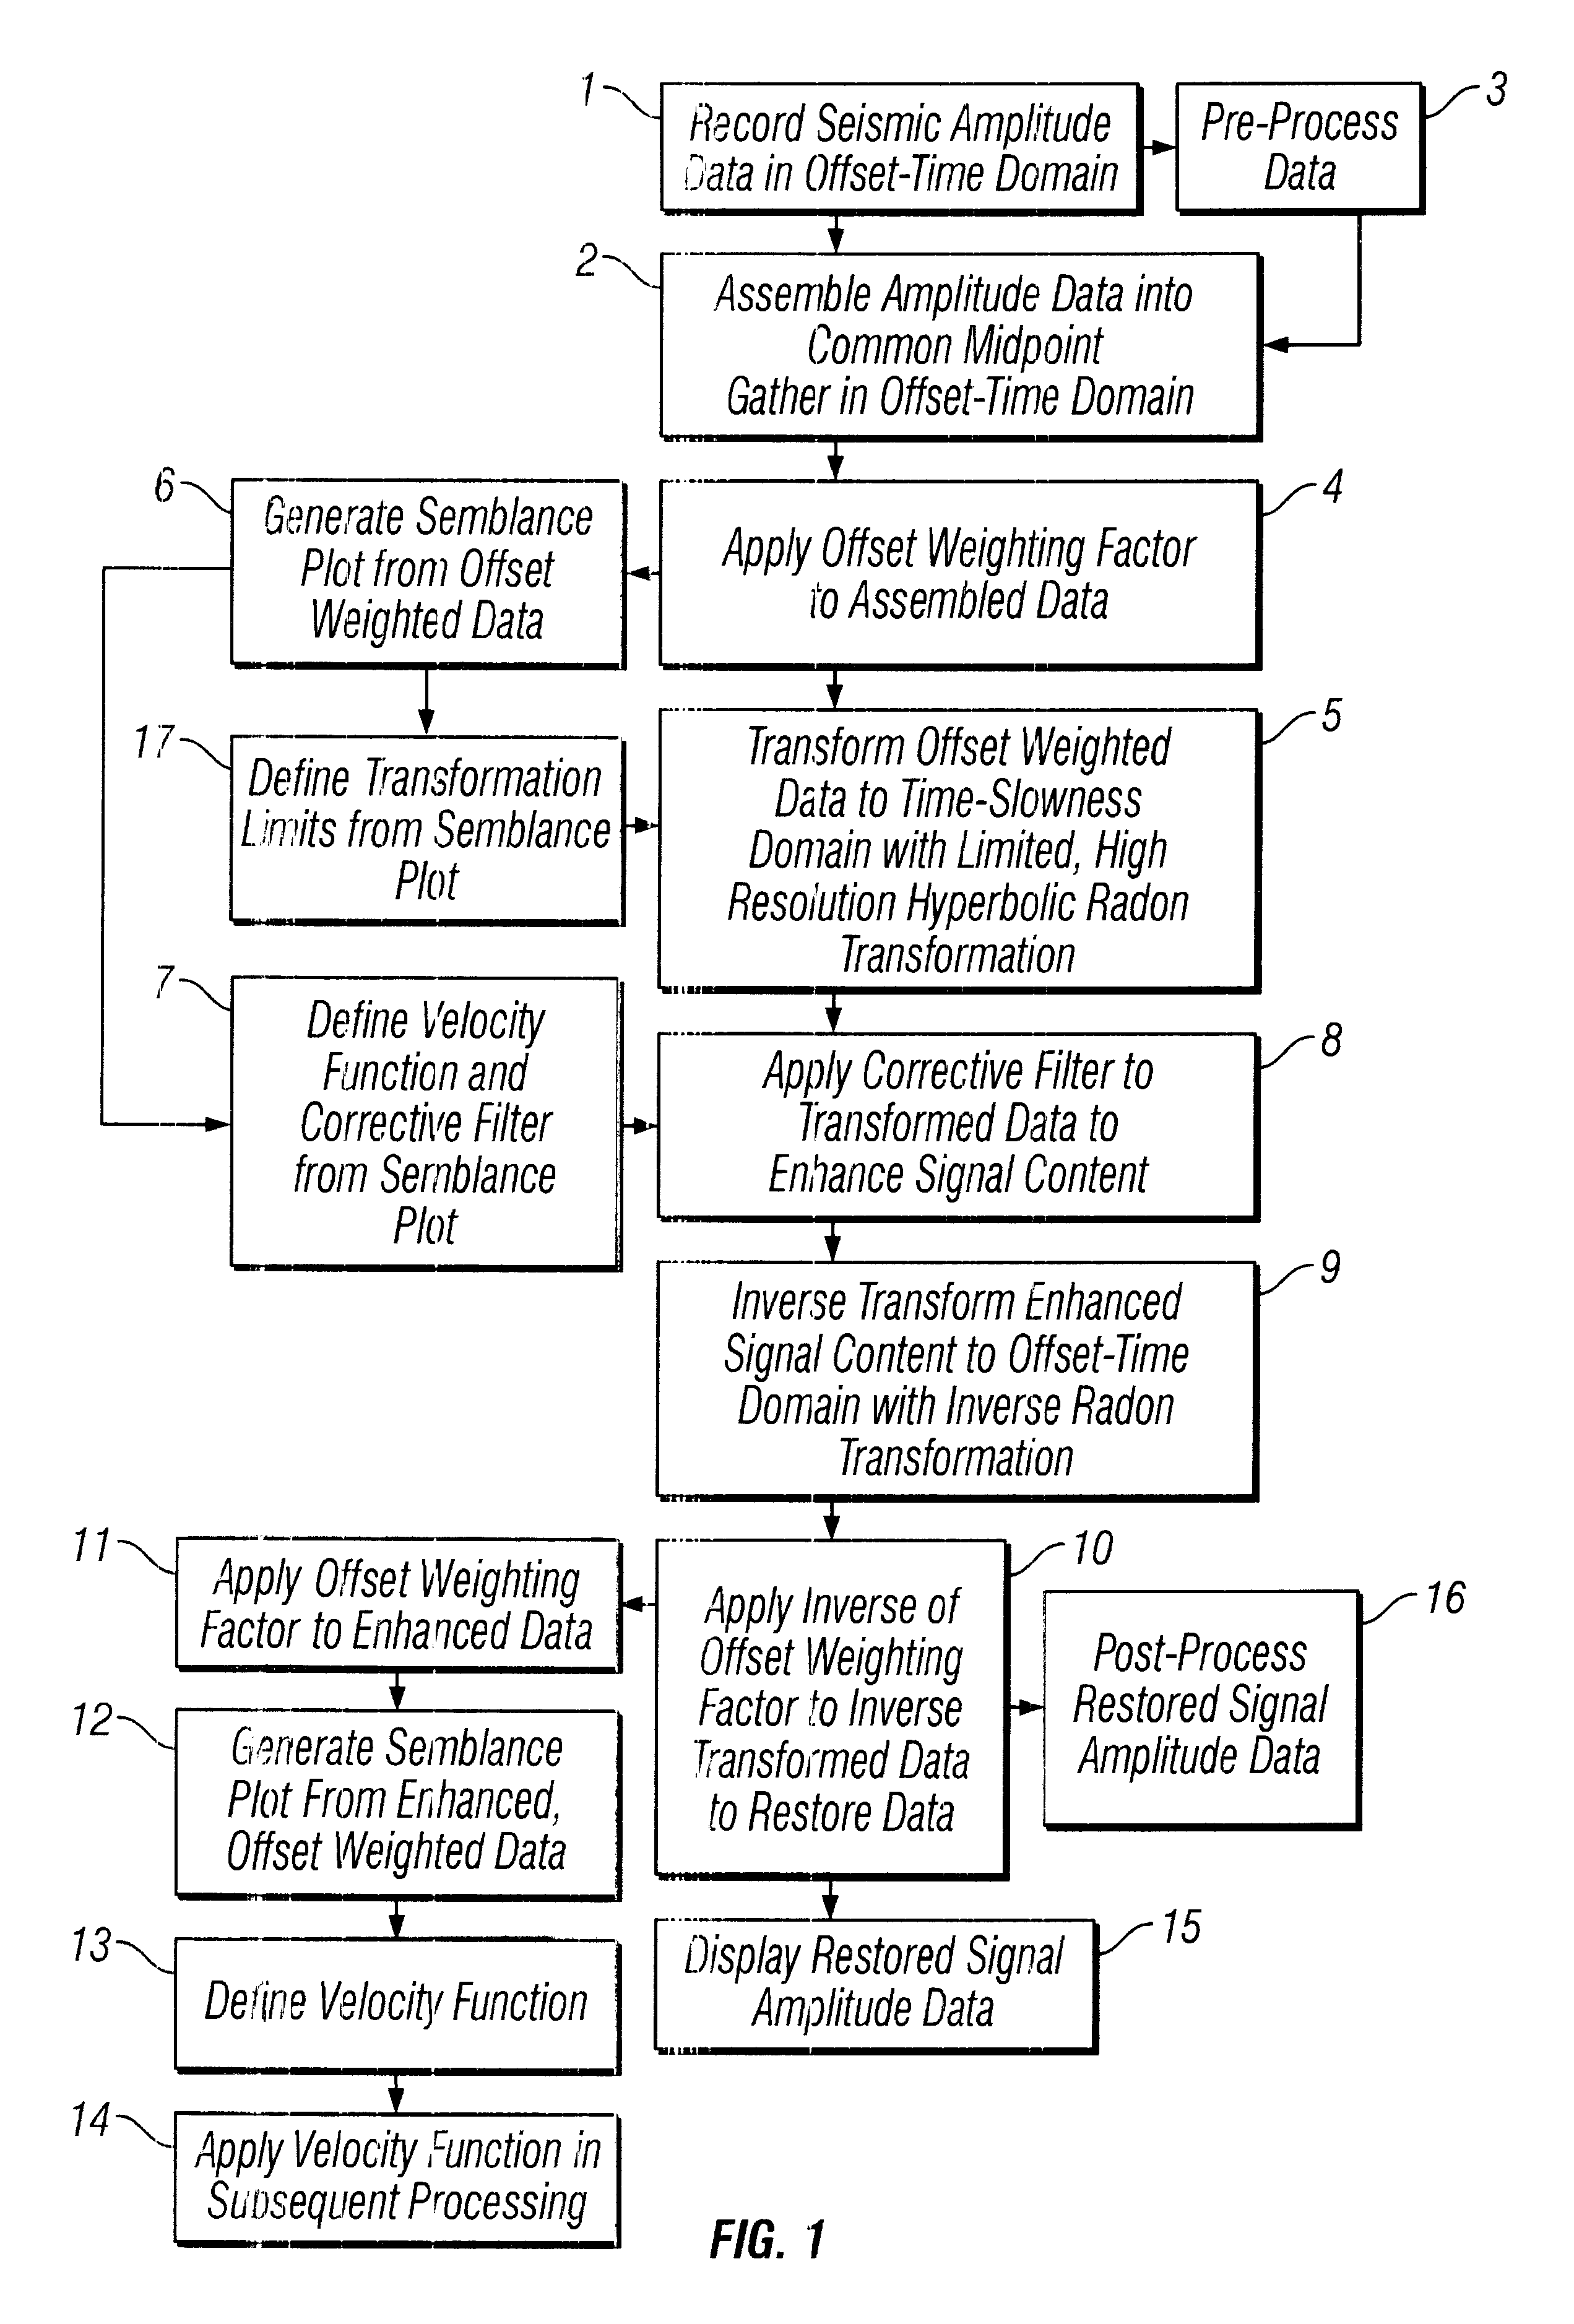
[0054]A corrective filter is then applied to the transformed data to enhance the primary reflection signal content of the data and to eliminate unwanted noise events. Preferably, the corrective filter is a time variant, high-low filter, and it determined by reference to the velocity function derived from performing a semblance analysis or a pre-stack time migration analysis on the amplitude data.
[0059]It will be appreciated that primarily because they utilize a high resolution Radon transformation, and avoid more complex mathematical operations required by prior art processes, the novel methods provide enhanced accuracy, yet require less total computation time and resources. Thus, even though hyperbolic Radon transformations heretofore have generally been avoided because of their greater complexity relative to linear slant stack and parabolic Radon transformations, the novel processes are able to more effectively utilize hyperbolic Radon transformations and take advantage of the greater accuracy they can provide, especially when applied to common midpoint geometry gathers.
[0061]It will be appreciated that, because the semblance and velocity analysis is performed on data that has been more accurately processed and filtered, that the resulting stacking velocity function is more accurate. This enhances the accuracy of the many different seismic processing methods that utilize stacking velocity functions. Ultimately, the increased accuracy and efficiency of the novel processes enhances the accuracy of surveying underground geological features and, therefore, the likelihood of accurately locating the presence of oil and gas deposits.

Problems solved by technology

Drilling is extremely expensive, and ever more so as easily tapped reservoirs are exhausted and new reservoirs are harder to reach.
Having an accurate picture of an area's subsurface features can increase the odds of hitting an economically recoverable reserve and decrease the odds of wasting money and effort on a nonproductive well.
A number of factors, however, make the practice of seismology and, especially, the interpretation of seismic data much more complicated than its basic principles.
First, the reflected signals that indicate the presence of geological strata typically are mixed with a variety of noise.
Other portions of the signal turn into noise as part of ground roll, refractions, and unresolvable scattered events.
Some noise, both random and coherent, is generated by natural and man-made events outside the control of the survey.
Thus, the noise and reflection signals tend to overlap when the survey data is displayed in X-T space.
The overlap can mask primary reflection signals and make it difficult or impossible to identify patterns in the display upon which inferences about subsurface geology may be drawn.
It will be appreciated, however, that in such prior art Radon filters, noise and multiple reflection signals recorded by receivers close to the gather reference point (“near trace multiples”) are not as effectively separated from the primary reflections.
Thus, the computational intensity of hyperbolic Radon transformations has in large part discouraged their use in seismic processing.
It has not been practical to accommodate the added complexity of hyperbolic Radon transformations because the computational requirements of conventional processes are already substantial.
Those calculations in general and, especially LMS analyses, are complex and require substantial computing time, even on advanced computer systems.
Moreover, a typical seismic survey may involve hundreds of sources and receivers, thus generating tremendous quantities of raw data.
Seismic processing by prior art Radon methods, therefore, requires substantial and costly computational resources, and there is a continuing need for more efficient and economical processing methods.
In large part because of the computational intensity of those processes, however, the sampling variables used in prior art Radon processes can be relatively coarse.

Method used


Image

  • Removal of noise from seismic data using high resolution radon transformations
  • Removal of noise from seismic data using high resolution radon transformations
  • Removal of noise from seismic data using high resolution radon transformations

Examples


example 1

Model Data

[0185]Seismic data was modeled in accordance with conventional considerations and plotted in the offset-time domain as shown in FIG. 4. Such data displays a common midpoint gather which includes desired primary reflections Ren and undesired multiples reflections Mn beginning at 1.0, 1.5, 2.0, 2.5, 3.0 and 3.5 seconds. It also includes a desired water-bottom reflection WR at 0.5 seconds. It will be noted in particular that the signals for the desired reflections Ren and WR overlap with those of the undesired multiple reflections Mn.

[0186]The modeled seismic data was then transformed into the time-slowness domain utilizing a high resolution, hyperbolic Radon transformation of the subject invention and an offset weighting factor x0 5. As shown in FIG. 5, the reflections Ren, WR, and Mn all map to concentrated point-like clusters in time-slowness space. Those points, however, map to different areas of time-slowness space, and thus, the points corresponding to undesired multipl...

example 2

West Texas Production Area

[0187]A seismic survey was done in the West Texas area of the United States. FIG. 7 shows a portion of the data collected along a two-dimensional survey line. It is displayed in the offset-time domain and has been gathered into a common midpoint geometry. It will be noted that the data includes a significant amount of unwanted noise, including muted refractions appearing generally in an area 30, aliased ground roll occurring in area 31, and apparent air wave effects at areas 32.

[0188]In accordance with the subject invention, a conventional semblance analysis was performed on the data. The semblance plot was then used to identify a stacking velocity function and, based thereon, to define a filter that would preserve primary reflection events and eliminate noise.

[0189]The data of FIG. 7 was also transformed into the time-slowness domain with a high resolution, hyperbolic Radon transformation of the subject invention using an offset weighting factor x0 5. A ti...

example 3

West African Production Area

[0193]A marine seismic survey was done in a West African offshore production area. FIG. 11 shows a portion of the data collected along a two-dimensional survey line. It is displayed in the offset-time domain and has been gathered into a common midpoint geometry. It will be noted that the data includes a significant amount of unwanted noise.

[0194]In accordance with the subject invention, a conventional semblance analysis was performed on the data. A plot of the semblance analysis is shown in FIG. 12. This semblance plot was then used to identify a stacking velocity function and, based thereon, to define a filter that would preserve primary reflection events and eliminate noise, in particular a strong water bottom multiple present at approximately 0.44 sec in FIG. 12. The semblance analysis was also used to define lower and upper slowness limits pmin and pmax for transformation of the data.

[0195]The data of FIG. 11 was also transformed, in accordance with t...


PUM


Abstract

Methods of processing seismic data to remove unwanted noise from meaningful reflection signals are provided for. The seismic data is transformed from the offset-time domain to the time-slowness domain using a high resolution Radon transformation. That is, the Radon transformation is performed according to an index j of the slowness set and a sampling variable Δp; wherein j=pmax-pmin+1⁢ ⁢µ⁢ ⁢sec⁢ / ⁢mΔ⁢ ⁢p,Δp is from about 0.5 to about 4.0 μsec / m, pmax is a predetermined maximum slowness, and pmin is a predetermined minimum slowness. A corrective filter is then applied to enhance the primary reflection signal content of the data and to eliminate unwanted noise events. After filtering, the enhanced signal content is inverse transformed from the time-slowness domain back to the offset-time domain using an inverse Radon transformation.Suitable forward and reverse Radon transformations incorporating an offset weighting factor xn and its inverse pn, where 0<n<1, include the following continuous transform equations, and discrete versions thereof that approximate the continuous transform equations: u⁢(p,τ)= ⁢⁢∫-∞∞⁢ ⁢ⅆx⁢∫-∞∞⁢ ⁢ⅆt⁢ ⁢d⁡(x,t)⁢xn⁢δ⁡[f⁡(t,x,τ,p)]⁢ ⁢(forward⁢ ⁢transform)d⁡(x,t)= ⁢⁢∫-∞∞⁢ ⁢ⅆp⁢∫-∞∞⁢ ⁢ⅆ ⁢τ⁢ ⁢pn⁢ρ⁡(τ)*u⁡(p,τ)⁢δ⁡[g⁡(t,x,τ,p)]⁢ ⁢(inverse⁢ ⁢transform)

Description

CLAIM TO PRIORITY[0001]This application is a continuation-in-part of an application of John M. Robinson, Rule 47(b) Applicant, entitled “Removal of Noise From Seismic Data Using Improved Radon Transformations”, U.S. Ser. No. 10 / 232,118, filed Aug. 30, 2002, now U.S. Pat. No. 6,691,039.BACKGROUND OF THE INVENTION[0002]The present invention relates to processing of seismic data representative of subsurface features in the earth and, more particularly, to improved methods of processing seismic data using high resolution Radon transformations to remove unwanted noise from meaningful reflection signals.[0003]Seismic surveys are one of the most important techniques for discovering the presence of oil and gas deposits. If the data is properly processed and interpreted, a seismic survey can give geologists a picture of subsurface geological features, so that they may better identify those features capable of holding oil and gas. Drilling is extremely expensive, and ever more so as easily ta...

Claims


Application Information

Patent Timeline
Patent Type & Authority Patents(United States)
IPC IPC(8): G01V1/30G01V1/36
CPCG01V1/364G01V2210/32
Inventor WOOD, LAWRENCE C.
Owner JOHN M ROBINSON
Learn More