

Monitoring system and method implementing failure time spectrum scan
a monitoring system and failure time technology, applied in the field of telecommunications and test equipment, can solve problems such as problems such as problems such as prior art systems that do not have any inherent knowledge of signal characteristics associated with any service within the return path spectrum, and achieve the effect of efficient monitoring of signals on nodes
- Summary
- Abstract
- Description
- Claims
- Application Information
AI Technical Summary
Benefits of technology
Problems solved by technology
Method used
Image

Examples
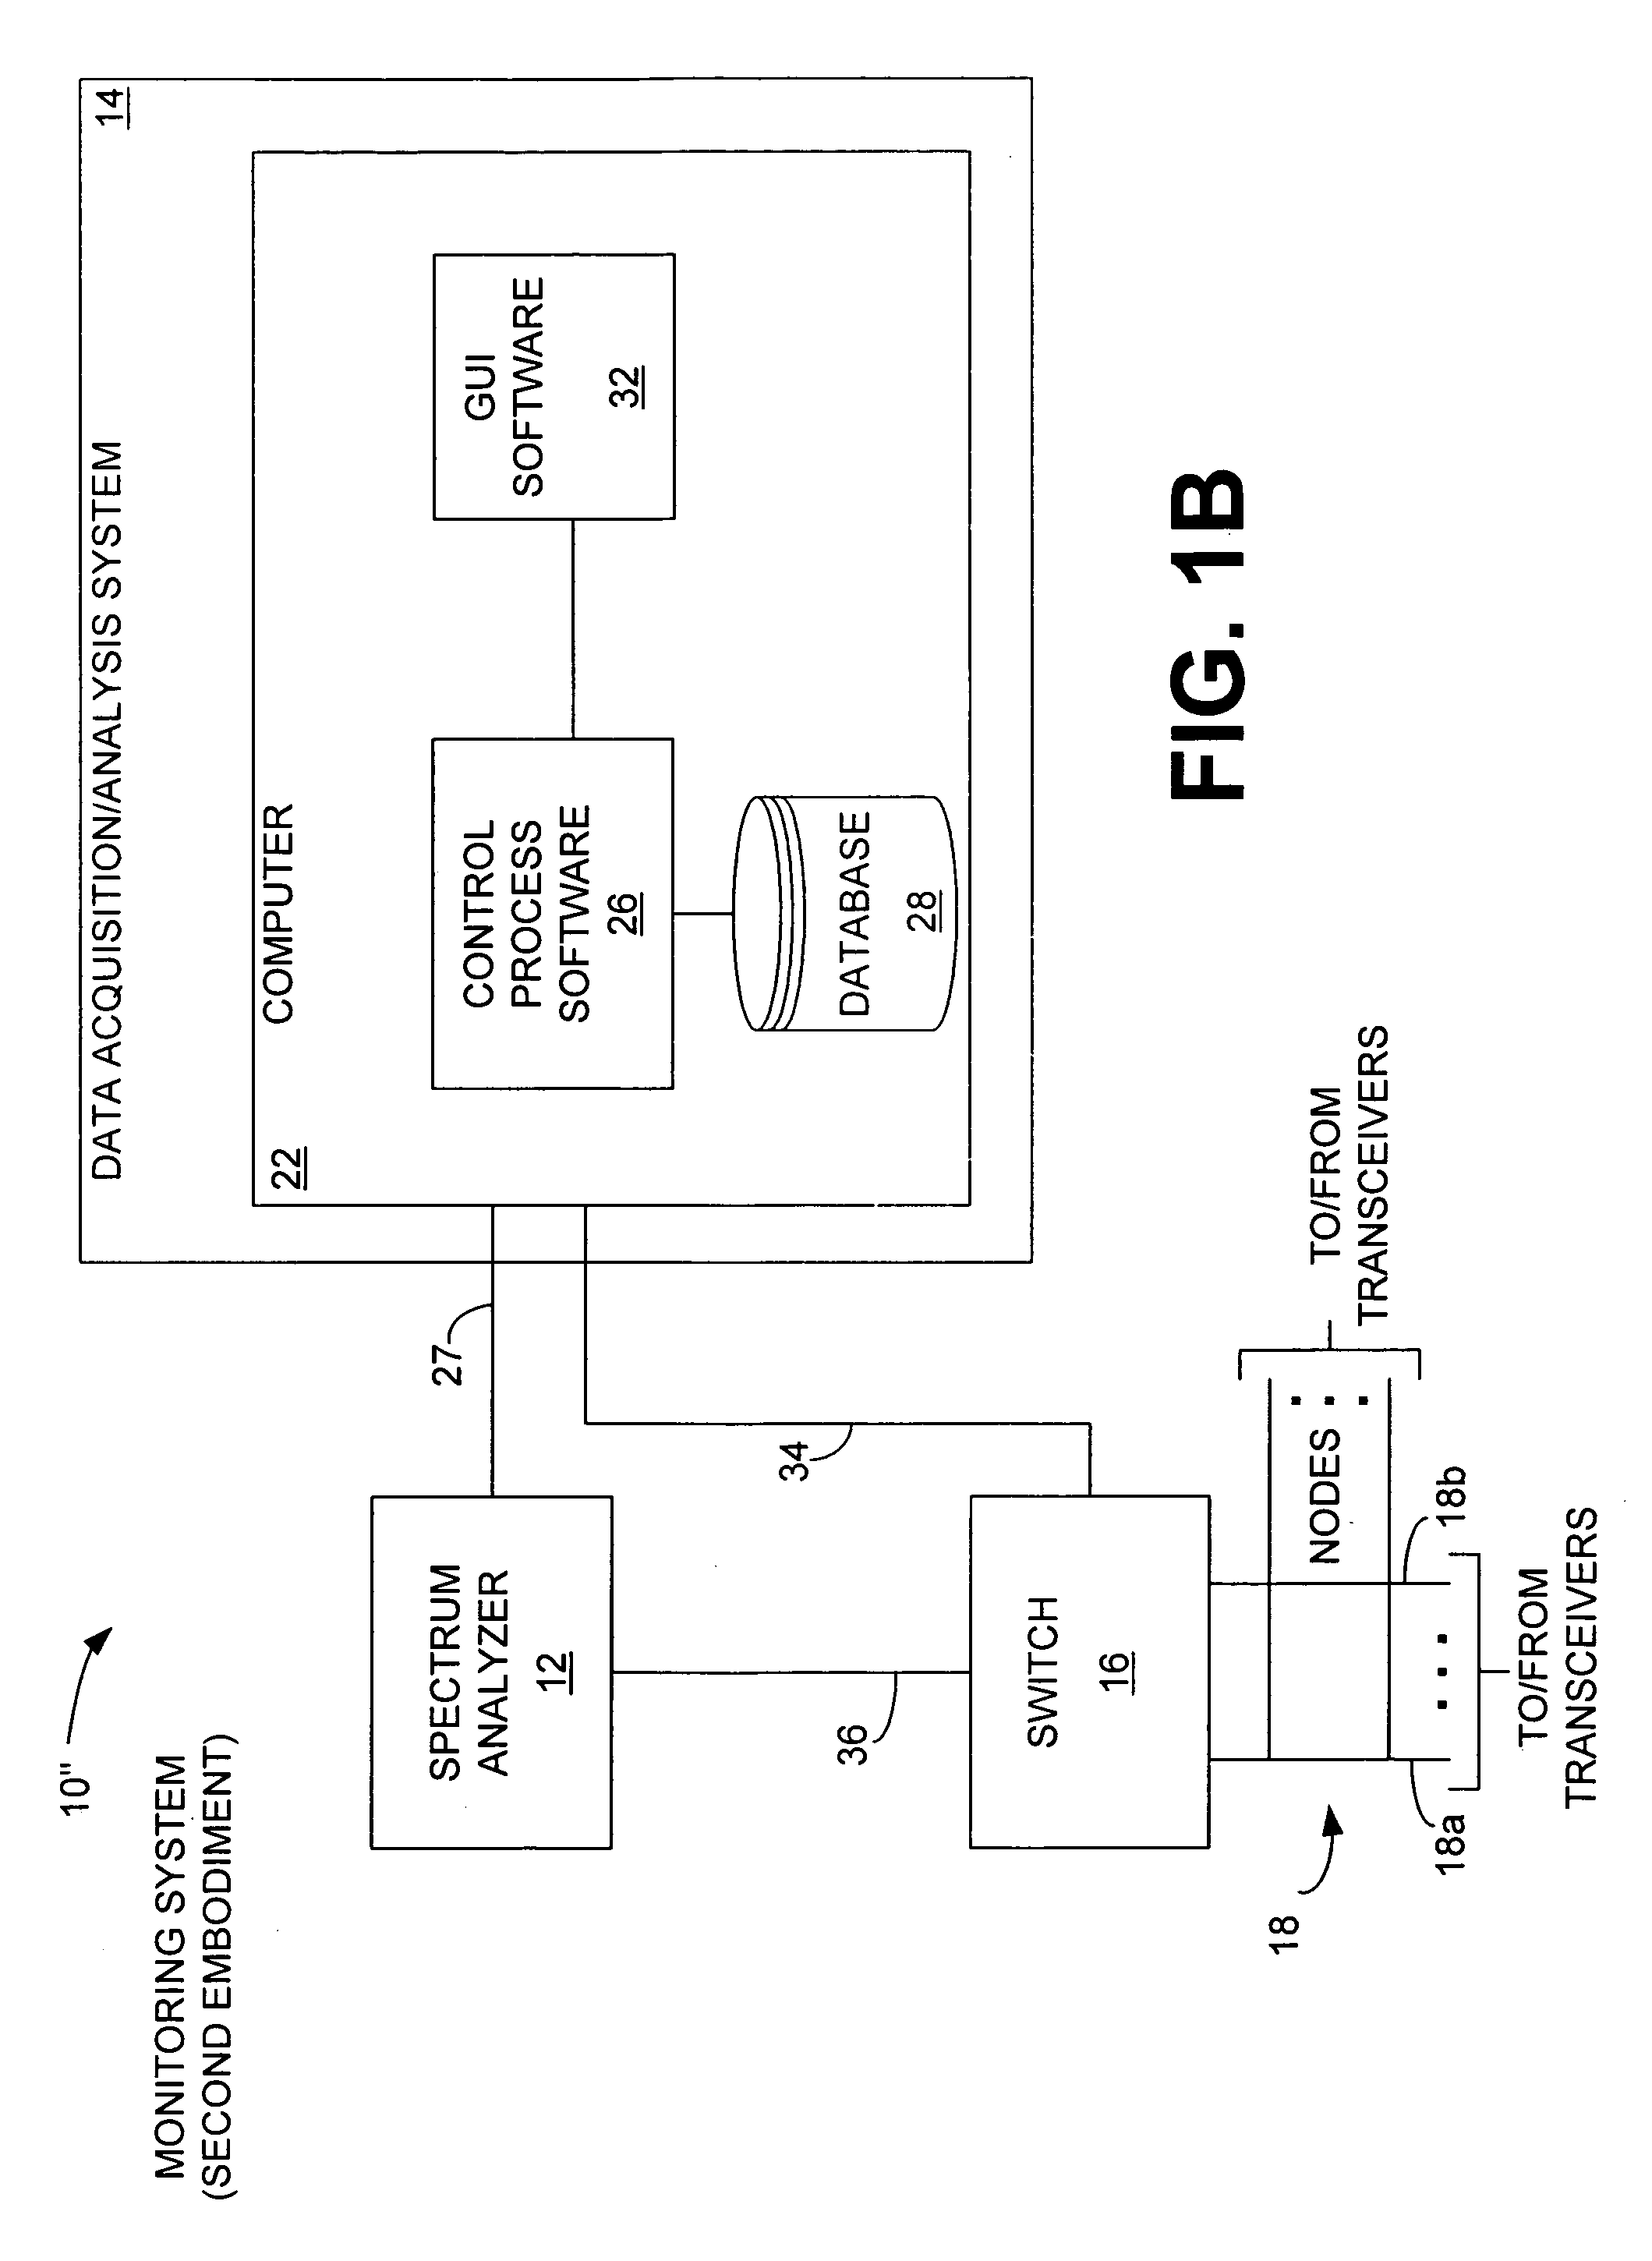
second embodiment
[0045]I. Hardware Architecture[0046]II. Data Structure Of Database[0047]III. Channel Plan And Test Plan Methodology[0048]A. Automated Tests[0049]B. Full Scale Reference (FSR)[0050]C. Thresholds Versus Alarm Limits[0051]D. Spectrum Scan Test[0052]E. Discrete Frequency Scan (DFS) Test[0053]F. Total Node Power Test[0054]1. Node Level—Total Node Power Results Display[0055]2. Group Level—Total Node Power Results Display[0056]G. Average Noise Power Test[0057]H. Channel Power Test[0058]I. Channel Power Test For Bursty Channels[0059]J. Carrier-to-Noise (C / N) Test[0060]K. Burst Counter Test[0061]L. Percent Availability Test[0062]1. Example[0063]M. Failure Time Spectrum Scan Test[0064]IV. Software Architecture[0065](Control Process Software And GUI Software)[0066]A. Channel Plan Setup[0067]B. Device Setup[0068]C. Test Plan Setup[0069]D. First Embodiment Of Automatic Mode[0070](Automated Testing Using Round Robin Algorithm)[0071]E. Second Embodiment Of Automatic Mode[0072](Automated Testing Us...
first embodiment
[0273]D. First Embodiment Of Automatic Mode
[0274](Automated Testing Using Round Robin Algorithm)
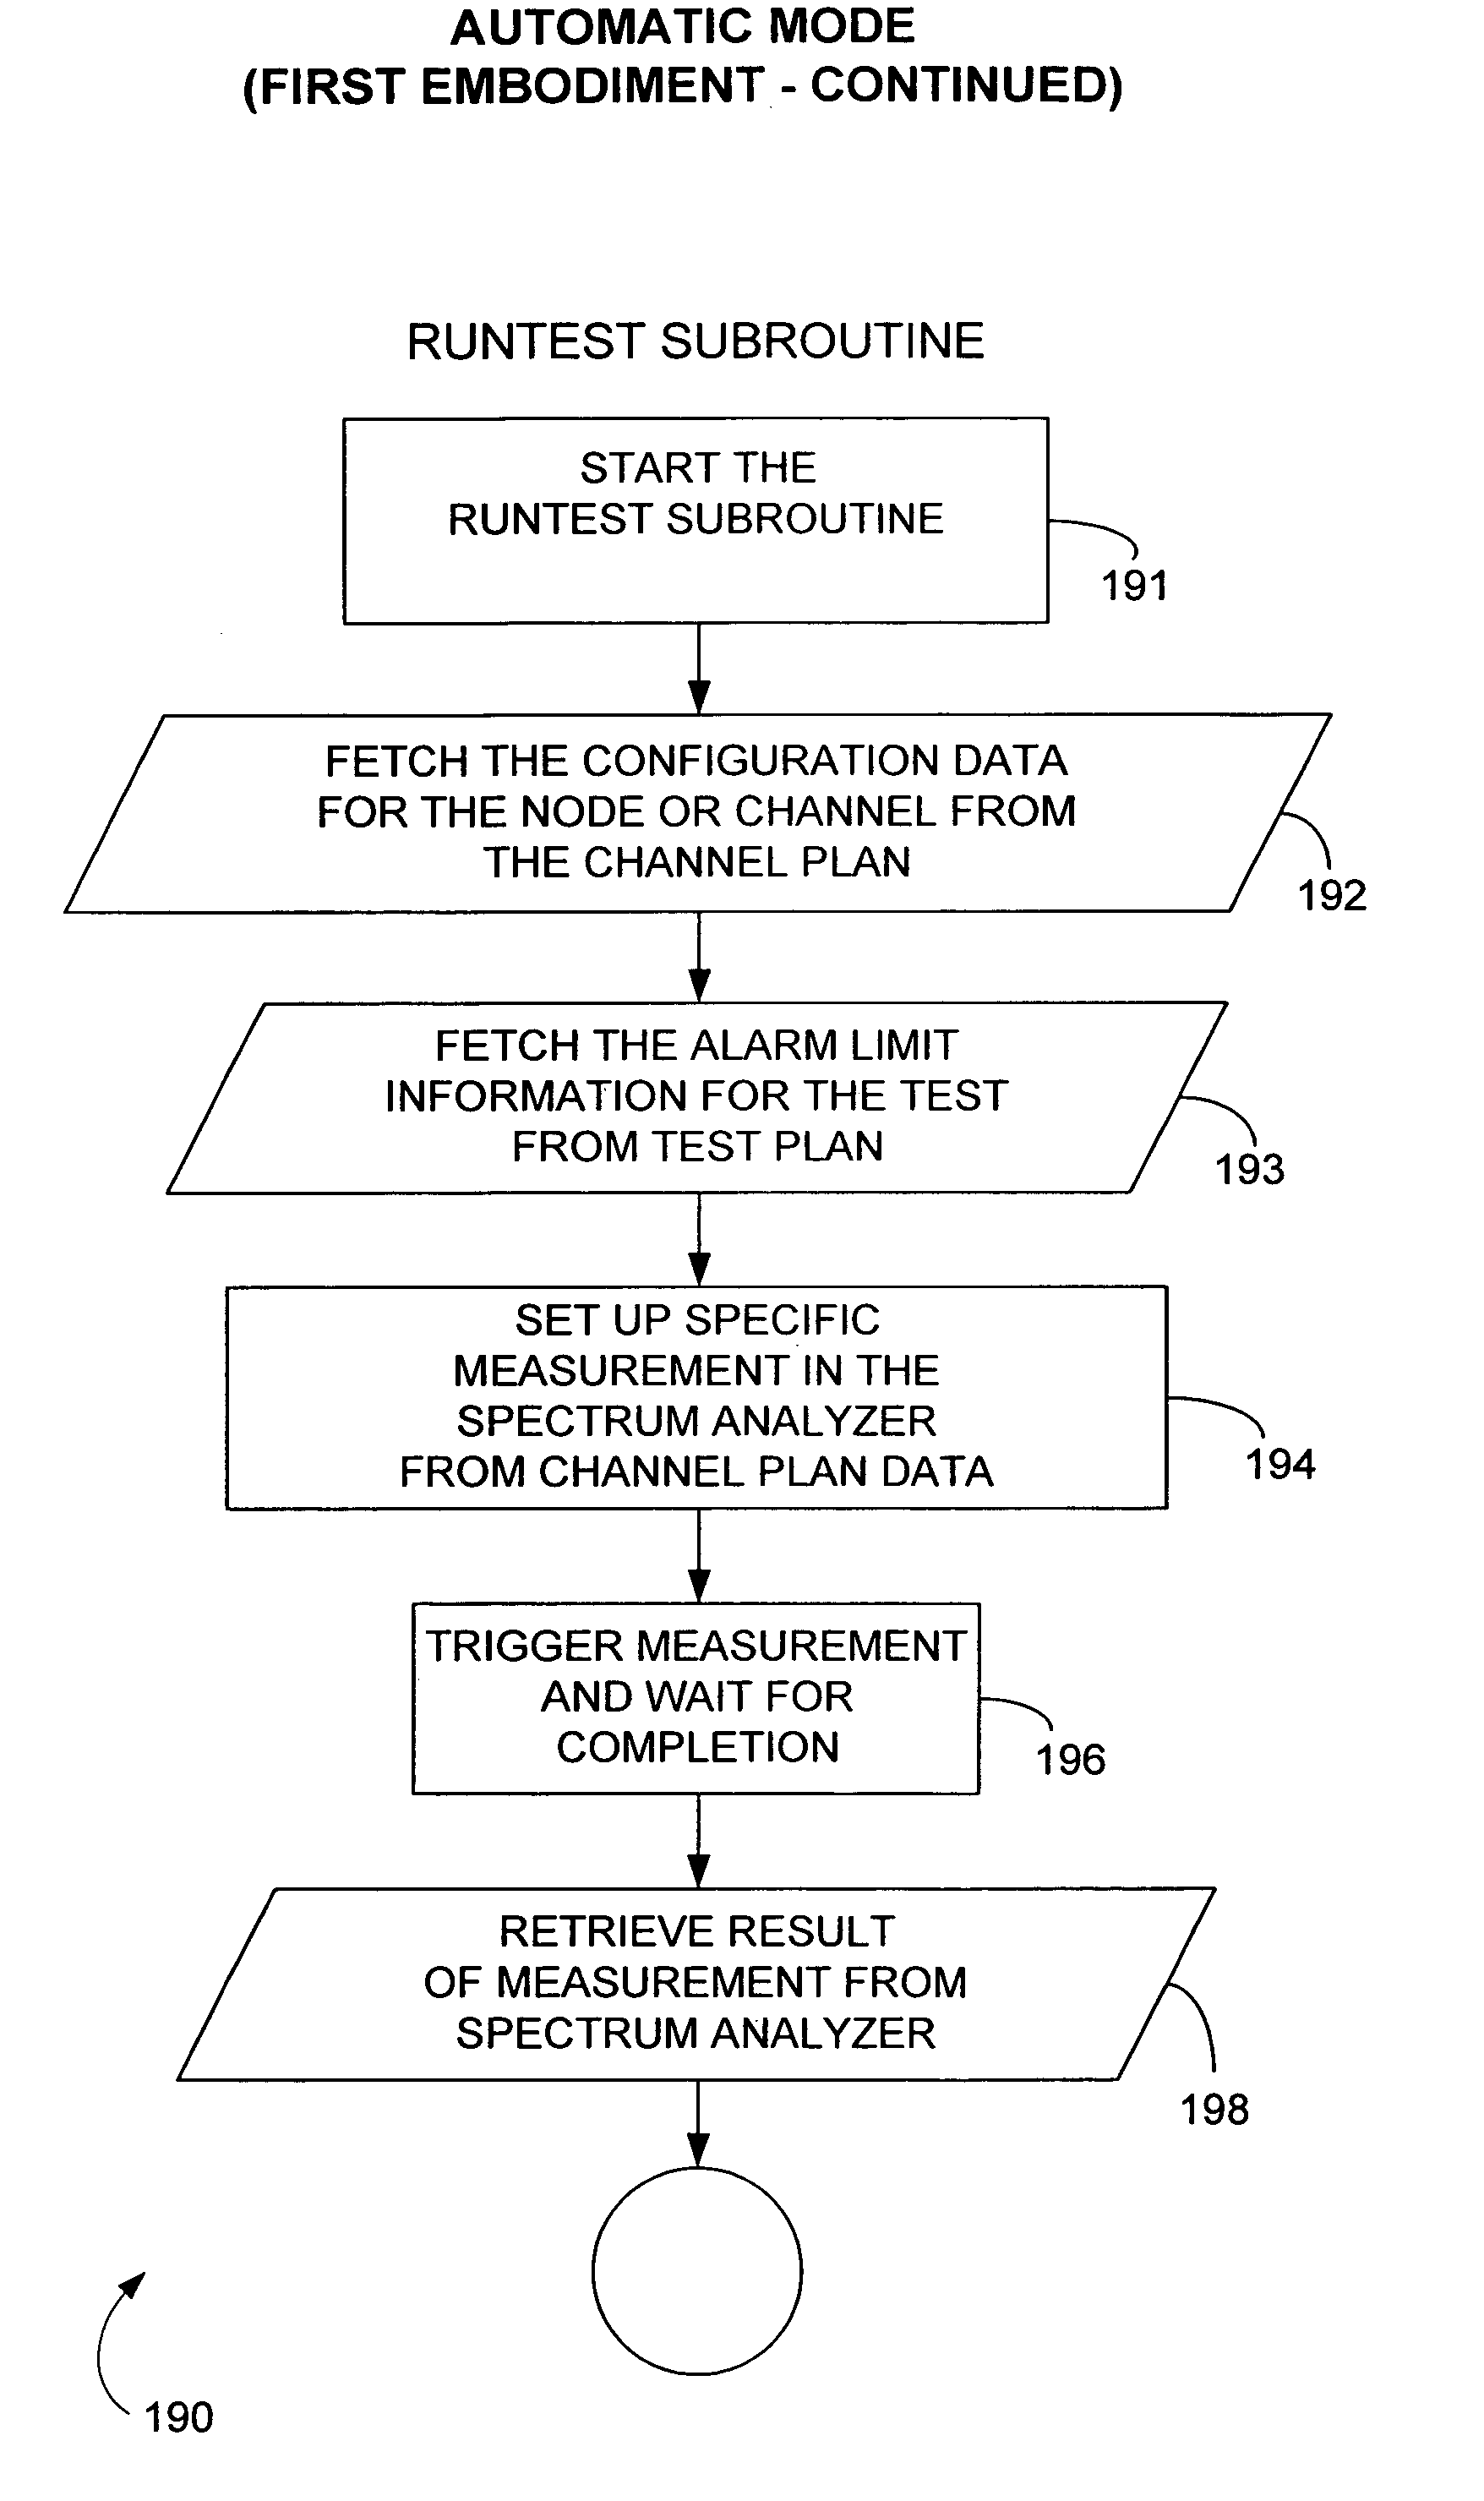
[0275]FIGS. 8A through 8F collectively show a flow chart to illustrate the architecture, functionality, and operation of a first embodiment 108′ of software for the control process software 26 for implementing the automatic mode 108 (FIG. 4) of the control process software 26. Generally, FIGS. 8A through 8D show the high level concept of the first embodiment 108′ of the software for implementing the automatic mode 108, and FIGS. 8E through 8F illustrate a run test subroutine associated with the automatic mode software of FIGS. 8A through 8D.
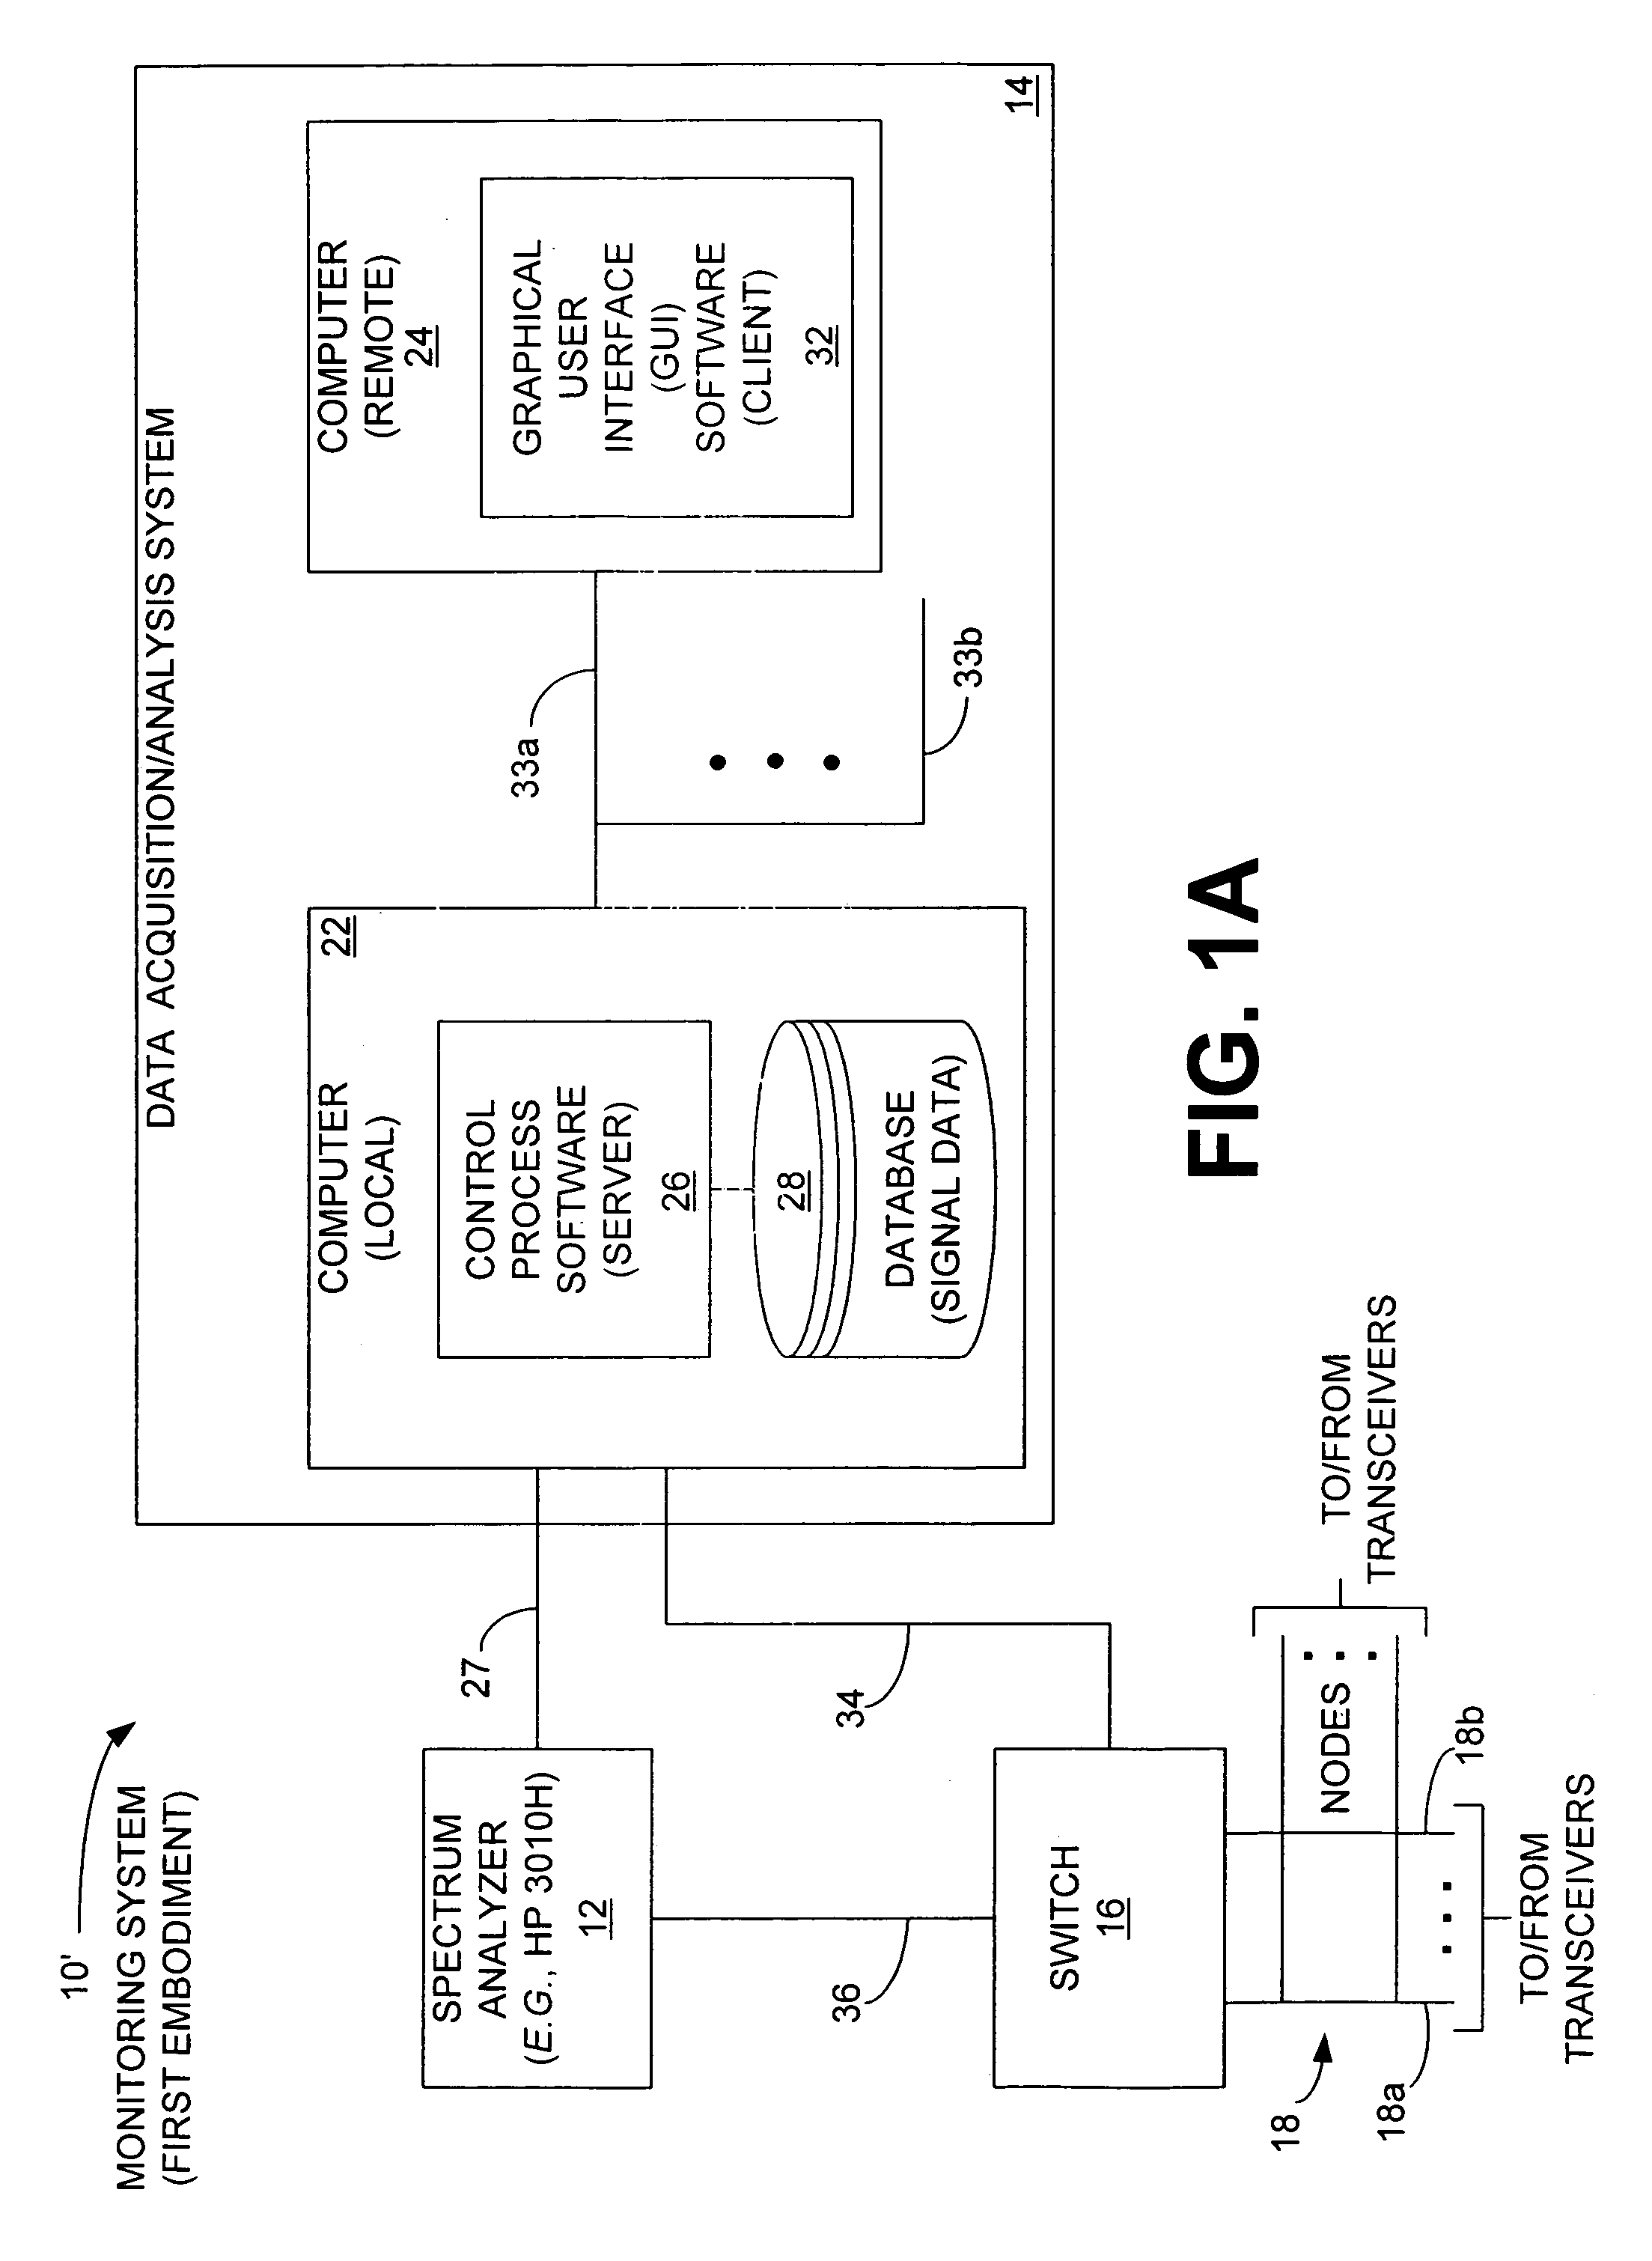
[0276]Referring first to FIG. 8A, when the automatic mode software 108′ is initiated by the control process software 26, an automatic measurement loop is commenced, as indicated by block 151, wherein the control process software 26 causes the spectrum analyzer 12 to perform measurements and report the results back to the control process software 26. Th...
PUM
 Abstract
Description
Claims
Application Information