System and method for digital image tone mapping using an adaptive sigmoidal function based on perceptual preference guidelines
a digital image and tone mapping technology, applied in the field of digital image tone mapping algorithms, can solve the problems of limiting the amount of gray level adjustments allowed in the tone mapping, images that are often not available, and images that look unnatural, so as to improve the appearance of most images, not make any images look wors
- Summary
- Abstract
- Description
- Claims
- Application Information
AI Technical Summary
Benefits of technology
Problems solved by technology
Method used
Image
Examples
first embodiment
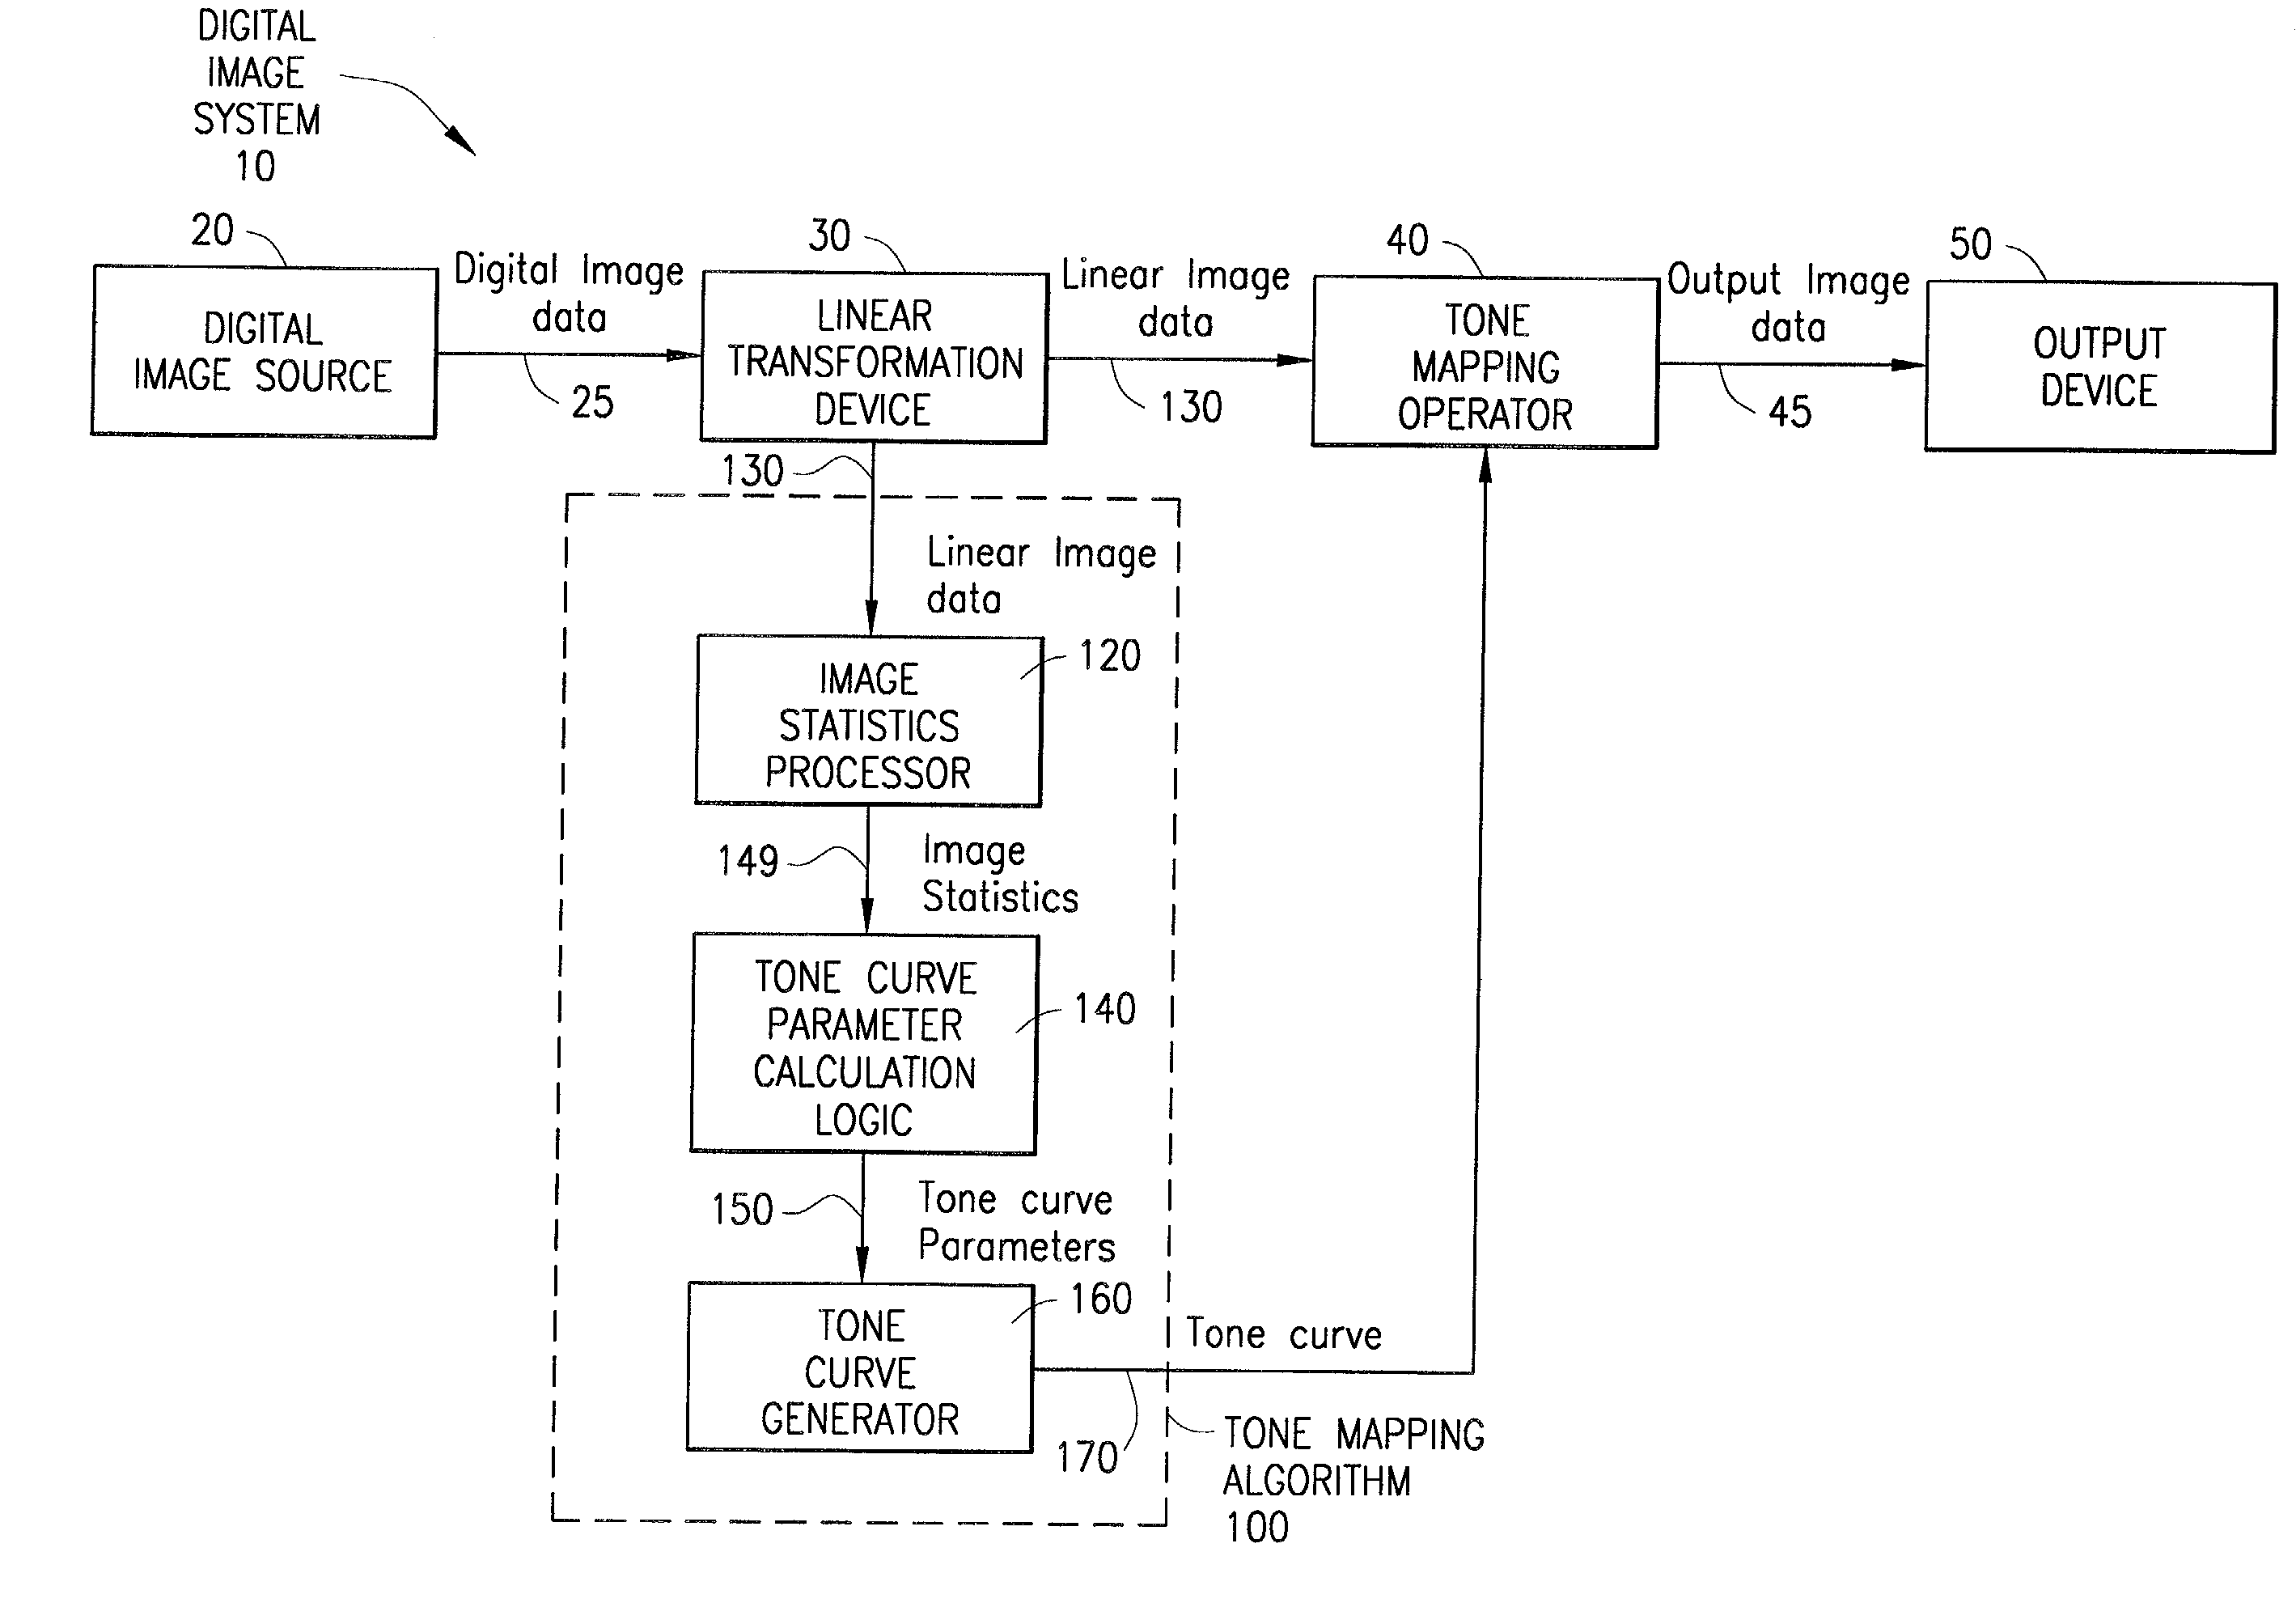
[0040]With reference now to FIGS. 3A–3C of the drawings and the corresponding flow charts of FIGS. 4A–4C, alternative embodiments for implementing the image statistics processor of FIG. 1 are illustrated. In a first embodiment, as shown in FIG. 3A and described in FIG. 4A, the linear image data 130 (step 400) is passed to a histogram generator 122, which produces a histogram 145 (e.g., a table) describing the distribution of the digital values of the data 130 (step 405). For example, in a color digital image, there are a certain number of red, blue and green values (e.g., one of each for each pixel in the image). In order to produce a histogram of green values, for example, the histogram generator 122 determines a bin size (e.g., range of values, such as 0–10, 11–20, 21–30, etc.) and counts the number of occurrences of green pixel values in each bin. To create a graphical representation of the histogram, the data in each bin is plotted as a function of the bin centers (e.g., 5, 15, ...
second embodiment
[0059]In a second embodiment, shown in FIG. 6B, the shift parameter β is calculated based on the L* percentile values. Various studies (see, e.g., Tanaka et al., 1997) have suggested that observers preferred renderings that have as large an output gamut as possible. Therefore, to accommodate these preferences, the shift parameter can be determined by shifting the histogram to make it occupy as much of the output device dynamic range as possible, while bringing as little disturbance to the shape of the histogram as possible to avoid saturation of a lot of points at either end of the distribution. This is done by using a centering function in which the tone curve is centered at midway between the end points of the histogram. This is a conservative choice, typically resulting in only small changes to the mean luminance of the image if the original RGB histogram is somewhat “normal” (values are not concentrated on a small section of the full range).
[0060]Therefore, when the tone curve p...
PUM
 Abstract
Description
Claims
Application Information
 - R&D
- Intellectual Property
- Life Sciences
- Materials
- Tech Scout
- Unparalleled Data Quality
- Higher Quality Content
- 60% Fewer Hallucinations
Browse by: Latest US Patents, China's latest patents, Technical Efficacy Thesaurus, Application Domain, Technology Topic, Popular Technical Reports.
© 2025 PatSnap. All rights reserved.Legal|Privacy policy|Modern Slavery Act Transparency Statement|Sitemap|About US| Contact US: help@patsnap.com


