
System and method for automatic workload characterization

a workload and automatic characterization technology, applied in the field of computer systems and software, can solve the problems of insufficient user time, inability to find workloads and determine which processes belong to which workloads, and inability to accurately describe the relationship between resources and workloads

Active Publication Date: 2006-04-11
BMC SOFTWARE
View PDF3 Cites 343 Cited by
  • Summary
  • Abstract
  • Description
  • Claims
  • Application Information

AI Technical Summary

Benefits of technology

The present invention provides a method and system for automatic workload characterization. This involves collecting and analyzing data to determine which processes and resources are used together during transactions. This analysis can be done without user assistance and can provide more accurate information on resource usage. The system can also automatically identify workloads and determine which resources they use. This information can be useful for managing computer systems and optimizing resource usage.

Problems solved by technology

Traditional approaches for workload characterization often require sophisticated and time-consuming user assistance.
However, there are several problems with this scenario.
First, the need to find workloads and to determine which processes belong to which workload can be complicated and may take an inordinate amount of a user's time.
Also, the information provided by the operating system is often incomplete and / or unreliable.
For instance, with many operating systems, it is often very difficult or impossible to determine how many blocks of data a particular process wrote to disk.
Furthermore, faulty definitions of application workloads and their consumption of resources may lead to invalid predictions of future application performance and system bottlenecks.

Method used


Image

  • System and method for automatic workload characterization
  • System and method for automatic workload characterization
  • System and method for automatic workload characterization

Examples


example 1

[0058]Table 1 (FIG. 8) is a straightforward count of the number entries in a log file of transactions on a web server. The data represents the number of entries in the log file for 90 successive fifteen-minute intervals. For the same time interval, the reported CPU utilization of the two-processor machine is shown in Table 2 (FIG. 9). The correlation coefficient between these two lists is 0.73, and it may be inferred that for each log file entry there was a significant amount of CPU activities. The amount is estimated below.

[0059]This information may be used to construct a model. The model will be an abstraction of one interval, but the above numbers from all the intervals may be used to establish the relationship between the log file entries and CPU usage. This relationship may be estimated using a variant of the formula described below. In this example, CPU utilization and the log file activity have a correlation coefficient of 0.73. It is desirable to distribute CPU utilization b...

example 2

[0105]Table 8 (FIG. 15) shows a list of candidate workloads. Table 8 lists activities, measured by utilization for candidate and aggregated workloads, reads or writes per second for disk, for a twenty-processor machine. Each number in the table is an average over a 15-minute interval. Since it is a 20-processor machine, the maximum possible number is 2000. The original table has 96 rows (covering 24 hours); for space reasons, only the first 20 rows are shown in FIG. 15. FIG. 7 illustrates the normalized activities (utilization and I / O rate), after using the linear transformation (1), of the candidate workloads. There are many pairs of workloads in FIG. 7 that are highly correlated, though others are not correlated. Table 9 (FIG. 16) lists pairs of candidate workloads ordered by the correlation coefficient values from high to low.

[0106]We will aggregate workloads by the following procedure: First, we set a threshold to indicate a significant relationship (correlation). Here, we will ...


PUM


Abstract

A system and method for automatic workload characterization are provided. Transactions performed in a computer system may be logged. The log of transactions comprises a timestamp for each transaction. Resource usage in the computer system may be logged. The log of resource usage comprises one or more periods of time during which each of a plurality of resources is used, and the log of resource usage comprises a plurality of system performance metrics which reflect resource consumption by one or more processes that performed the transactions. The timestamps in the log of transactions may be compared to the periods of time in the log of resource usage. It may be determined which transactions used which resources as a result of the comparing the timestamps in the log of transactions to the periods of time in the log of resource usage. One or more workloads may be determined using the determining which transactions used which resources. Heuristics may be used to group processes into workloads.

Description

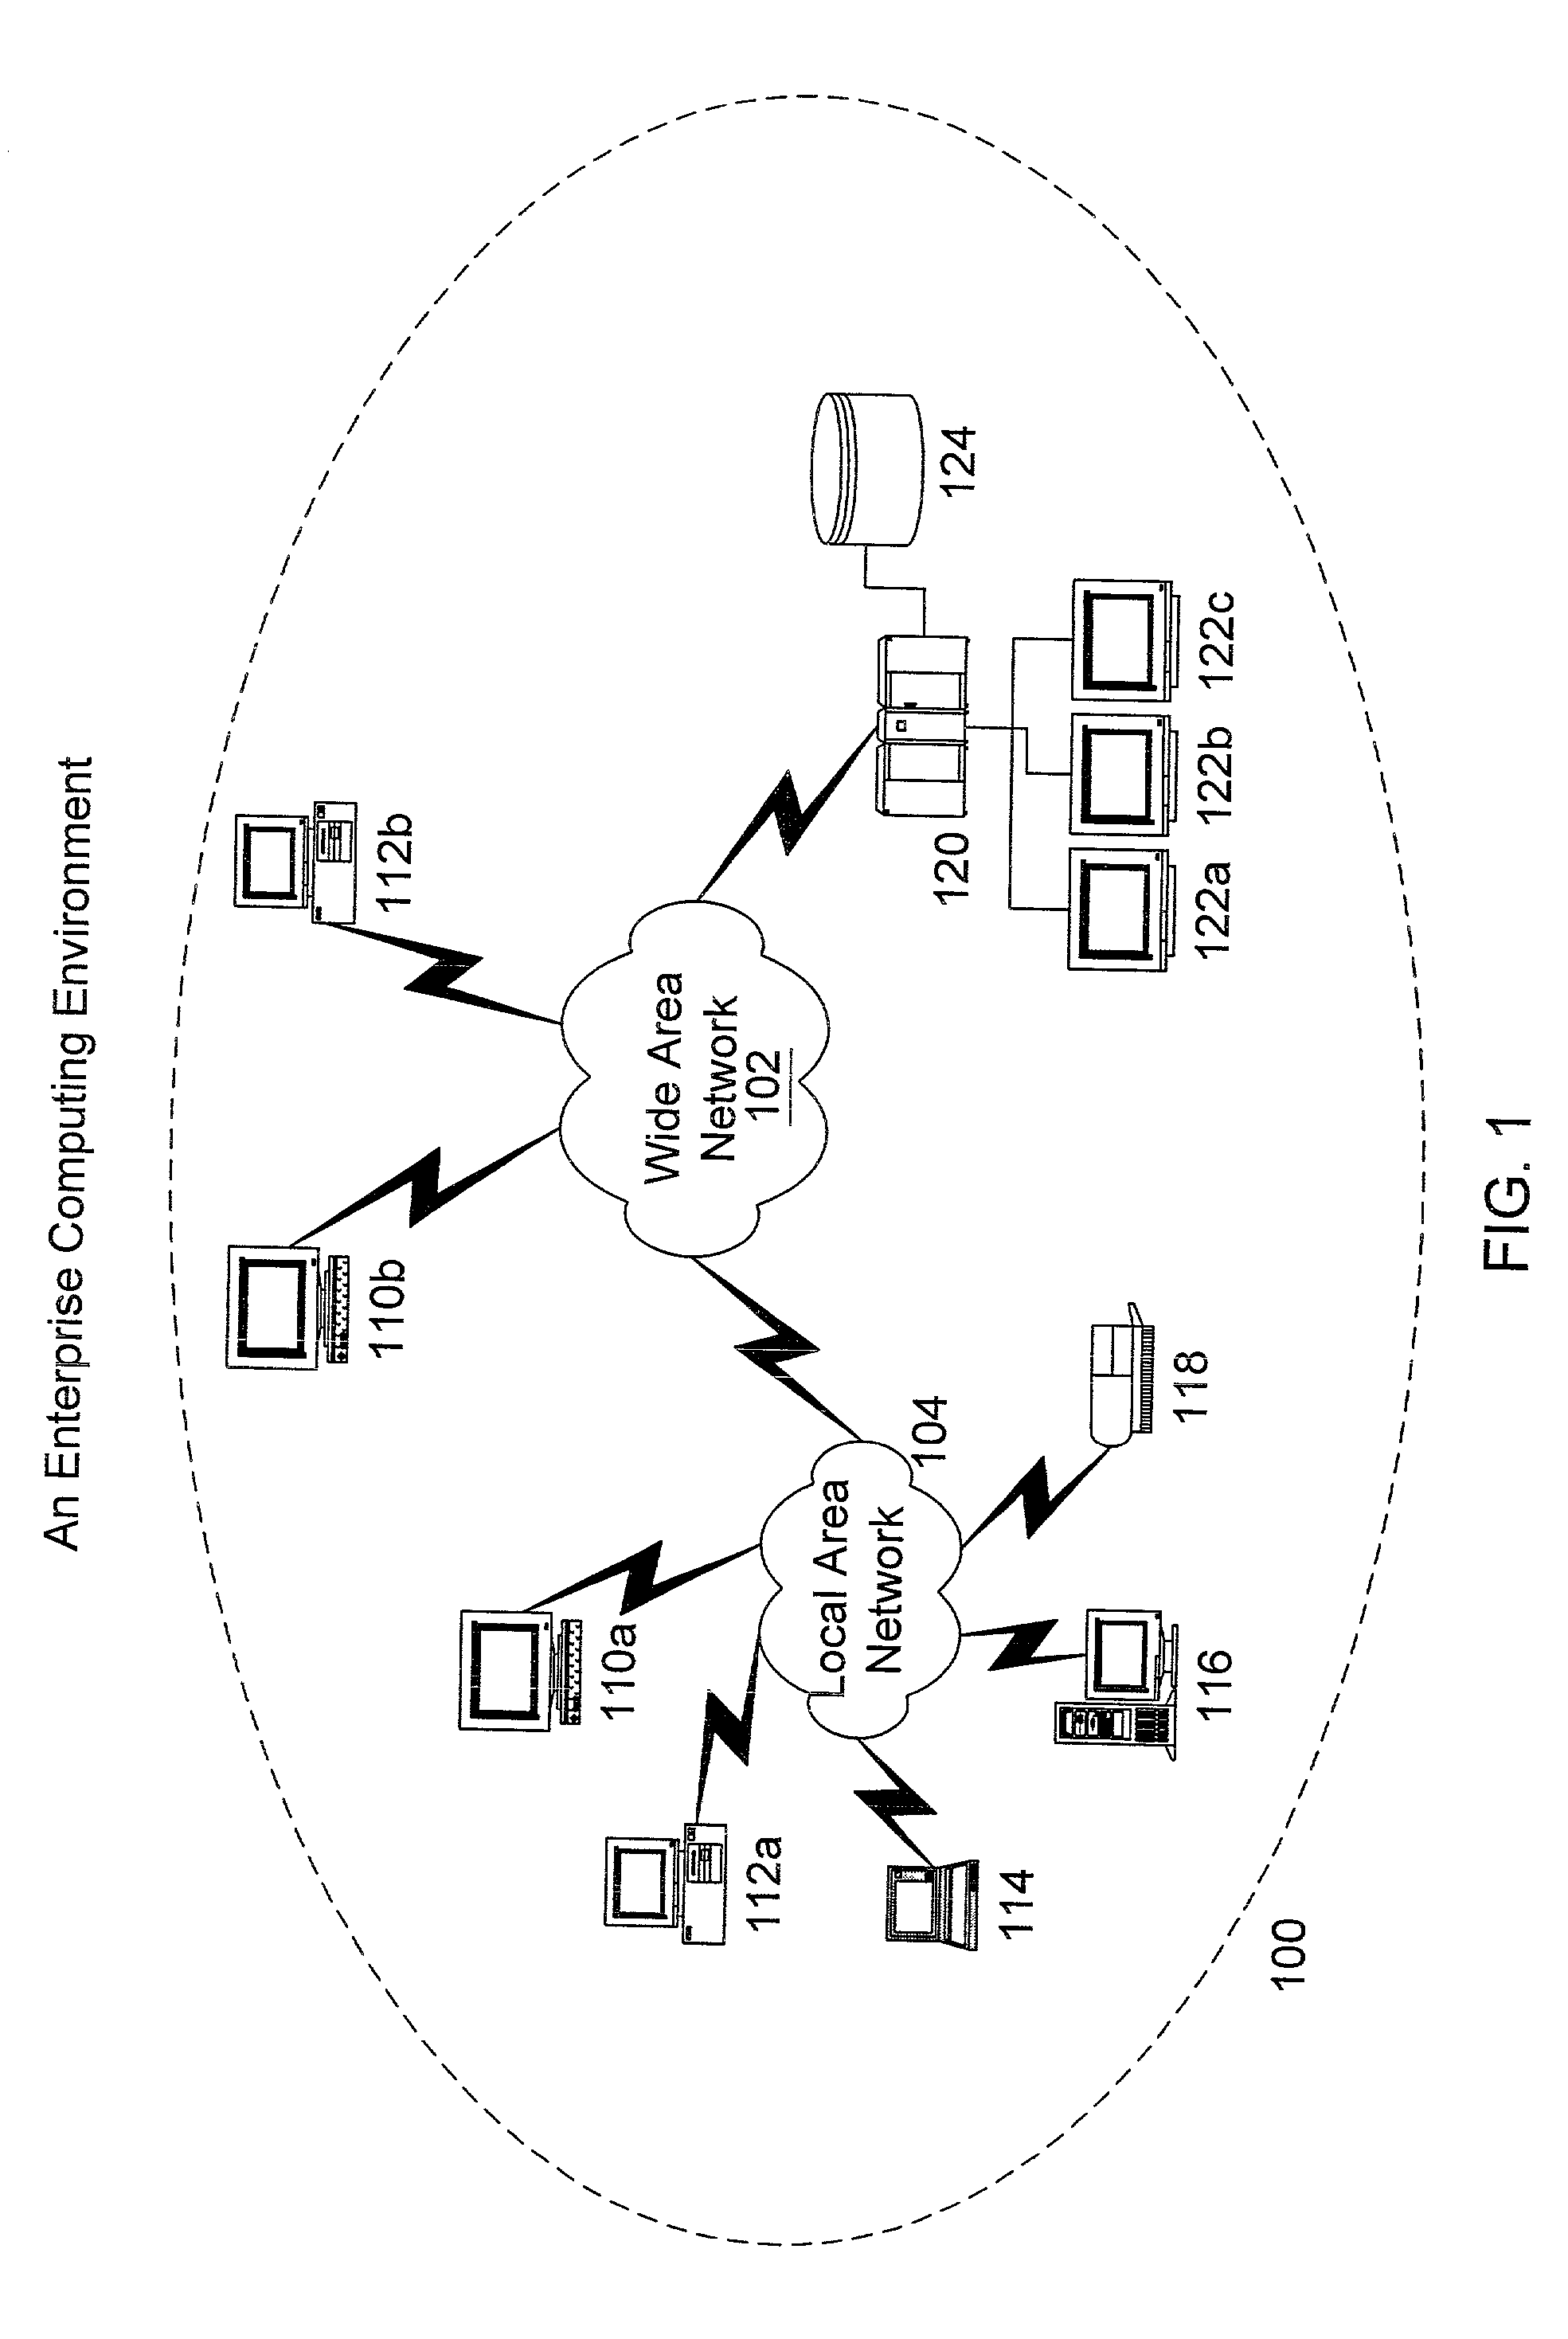
PRIORITY CLAIM[0001]This application claims the benefit of U.S. Provisional Application No. 60 / 254,340 entitled “SYSTEM AND METHOD FOR AUTOMATIC WORKLOAD CHARACTERIZATION,” filed Dec. 8, 2000.BACKGROUND OF THE INVENTION[0002]1. Field of the Invention[0003]This invention relates generally to computer systems and software. More particularly, the invention relates to workload characterization for capacity planning and performance modeling.[0004]2. Description of the Related Art[0005]The data processing resources of business organizations are increasingly taking the form of a distributed computing environment in which data and processing are dispersed over a network comprising many interconnected, heterogeneous, geographically remote computers. Such a computing environment is commonly referred to as an enterprise computing environment, or simply an enterprise. Managers of the enterprise often employ software packages known as enterprise management systems to monitor, analyze, and manage...

Claims


Application Information

Patent Timeline
Patent Type & Authority Patents(United States)
IPC IPC(8): G06F9/46G06F9/50
CPCG06F9/5011G06F2209/508
Inventor DING, YIPINGNEWMAN, KENNETH
Owner BMC SOFTWARE
Learn More