Eureka AIR delivers breakthrough ideas for toughest innovation challenges, trusted by R&D personnel around the world.

Method for enhancing depth and spatial resolution of one and two dimensional residual surfaces derived from scalar potential data

a one-dimensional residual surface and spatial resolution technology, applied in wave based measurement systems, instruments, reradiation, etc., can solve the problems of reducing the emphasis on the development of fft/filter/ifft and equivalent procedures as reliable qualitative and quantitative tools, ambiguities and difficulties in the analysis of potential field anomalies, etc., to enhance the interpretation of revealed structures and improve quality and quantity of information

Inactive Publication Date: 2006-05-09
MCDERMOTT ANDREW MARTIN
View PDF10 Cites 5 Cited by
  • Summary
  • Abstract
  • Description
  • Claims
  • Application Information

AI Technical Summary

Problems solved by technology

As a practical matter, separation that yields detailed depth resolution of structure has not been achieved using established geophysical methods applied solely to a single type of scalar potential data.
However, the biases developed in the field over years of research activity and the commercial investments that have been made to develop and apply costly and complex tools for the inversion and forwarding modeling approach have contributed to reduced emphasis on the development of the FFT / filter / IFFT and equivalent procedures as reliable qualitative and quantitative tools.
It has also been observed that certain ambiguities and difficulties in the analysis of potential field anomalies exist when conventional Fourier techniques are used.
Conventional Fourier analysis is unable to distinguish these structures from one another.
In addition, overlying shallow structures can mask the effects of deeper structures of interest on the measured potential field anomalies. . . . Adjacent but not overlying structures can also interfere with the measured potential field deviations produced by a geological structure. . . . Yet another difficulty in the analysis of potential field measurements using conventional Fourier techniques is presented by variations in the elevation of the surface locations.
As such, deviations in the measured potential field caused by changes in elevation must be taken into account in the analysis; however, this process is somewhat difficult and complex according to conventional Fourier techniques.
These ambiguities, masking effects, and interference effects significant limit the ability of conventional Fourier analysis to detect important geological structures from potential field measurement data.
Except in very simple cases, the separation of the observed field into its component parts is quite difficult and sometimes not possible at all .
. . the lack of uniqueness in the gravity field from a subsurface source means that an infinite number of different configurations can result in identical gravity data at the surface.
To resolve such ambiguity, other information than that from gravity is needed. . . . No amount of computer manipulation can compensate for a poorly designed survey.
Simply stated this implies that there is no way to analytically resolve the possible contribution from a deeply seated and spatially extended source from that of a shallow and more localized source using scalar potential data alone.
The limitations of the available filtering and gridding tools in the earliest studies are certainly in part responsible for the appearance of these problems.
This means that use of a high, low, or band pass filter followed by a similar filter or an anisotropic directional filter is more likely to exhibit instability in the form of oscillatory or periodic structure than a similar treatment that uses only a single frequency removal filter.
Gibb's phenomenon is one characteristic of the FFT algorithm that causes error.
Any large jump in value from one data point to the next causes a discontinuity and will result in oscillations to appear when the data is transformed from one domain to the other.
Jumps in value may be real, such as due to an unusually high gradient in the gravity field, but will still cause ripples to appear in the filtered data set.
If the discontinuity is small, the oscillations due to Gibb's phenomenon may be tolerable, they may not even be apparent when the data set is contoured, but at times they can cause a great amount of error.
Another characteristic error that occurs due to the FFT is leakage.
However, the FFT algorithm makes some assumptions that may affect the trueness of the results.
During filtering, this may cause information from each edge of the map to affect data on the opposite edge.
Leakage of the Fourier signal from one side of the data set to the other can cause great amounts of error.
Since in potential field studies it is not known what the data should look like, it is not always possible to tell whether leakage has occured.
However, adding zeros still caused a discontinuity between the data set and the filled region of zeros.
This can cause great discontinuities in the data if the value at one end is greatly different than the value at the other.
Transforming such a data set with the FFT will cause a significant amount of leakage and Gibb's phenomenon.
However, if there is any type of regional trend across the data set, it is likely that the difference between the two ends will be great and the errors will be severe. . . . One method of limiting edge effects is to taper the edges of the data set.
Therefore, the error in the filtered data has been increased.
When the techniques described are used individually or cooperatively they provide a desired but heretofore never achieved level of qualitative or quantitative information about subsurface structures.

Method used


Image

  • Method for enhancing depth and spatial resolution of one and two dimensional residual surfaces derived from scalar potential data
  • Method for enhancing depth and spatial resolution of one and two dimensional residual surfaces derived from scalar potential data
  • Method for enhancing depth and spatial resolution of one and two dimensional residual surfaces derived from scalar potential data

Examples


embodiment

Preferred Embodiment

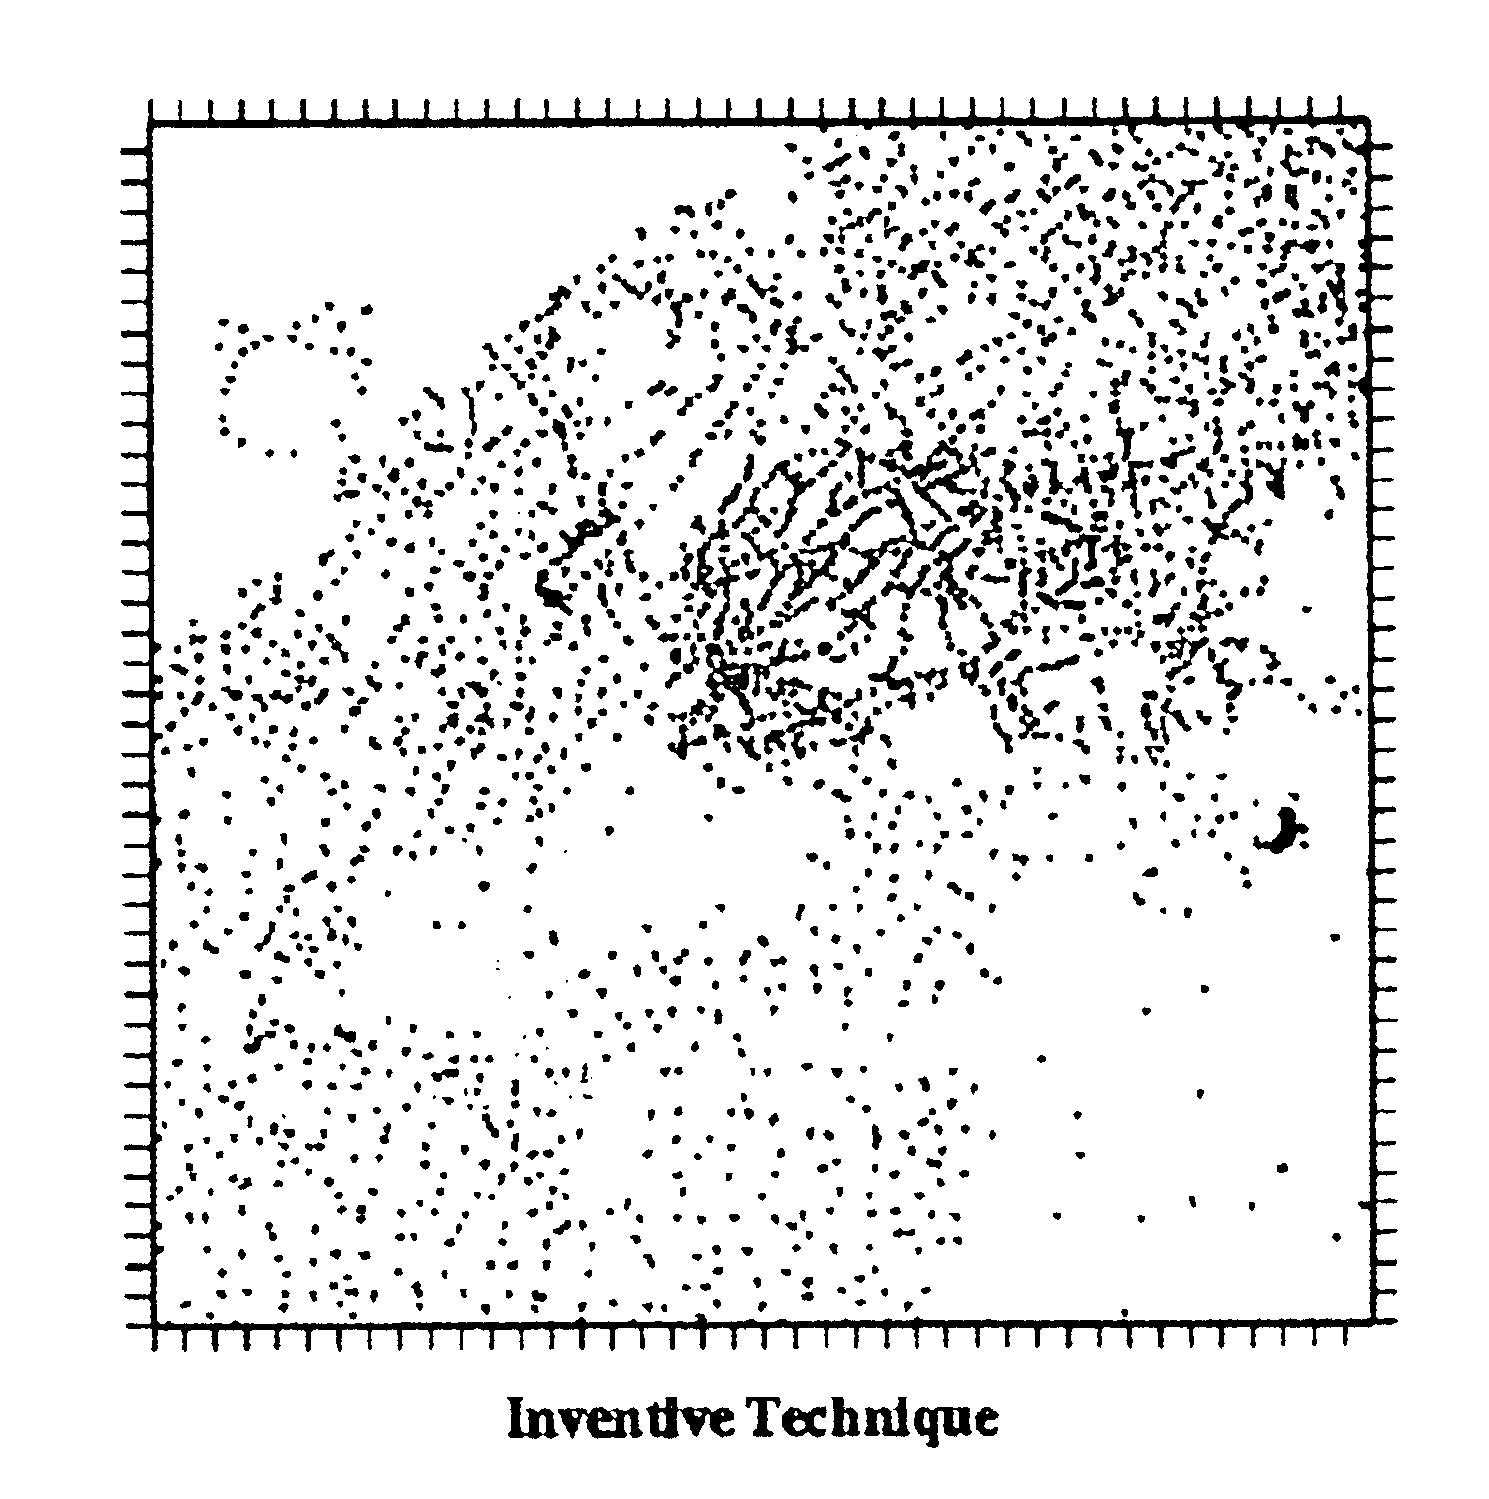
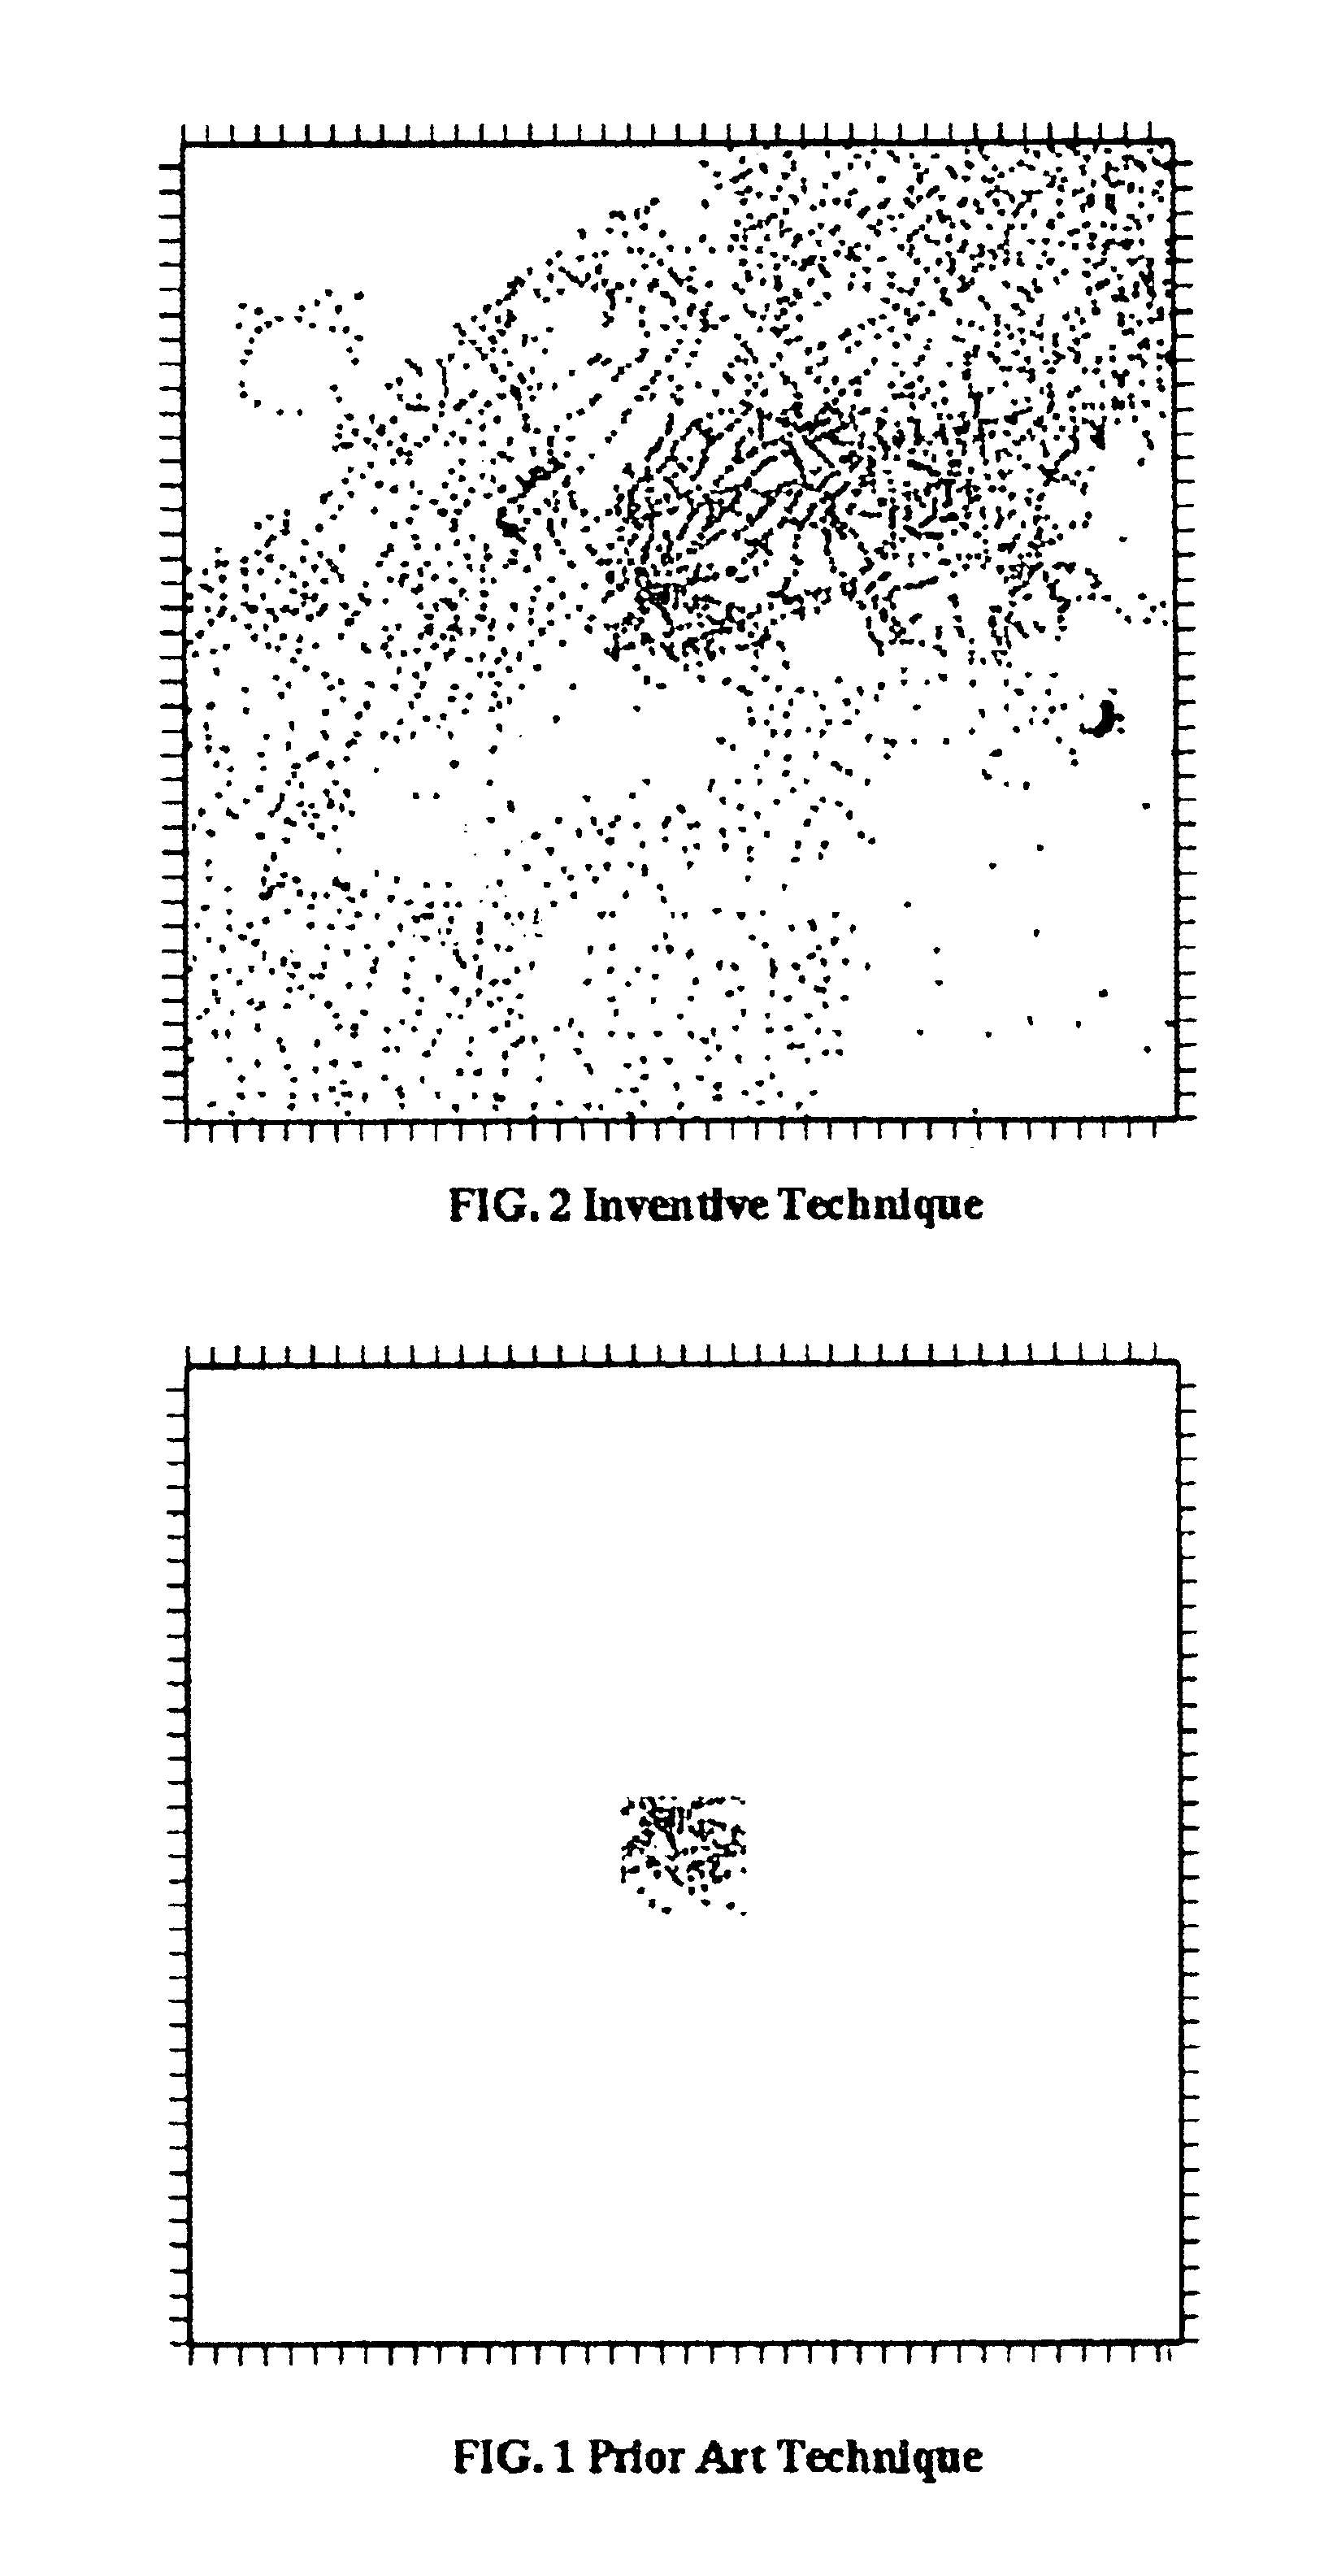
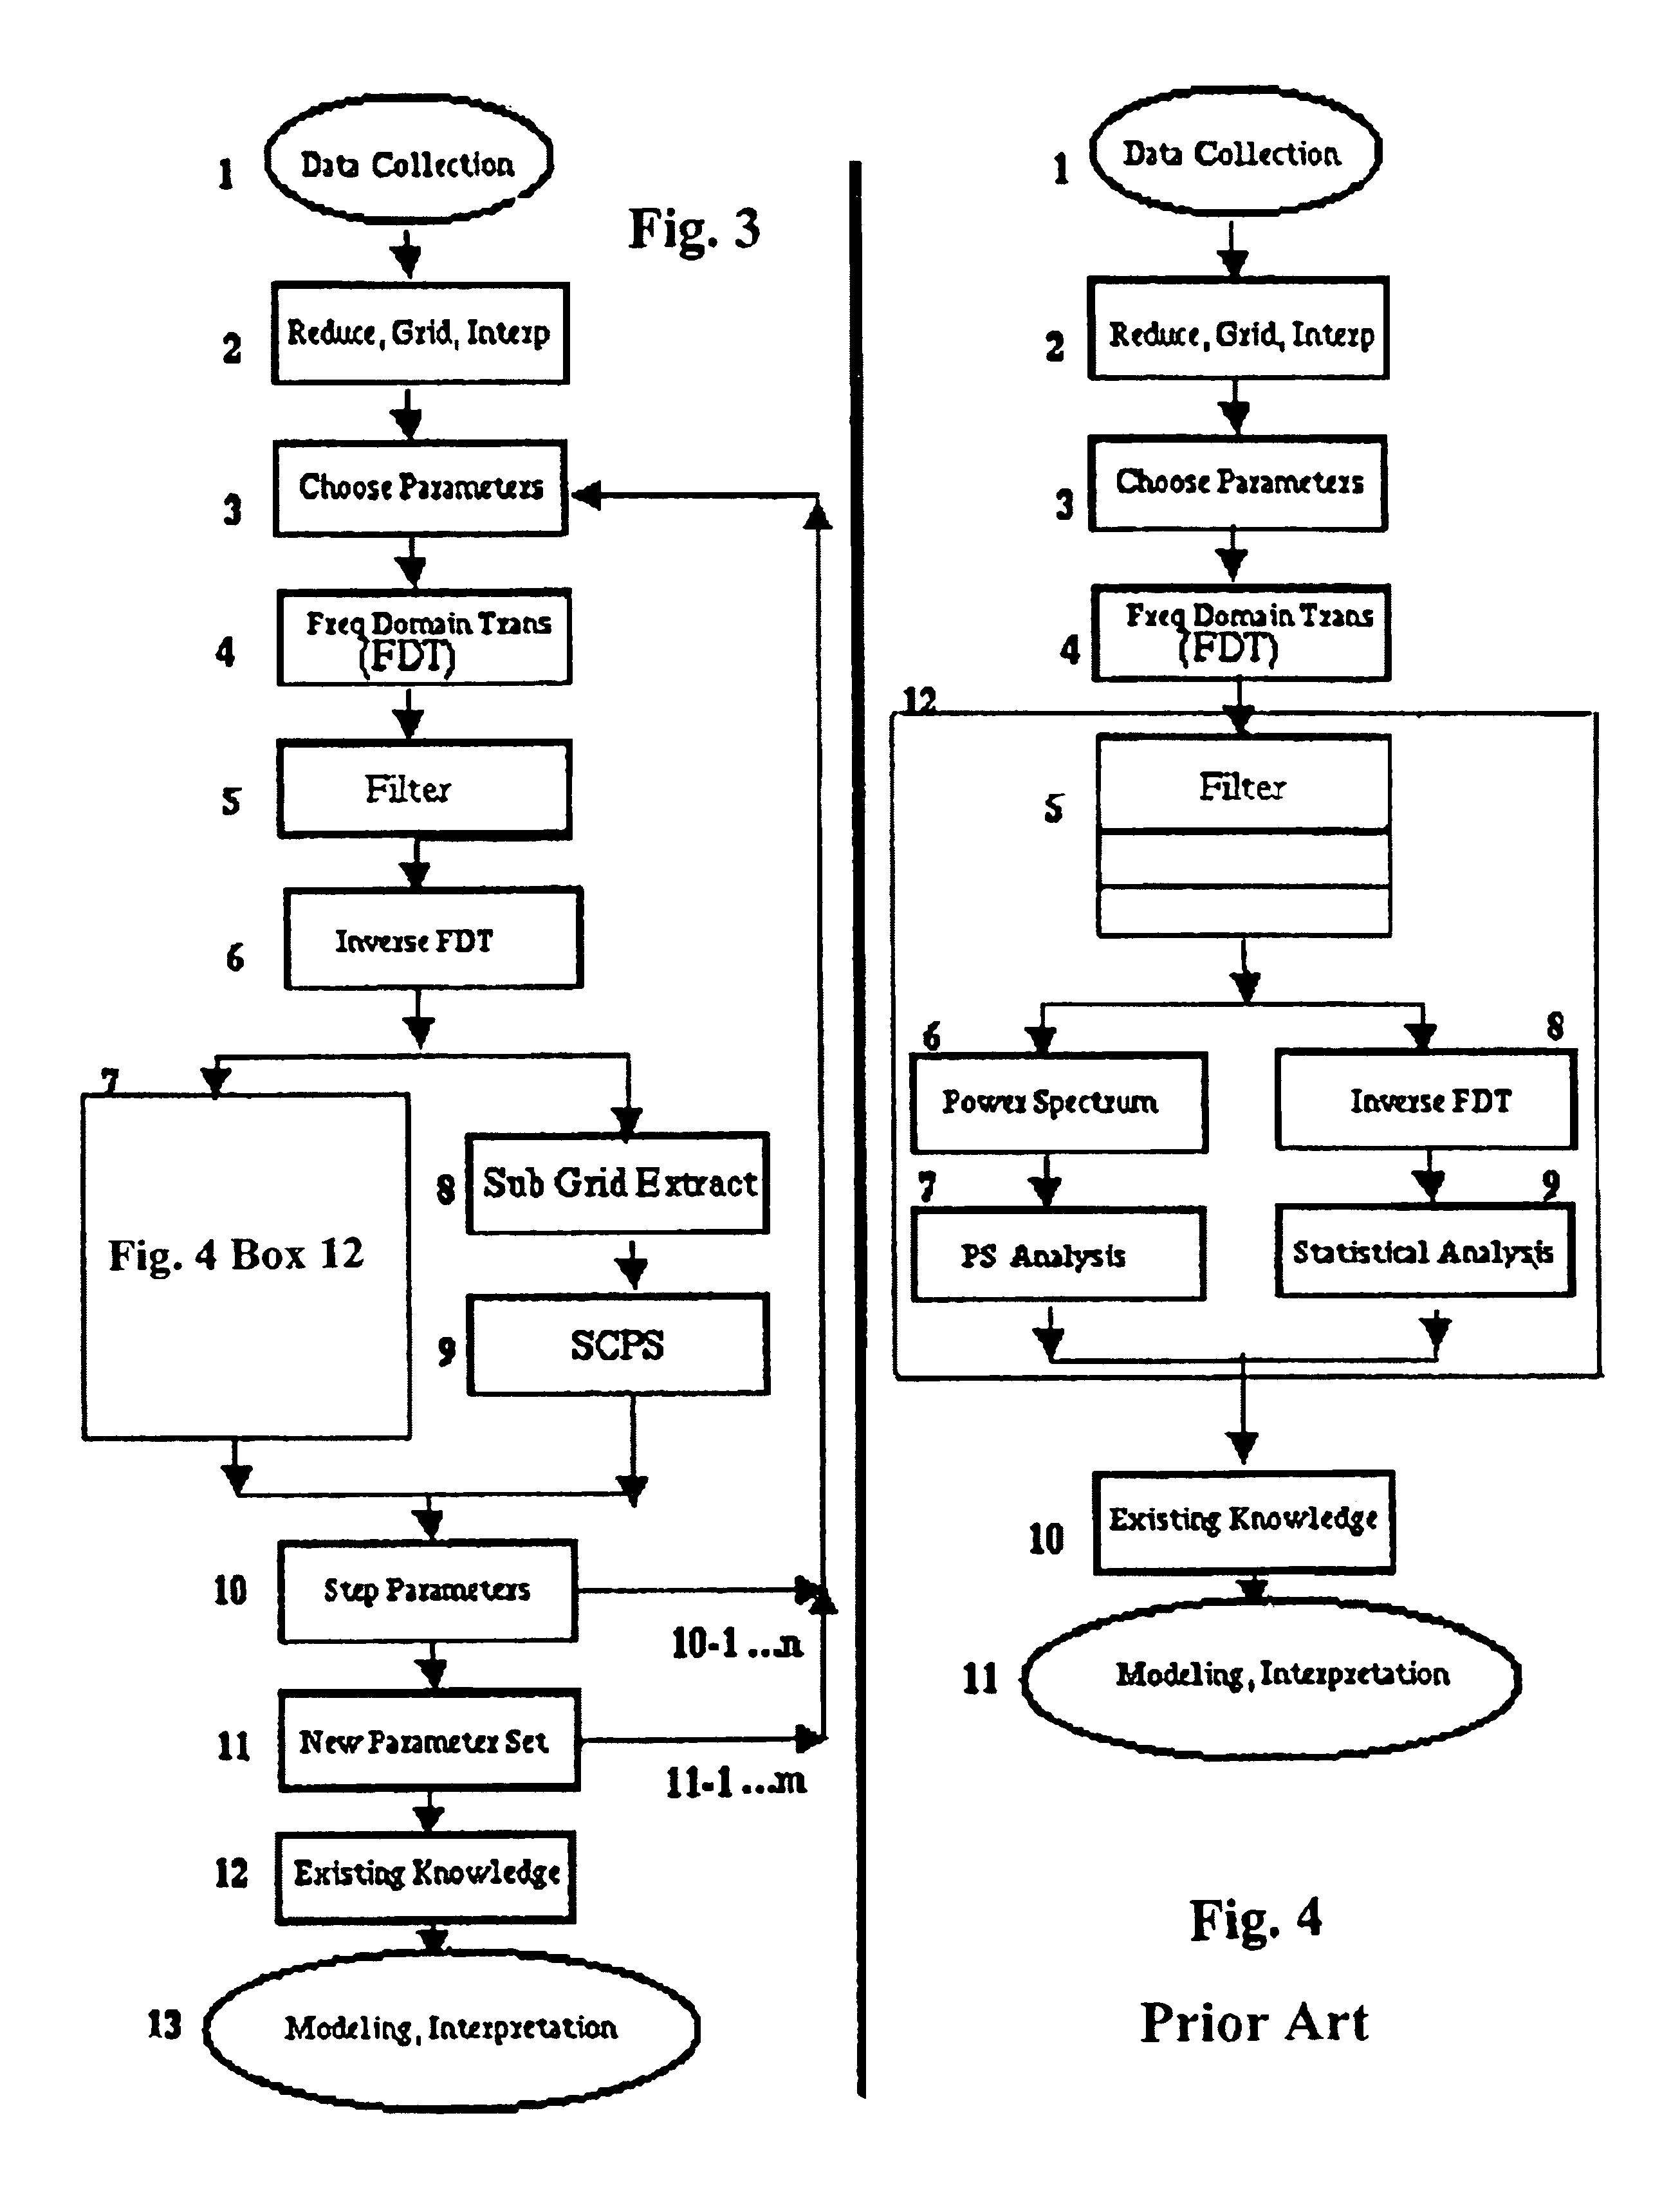
[0056]An example of the application of the present invention is provided below as an illustration of the employment of the technique and in order to indicate the broad range of geophysical solutions that may be facilitated. This is based upon actual work performed using a subset of a well charcterized dataset where the total coverage of the original dataset exceeds 7 degrees of latitude and five degrees of longitude with an effective average spacing of approximately 4 km. Three freely available, Open Source, cross-platform software tools were combined into a scripted interface to create an almost fully automated facility for this work. The first tool was a set of command-line programs that provides data gridding and interpolating facilities and a powerful FFT-filtering-IFFT implementation. The second tool was a scriptable, command-line based Geographic Information Systems(GIS) software package with a Graphical user interface(GUI). The third tool was a powerful in...


PUM


Abstract

An improved method is disclosed for collecting or assembling scalar potential data measurements that are to be subsequently prepared as a surface representation for analysis via frequency domain transform filters. Measurements are made over a geographic reference region which extends in all cardinal directions from the center of some previously determined primary region. The reference dimensions must contain the primary region and must be plural multiples of the greatest depth to be considered in analyzing the contributions to the measurements. A combined or separate improved method for delineating or defining geospatial information contributing to a scalar potential surface is disclosed. This method is implemented using traditional statistical techniques to construct an histogram from the set of values comprising a surface representation. This histogram constitutes a Spatially Correlated Potential Spectrum for the surface. These combined and separate methods improve resolution of geological structures over depths and spatial extents under consideration.

Description

CROSS-REFERENCE TO RELATED APPLICATIONS[0001]Not ApplicableFEDERALLY SPONSORED RESEARCH[0002]Not ApplicableINCORPORATION-BY-REFERENCE OF MATERIAL SUBMITTED ON A COMPACT DISC, SEQUENCE LISTING, OR PROGRAM[0003]Not ApplicableBACKGROUND OF INVENTION[0004]1) Field of Invention[0005]This invention relates to techniques for the collection and processing of gravity, magnetic and other scalar potential data for the purposes of enhancing or increasing the quality and quantity of the information concerning depth and spatial resolution which is provided through the application of frequency-domain filtering techniques and related or similar residual techniques to one and two-dimensional gridded and interpolated surface representations of scalar potential data.[0006]2) Description of Related Art[0007]The primary goal of studying scalar potential data is to develop a better understanding of the subsurface geology of the Earth. Gravity data, for example, provide information about densities and spa...

Claims


Application Information

Patent Timeline
Patent Type & Authority Patents(United States)
IPC IPC(8): G06F19/00G01V9/00G01V7/00
CPCG01V7/00G01V3/38
Inventor MCDERMOTT, ANDREW MARTIN
Owner MCDERMOTT ANDREW MARTIN
Why Eureka
Eureka Blog
Learn More