Method and apparatus for regional image quantification verification

a regional image and quantification technology, applied in image analysis, instruments, computing, etc., can solve the problems of significant bottleneck in the software development timeline, the complexity of the modem graphics system, and the increase in the amount of time required to test and evaluate graphics softwar

Active Publication Date: 2006-08-15
ORACLE INT CORP
View PDF13 Cites 15 Cited by
  • Summary
  • Abstract
  • Description
  • Claims
  • Application Information

AI Technical Summary

Benefits of technology

[0009]The problems outlined above may, in some embodiments, be solved in part by limiting the number of reference images used for comparison in evaluating the accuracy of test images, by using a test program that renders only a pass or fail for a test image, and / or by relaxing the requirement that test image color values exactly match the color values in a reference image. Instead, test image color values that are within a user specified percentage of the average color value of a corresponding array of pixels in the reference image may be acceptable. In addition, the specified percentage can be tailored to fit the accuracy required for a given portion (or region) of the test image, or the rendering of a given object. In other embodiments, a test image is acceptable if there is an acceptable shift in corresponding pixel locations. This standard accepts a rendering process that shifts, enlarges, or shrinks an object within user specified limits. In still other embodiments, a user may define regions of interest with specific maximum differences for each region. This allows a user to specify the accuracy of certain regions of the test image as more critical than others and to focus a region on a particular object or group of objects with a narrow range of color values.
[0013]Still another embodiment of a test program for determining the accuracy of digital test images is identified herein as local image quantification verification. This test program may incorporate user-defined regions of interest with specific error tolerances for each region and may incorporate an image comparison that allows color value differences. Each pixel of a specified region of a test image may be compared to the corresponding pixel of a reference image, or to an average color value for a corresponding array of pixels in a reference image. If the color value of a test image pixel is within a specified difference from the color value of the corresponding reference image pixel, the test image pixel passes. If not, a larger array of pixels in the reference image is selected and the test is repeated. This sequence ends whenever the test image pixel passes, or when a specified maximum size array of reference image pixels is exceeded. A test image region may be unacceptably different from a reference image if for any pixel of the test image region, there is no corresponding reference image pixel or pixel array that has an array size or absolute color value difference less than or equal to user specified maximums. This method effectively blurs the reference image in progressive stages.

Problems solved by technology

Consequently, modem graphics systems must incorporate graphics processors with a great deal of complexity, and the color value of one pixel can be the accumulated result of many calculations involving several models and mathematical approximations.
As the complexity of the calculations and the layering of effects increased, the amount of time required to test and evaluate graphics software also increased and has become a significant bottleneck in the software development timeline.
There may be more than one bug in a software program, and the cumulative result may cause a pixel in an output image to be different from a pixel in a reference image.
It is not practical to generate a set of reference images for each of these combinations.
Consequently, the test program user is easily overwhelmed, since the test evaluation output (the difference image) is as complex as the test image.
Maintaining and updating the test programs is both time consuming and error prone.

Method used


Image

  • Method and apparatus for regional image quantification verification
  • Method and apparatus for regional image quantification verification
  • Method and apparatus for regional image quantification verification

Examples


Embodiment Construction

FIG. 1—Computer System

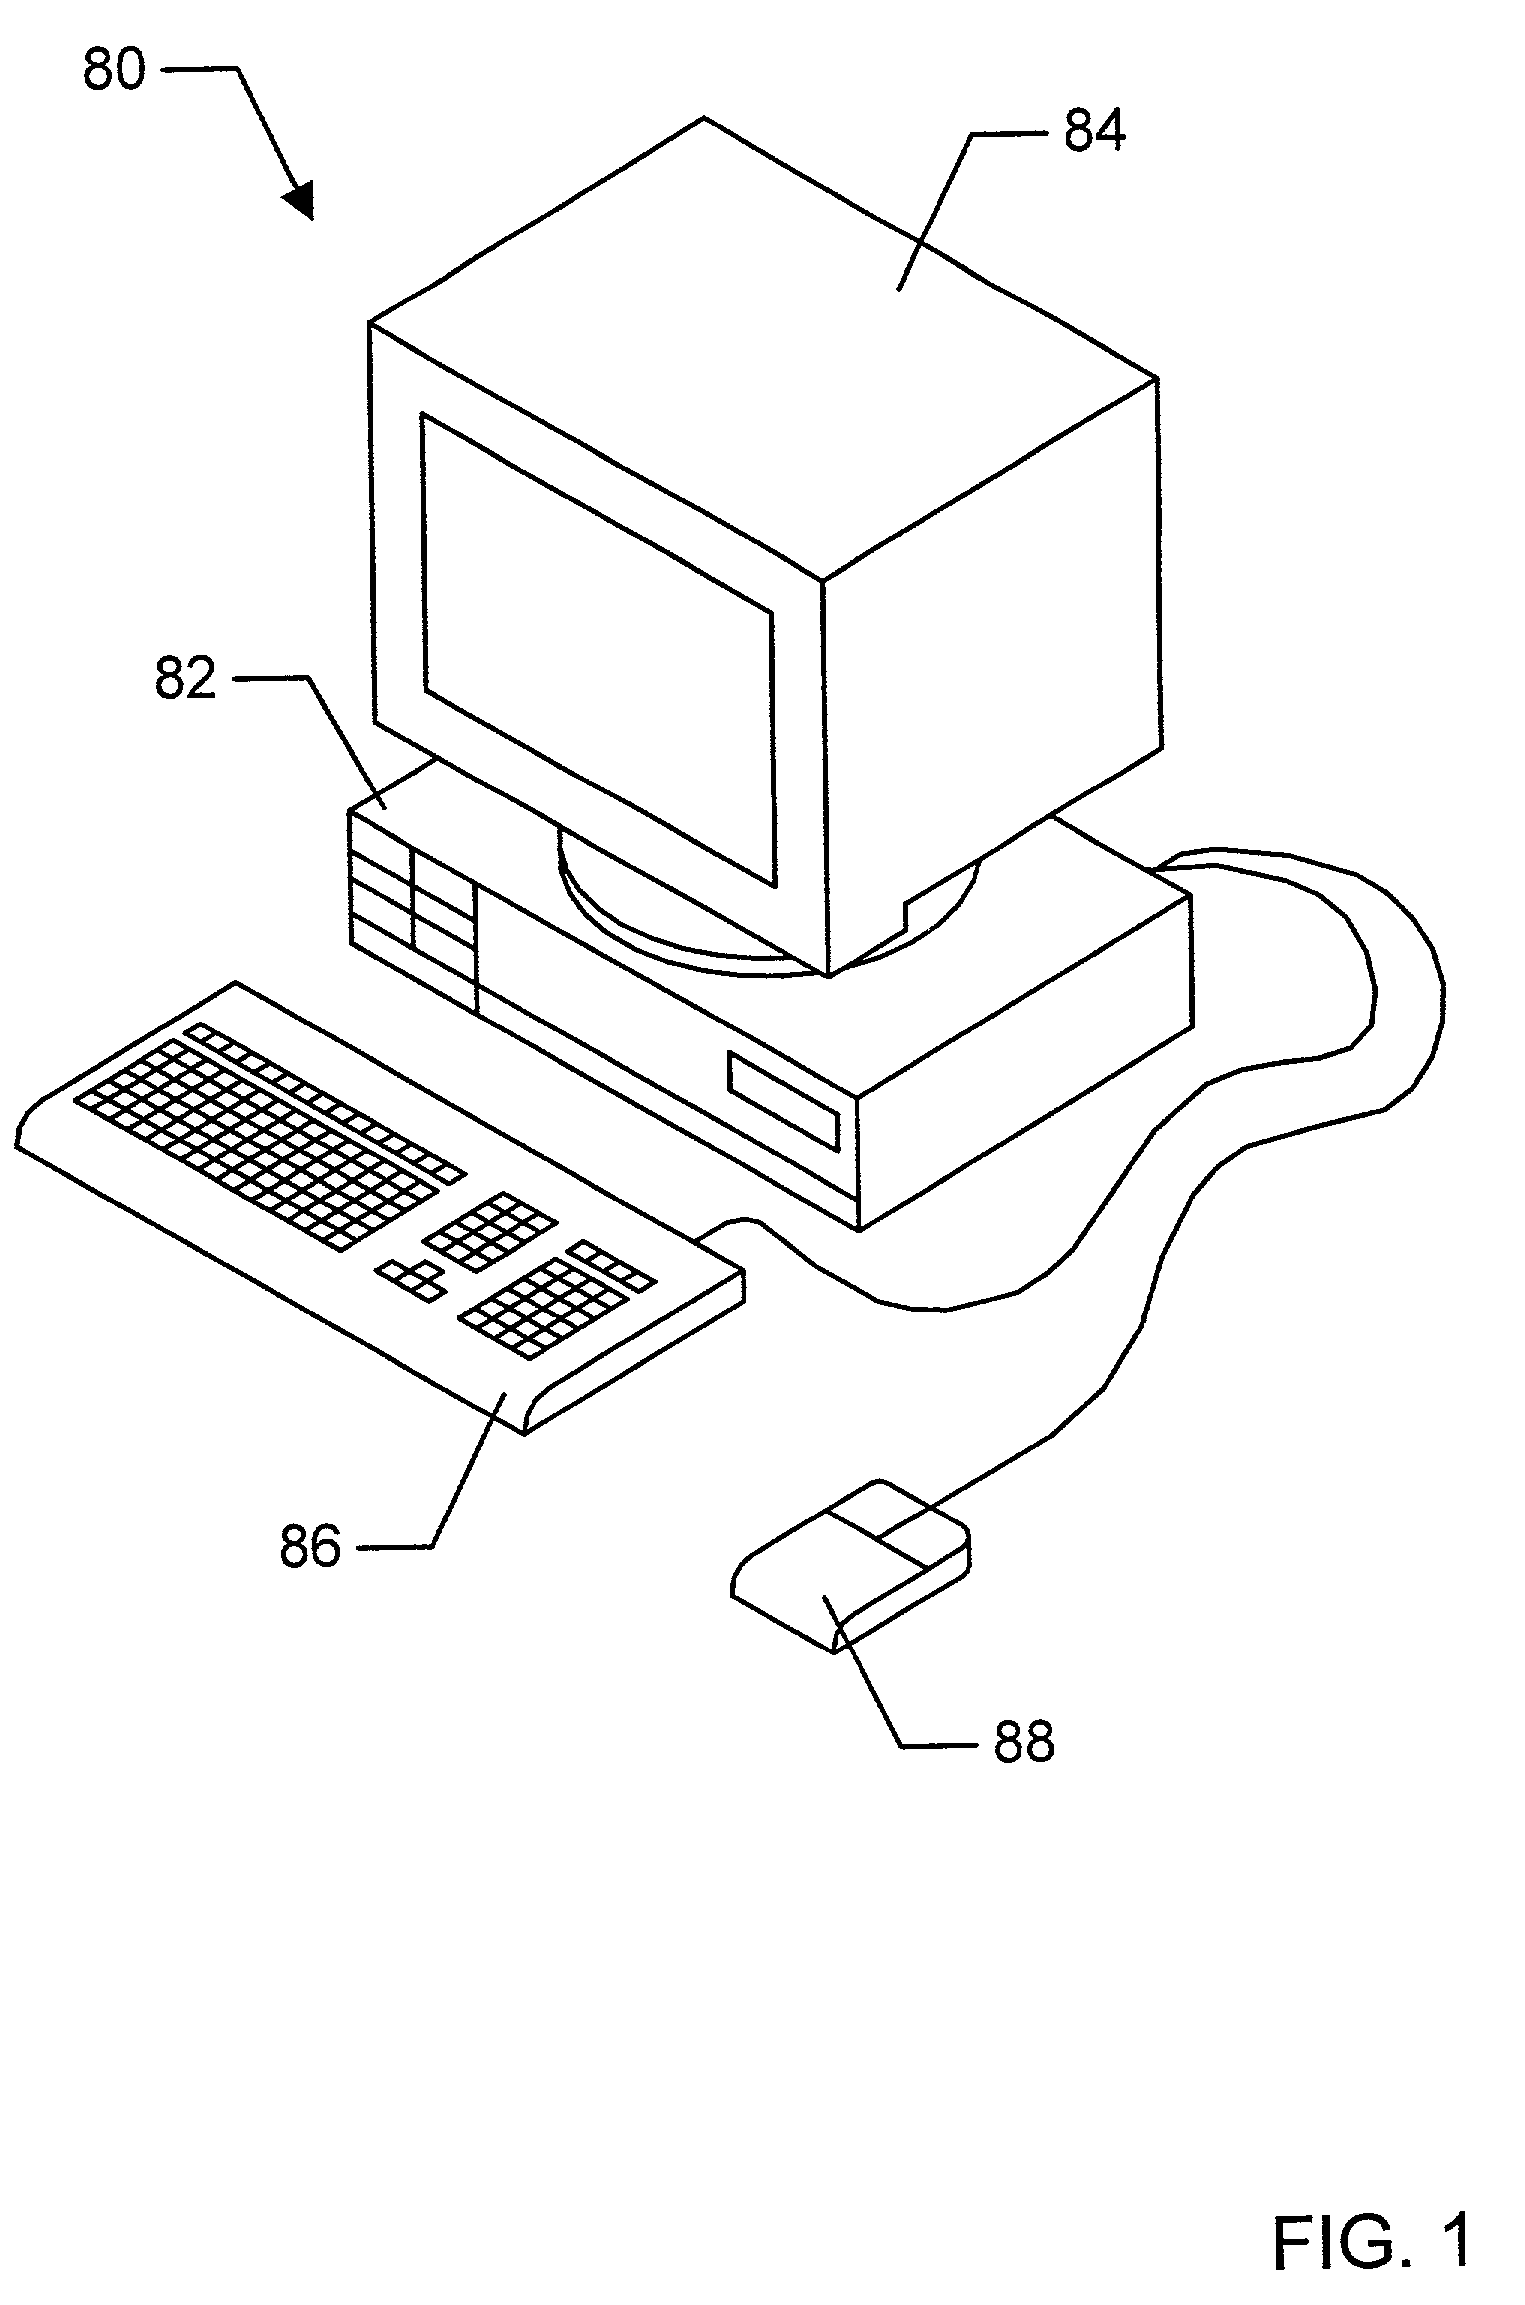
[0024]FIG. 1 illustrates one embodiment of a type of computer system 80 used to generate a test image and may also be configured to perform image quantification verification tests. The computer system 80 may be configured to include various devices, including a personal computer, a network PC, an Internet appliance, a television (including HDTV systems and interactive television systems), a personal digital assistant (PDAs), a virtual reality system, and other devices that display 2D and or 3D graphics, among others.

[0025]As shown, the computer system 80 includes a system unit 82 and a video monitor or display device 84 coupled to the system unit 82. The display device 84 may be any of various types of display monitors or devices (e.g., a CRT, LCD, or gas-plasma display). Various input devices may be connected to the computer system, including a keyboard 86 and / or a mouse 88, or other input device (e.g., a trackball, digitizer, tablet, six-degree of freedom inp...


PUM


Abstract

A method and apparatus are disclosed for testing the accuracy of digital test images generated by a computer graphics program executed on a computer graphics system. A test program is utilized to compare a test image with a reference image. Regional image quantification verification aims at an image comparison test that accepts minor color value differences and spatial shifts in rendered pixel values. The test image and reference image are divided into corresponding sub-regions. The average color value for each sub-region of the test image is compared to the average color value of the corresponding reference image sub-region and also to other nearby reference image sub-regions. A test image is unacceptably different from a reference image, if for any sub-region of the test image, no reference image sub-region is found with an average color value difference and spatial shift less than specified maximums.

Description

BACKGROUND OF THE INVENTION[0001]1. Field of the Invention[0002]This invention relates generally to the field of computer software and computer program testing. More specifically, it relates to verification of graphics images produced by a computer graphics program.[0003]2. Description of the Related Art[0004]Early graphics systems were limited to two-dimensional (2D) graphics and acted as simple translators or interfaces to a display device. Modem graphics systems, however, must support three-dimensional (3D) graphics with textures and many special effects such as anti-aliasing, texture mapping, advanced shading, fogging, alpha-blending, and specular highlighting. Modem computer displays have many more pixels, greater color depth, and are able to display more complex images with higher refresh rates than earlier models. Consequently, modem graphics systems must incorporate graphics processors with a great deal of complexity, and the color value of one pixel can be the accumulated r...

Claims


Application Information

Patent Timeline
Patent Type & Authority Patents(United States)
IPC IPC(8): G06K9/62G06K9/64G06T7/00G06T15/00
CPCG06K9/6203G06T15/00G06T7/001G06V10/7515
Inventor HSIEH, TEH-MING
Owner ORACLE INT CORP
Why Eureka
Try Eureka