Micro arrays with structured and unstructured probes

a micro array and probe technology, applied in the field of nucleic acids, to achieve the effect of reducing background nois

Inactive Publication Date: 2006-08-22
AGILENT TECH INC
View PDF17 Cites 48 Cited by
  • Summary
  • Abstract
  • Description
  • Claims
  • Application Information

AI Technical Summary

Benefits of technology

[0010]The invention also provides a method for determining a first signal produced by an unstructured probe bound to a target on a micro array. The method comprises illuminating an unstructured probe on a micro array to produce a first signal, illuminating a structured probe attached to a micro array to produce a second signal, and comparing the first signal produced from the unstructured probe to the second signal produced from the structured probe to determine a more accurate first signal. The invention provides both uniformity across an array and decreased background noise.

Problems solved by technology

The utilization process, however, provides a number of problems (i.e hybridization) related to reading the signals that are produced from the probes on the array surface.
Also, it is know that these contaminants not only interfere or effect the final fluorescence signal produced by the probe bound to the target, but also the background signal inside the feature areas.
The most important problem with this technique is that these areas may have been bound or affected by a fluorescent contaminant or some other stray contaminant that interferes with the fluorescent signal that is produced.
However, cited references or art are not admitted to be prior art to this application.

Method used


Image

  • Micro arrays with structured and unstructured probes
  • Micro arrays with structured and unstructured probes
  • Micro arrays with structured and unstructured probes

Examples


example 1

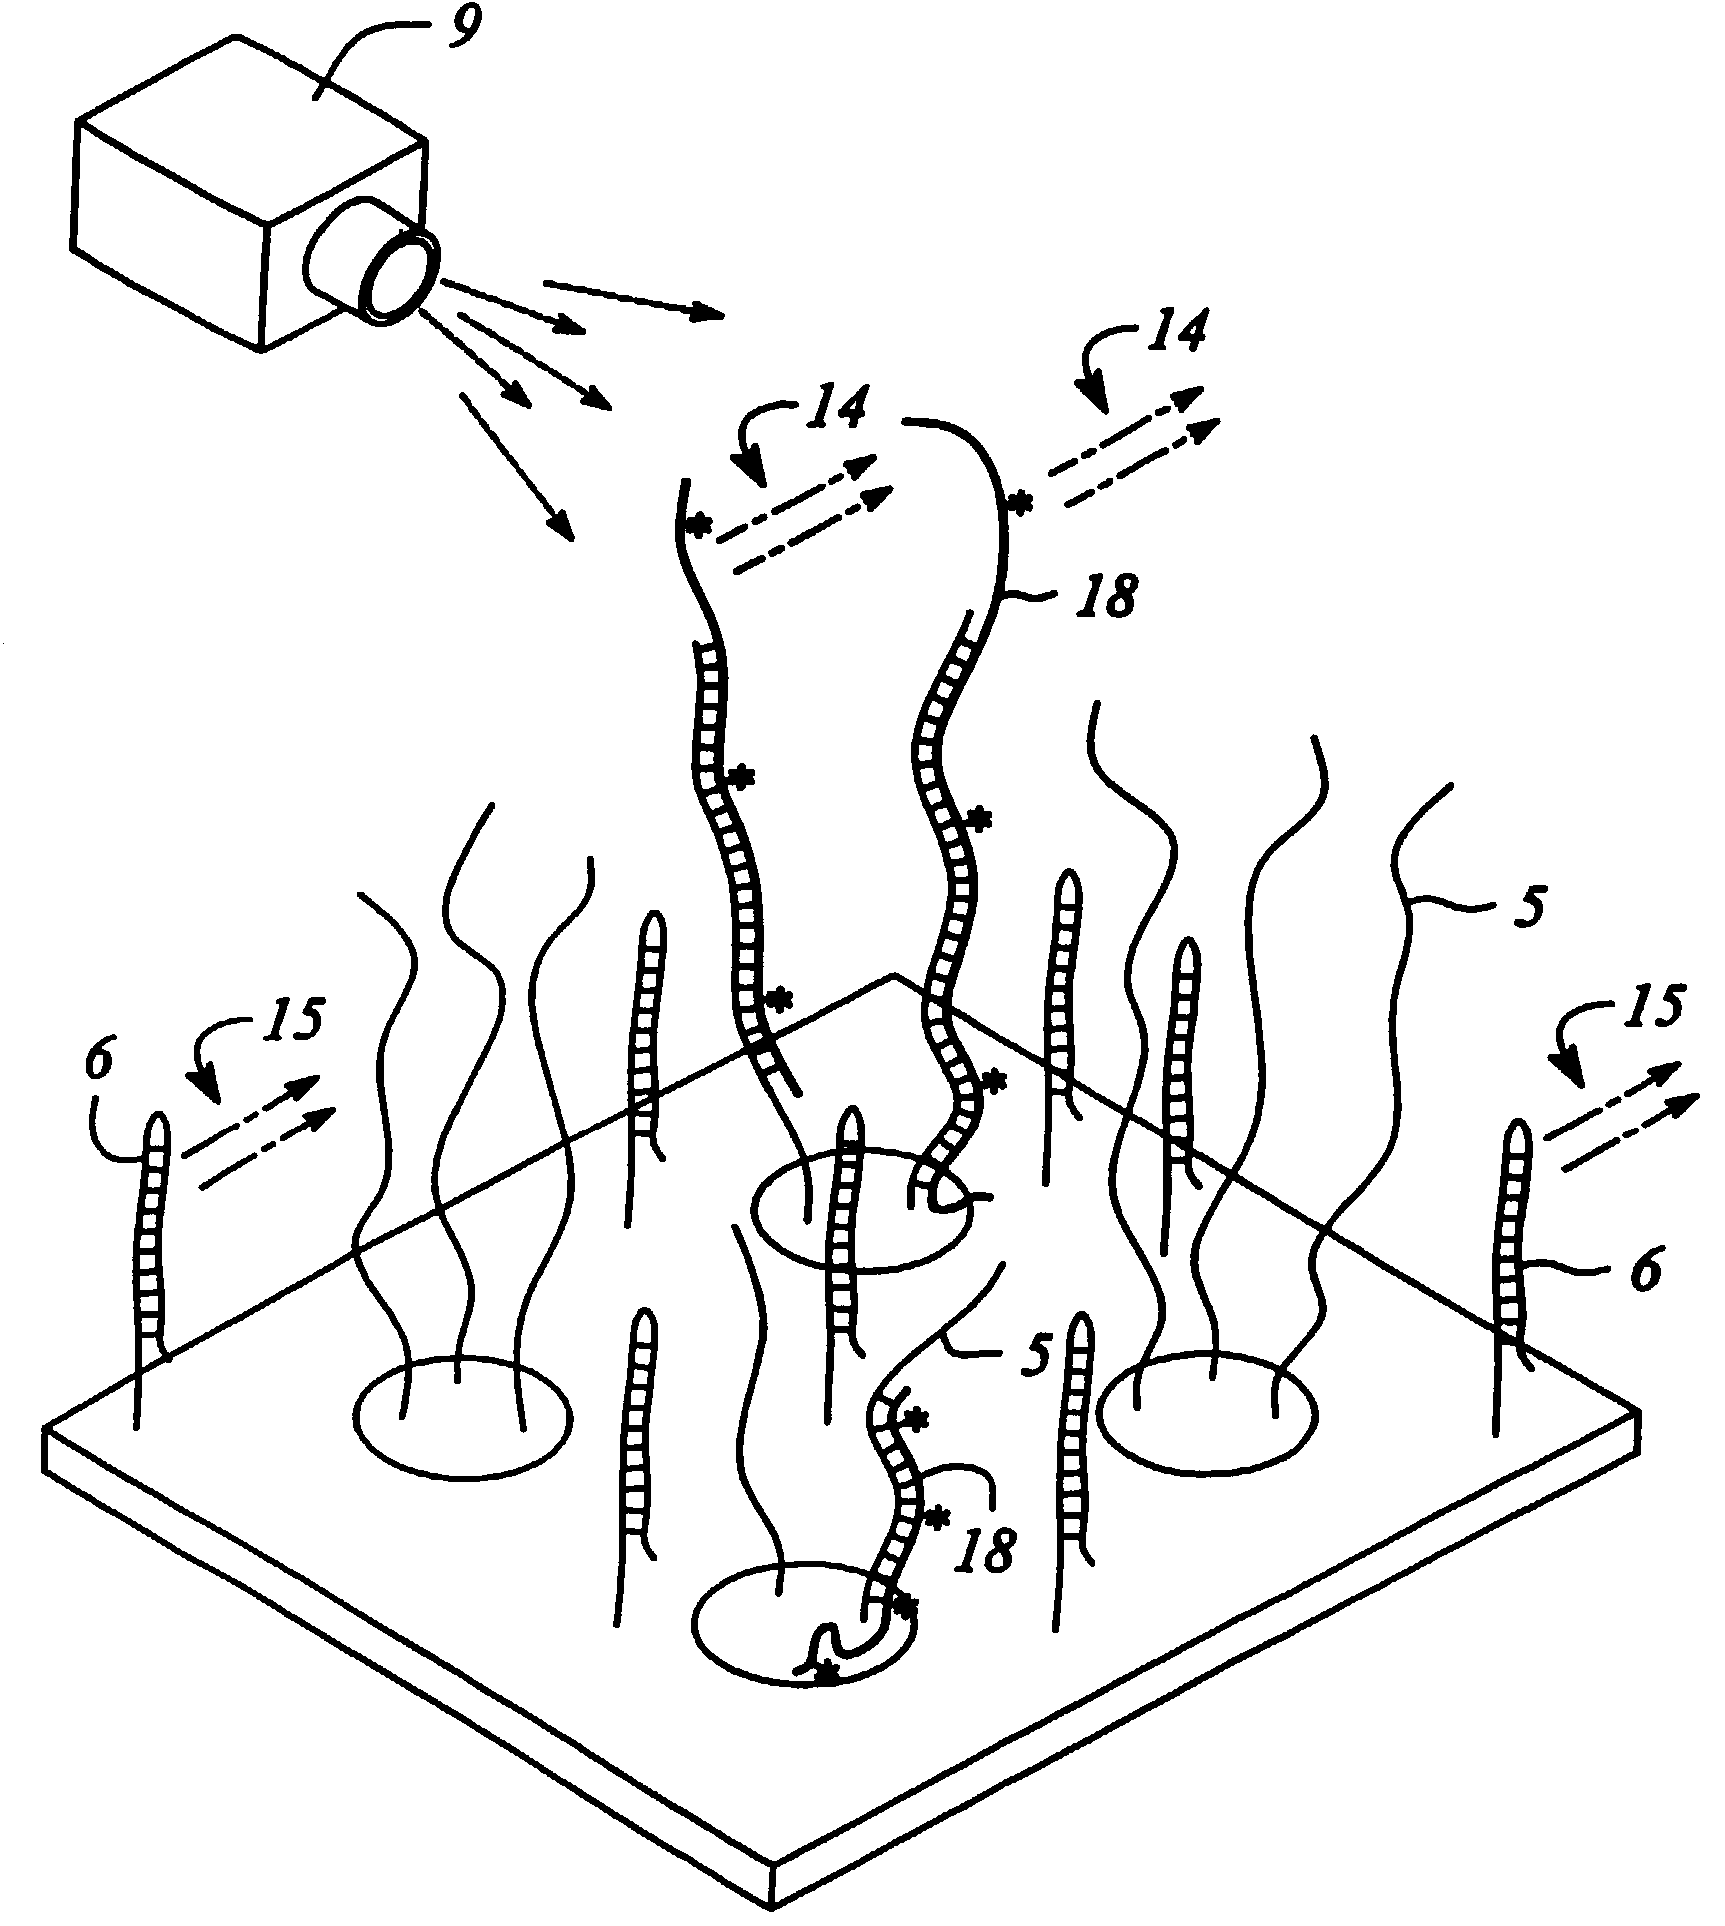
[0056]FIG. 7 shows a micro array with attached unstructured probes 5 and structured probes 6 to a substrate surface 11a. Micro arrays and samples were prepared according to protocols previously described. The figure shows the high intensity level of the unstructured probes 5 bound to the labeled target 18 (light yellow or green shows strong signal). Areas of no signal are indicative of where the structured probes 6 have been positioned on the substrate surface 11a.

example 2

[0057]FIG. 8 shows a comparison of the signal intensities produced by various channels across the substrate surface 11a. In particular, the intensities in both the green and red channels are similar and then drop off at various positions across the array surface where the structured probes 6 have been positioned (roughly channel columns 915–945).

example 3

[0058]FIG. 9 shows a set of plots comparing performance of GD3 negative control probes plotted against background mean signal (10 array). The graph on the left shows the averaged red vs. green background subtracted signal for the negative control probe GD3 for 10 replicate arrays. The right graph shows that average red and green background mean signals on the same arrays. Comparing the two graphs demonstrates that the negative control probe has a lower background than the average background mean signal for the slide and is better suited to be used for background correction. Each point is the average of 20 probes. Description of the experiment: Human Hela cDNA targets were generated from 20 mg of total RNA by incorporation of cyanine 5 or cyanine 3 using the Agilent Direct Labeling Kit. The cyanine-3 and cyanine-5 targets were mixed and hybridized to each Agilent cDNA microarray for 17 hours at 65 degrees centigrade. The slides were washed, scanned on an Agilent scanner and feature e...


PUM

PropertyMeasurementUnit
diameteraaaaaaaaaa
diameteraaaaaaaaaa
diameteraaaaaaaaaa

Abstract

The invention provides an apparatus and method for determining a signal produced by a micro array device. The apparatus provides an unstructured probe and structured probe. The unstructured probe binds to a target and provides a first signal that can be compared to a second signal produced by a structured probe. A more accurate level of intensity of the first signal can be determined by comparing to the second signal produced by the structured probe. A method for determining a more accurate level of signal intensity produced from the unstructured probes bound to the target is also disclosed.

Description

FIELD OF THE INVENTION[0001]The present invention relates to the field of nucleic acids and more particularly toward structured probes for use with micro array devices.BACKGROUND OF THE INVENTION[0002]Various arrays of polynucleotides (such as RNA and DNA) are known and used in genetic testing, screening and diagnostics. Arrays are defined by the regions of different biopolymers or nucleotides arranged in a predetermined configuration on a substrate. Most importantly, the arrays when exposed to a population of analytes will exhibit a pattern indicative of the presence of the various components separated spatially. Array binding patterns of polynucleotides and / or peptides can be detected by using a variety of suitable target labels. Once bound to the array, these target labels can then be quantified and observed and the overall pattern on the array determined.[0003]A number of methods have been designed for manufacturing micro arrays. DNA micro arrays are particularly useful for anal...

Claims


Application Information

Patent Timeline
Patent Type & Authority Patents(United States)
IPC IPC(8): C12Q1/68C07H21/04C12M1/36G01N33/53B01J19/00C12N15/09C40B30/04C40B40/06C40B40/10C40B40/12C40B50/14C40B60/14G01N21/01G01N21/78G01N33/566G01N33/68G01N37/00
CPCB01J19/0046B82Y30/00C40B30/04C40B60/14B01J2219/00378B01J2219/00387B01J2219/00549B01J2219/00576B01J2219/00585B01J2219/0059B01J2219/00596B01J2219/00605B01J2219/00608B01J2219/00626B01J2219/00637B01J2219/00659B01J2219/00662B01J2219/00675B01J2219/00677B01J2219/00707B01J2219/00722B01J2219/00725B01J2219/00731C40B40/06C40B40/10C40B40/12C40B50/14B01J2219/00274
Inventor LEPROUST, ERIC M.HIRSCHBERG, DAVID L.DELENSTARR, GLENDA C.
Owner AGILENT TECH INC
Why Eureka
Try Eureka