Crossplot analysis of A.V.O. anomolies in seismic surveying

a technology of cross-plot analysis and seismic surveying, which is applied in the field of cross-plot analysis of a.v.o. anomalies in seismic surveying, can solve the problems of large seismic 3-d survey volume, inability to carry out manual matching by simple inspection, and often misses of geologists, so as to enhance said seismic section and enhance said 3d seismic image

Active Publication Date: 2006-08-22
ASPEN PARADIGM HLDG LLC
View PDF2 Cites 14 Cited by
  • Summary
  • Abstract
  • Description
  • Claims
  • Application Information

AI Technical Summary

Benefits of technology

[0076]The apparatus may be configured to apply said color coding from said events to respective values in a seismic section from which said events originate, thereby to enhance said seismic section by providing an indication of likely hydrocarbon location.
[0077]The apparatus may be configured to apply said color coding from said events to respective values in a 3D seismic image from which said values originate, thereby to enhance said 3D seismic image by providing therein an indication of likely hydrocarbon location.

Problems solved by technology

Seismic 3-D surveys are very large and contain gigabytes and even terabytes of data.
Double plots of the kind shown in FIG. 5 can disclose A.V.O. anomalies, howeverdue to the size of typical surveys it is not practical for the matching to be carried out manually by simple inspection.
A geologist may often miss an AVO anomaly when inspecting dual attribute datasets.
However, one disadvantage is that, unlike the double plotting of FIG. 5, the crossplot itself loses the location information of the point mapped.
The problem with Conventional AVO Crossplotting
Unfortunately, reality is not as kind as FIG. 7 implies.
In reality the separation of AVO anomalies from the rest of the data using AVO crossplotting does not work in most cases.
All the data is concentrated together and there is no way of reliably discriminating between AVO and non-AVO effects.
Hence, each reflection is contaminated by the shape of the source function—the wavelet.
The wavelet variations lead to distortions, which affect the AVO attributes and typically distort the simplified picture, causing a scatter of points around the lines of FIG. 13.
The extent of the scattering is such that it is difficult to resolve between the different trend lines, and thus recognizable clustering is not seen.
However, be that as it may, the two datasets in the crossplot space of FIG. 15 cannot be separated because they do not form distinct clusters.
Again when color coded it is easy to see that the data lines up along two different trend lines, but without prior knowledge there is no way of identifying the trends.
Hence, theoretical division of the crossplot space to different AVO regions turns out to be unrealistic because there is no one-to-one mapping of crossplot space to AVO signatures.

Method used


Image

  • Crossplot analysis of A.V.O. anomolies in seismic surveying
  • Crossplot analysis of A.V.O. anomolies in seismic surveying
  • Crossplot analysis of A.V.O. anomolies in seismic surveying

Examples


Embodiment Construction

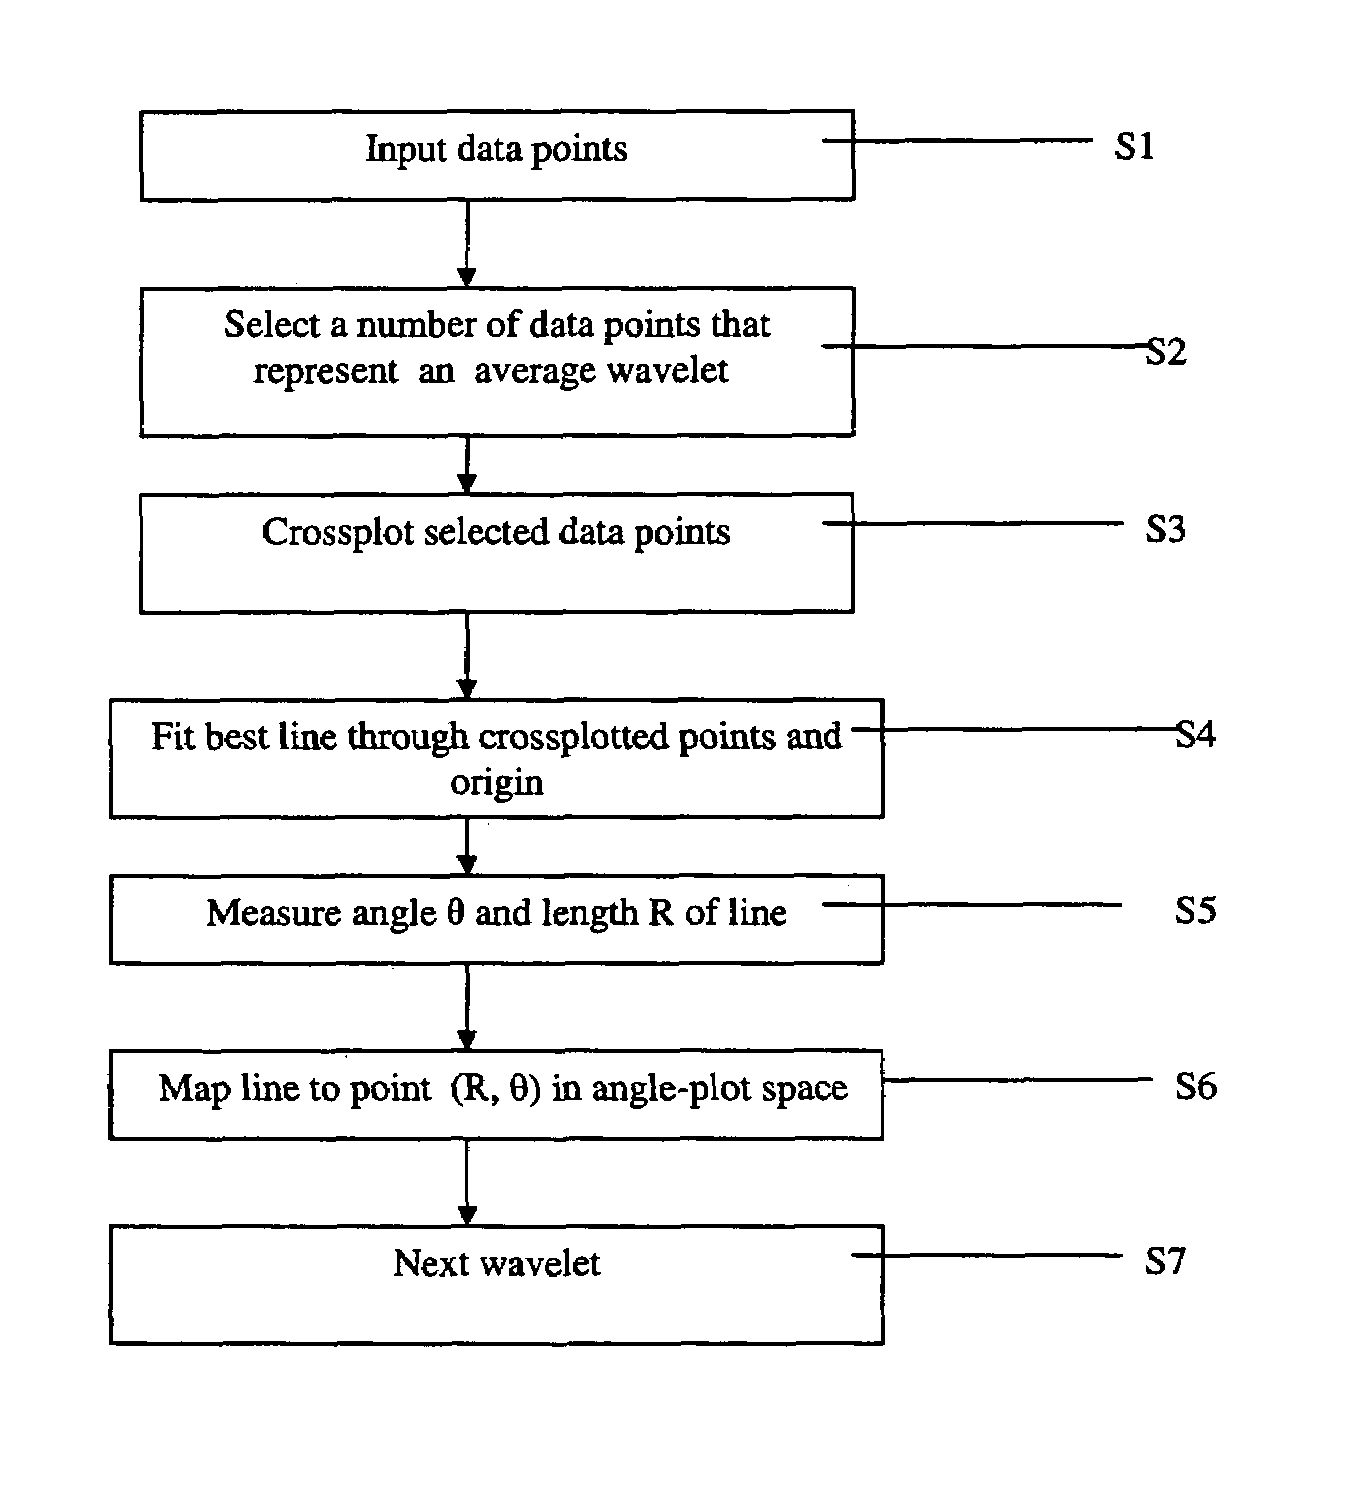
[0128]The present embodiments provide a method and apparatus for analyzing the incoming data per wavelet. Each wavelet rather than each data point is treated as a single event. Note that a wavelet here corresponds to a fixed number of data samples that encompass the length of a typical wavelet in the dataset. The data points of the wavelet are plotted in crossplot space and a best fit line is fitted to the data of the individual wavelet. The angle and length of the best fit line are then plotted in angle-plot space, where the plots are found to cluster into the respective A.V.O. anomaly classes and non-anomaly data. The double plotting procedure as described above is referred to hereinbelow as the crossplot—angleplot procedure.

[0129]The use of the crossplot—angleplot procedure as described above on seismic imaging data according to the embodiments of the present invention allows for separation, that is clustering of A.V.O. anomaly data from non-A.V.O. anomaly data in crossplot space...


PUM


Abstract

A method of seismic data analysis to provide clustering of A.V.O. data into A.V.O. anomaly types, the method comprising: obtaining successive values of a plurality of seismic attributes, each seismic attribute comprising a respective property of a seismic reflection event, grouping said values using a running window of a predetermined size into a plurality of groups, for each group identifying first and second parameters corresponding to said first and second attributes, and plotting each group as a single event based on said group parameters, said group parameters having been selected to cause clustering of said seismic reflection events on said plot according to the presence or absence of A.V.O. anomalies.

Description

FIELD AND BACKGROUND OF THE INVENTION[0001]The present invention relates to improvements to crossplot analysis of A.V.O. anomalies in seismic surveying and, more particularly, but not exclusively to apparatus and a method for identifying an A.V.O. anomaly indicative of the presence of oil or gas, via an improved A.V.O. crossplot.[0002]Seismic surveying is the basic technology used for imaging the subsurface for oil exploration. Seismic surveying involves the transmission of sound energy into the subsurface and recording the echoes that are reflected from the boundaries between the layers in the subsurface. The recorded signal is processed and displayed as seismic sections. FIG. 1 is an example of a typical seismic section in which the vertical axis represents depth and the horizontal axis represents surface distance. The seismic section in FIG. 1 is a vertical cross-section of the sub-surface, showing layers 10, faults 12, folds 14 and other subsurface features. Using such sections ...

Claims


Application Information

Patent Timeline
Patent Type & Authority Patents(United States)
IPC IPC(8): G01V1/28G01V1/34G01V1/30
CPCG01V1/30G01V2210/632
Inventor CANNING, ANAT
Owner ASPEN PARADIGM HLDG LLC
Why Eureka
Try Eureka