Positioning technique

a positioning technique and positioning technology, applied in the field of positioning techniques, can solve the problems of grossly inaccurate positioning estimation, and achieve the effects of reducing the resolution, improving the quality of data mining operations, and facilitating analysis

Active Publication Date: 2007-11-20
AIRISTA FLOW INC +1
View PDF14 Cites 61 Cited by
  • Summary
  • Abstract
  • Description
  • Claims
  • Application Information

AI Technical Summary

Benefits of technology

[0014]An advantage of the invention is that the target device's reported location moves naturally, that is, the target device does not appear to move through walls or other obstacles. Another advantage is that the graph serves as a good basis for establishing the probabilistic model on the basis of calibration measurements or calculations. If the graph nodes are also used as sample points of the probabilistic model, the positioning system is most accurate in areas where the target devices are likely to move.
[0015]If the target device's location is interpreted as a point or node of the graph, the target device's movements are easier to analyze by computers. In other words, the reported locations, being interpreted as points or nodes on a well-defined graph, are a much better source for data mining operations than are arbitrary locations, without any quantification. For example, a department store designer may want to search for patterns or correlations in customer movement. If the graph nodes are located at certain desks, it is rather easy to see if a client who stopped at desk x also passed by desk y. Without the graph, and the inherent quantification, the designer would have to look for coordinates within a certain area near each desk. Each graph node is a permissible location but a permissible location is not necessarily a graph node. The distance between nodes should be selected on the basis of the desired resolution. In other words, whoever drafts the graph, must answer the following question: how far off can a reported location be from the true location? The answer depends on the nature of a typical target device. If the target device is a communication device carried in person, an error of several meters may be acceptable because persons can easily be recognized from a distance of several meters. On the other hand, if the target devices comprise hospital instruments or the like, a smaller resolution is desirable. In most applications, the resolution (inter-node distance) is approximately one meter. A smaller distance gives a better resolution at the cost of increased consumption of resources. The consumed resources include calibration measurements, memory for storing the probabilistic model and computation power. Open spaces can be treated as a grid of horizontal and vertical arcs. Since visibility is good in open spaces, a coarser-than-normal resolution may be acceptable.
[0016]The graph G can be connected to the Hidden Markov Model as follows. Let d be a typical distance between points along an arc. The typical distance is the same as desired resolution, such as one meter. Let S={s1, s2, . . . sk} be the set of points along the arc such that the inter-point distance is d. S can be used as the value domain for the hidden state variables qi of the Hidden Markov Model.
[0017]The graph G is preferably used in connection with a set of transition probabilities between the graph nodes. Transition probabilities P(qt|qt−1) can be defined so that the probability for a transition from si to sj, i.e., P(qt=sj|qt−1=si), is non-zero only if a target device can make that transition in a period of time that fits between two observations.
[0018]Two alternative techniques for using the transition probabilities will be described. The first technique is based only on the speed of a typical target device, the period of time between observations and the distance between points. Let dmax be the maximum distance travelled by a typical target device within a maximum period of time between observations. Any transition over dmax in length has a probability of zero or very close to zero. For example, people rarely move faster than 2 m / s in typical indoor environments. Thus, if the time between two observations is 1 s, the probability of any transition over two meters in length is zero, or at least very low. (A non-zero probability means, for example, that people rarely run but running is not strictly prohibited.)
[0019]The second technique for transition probabilities is based on the concept of neighbours or closely-connected points. Two points, si and sj are neighbours if one can be reached from the other via arcs of A without visiting any other point of S. The neighbour-based technique is elegant in the sense that the set of arcs in G is also the set of permissible transitions, which simplifies computation. A slight drawback is the fact that a fast-moving target device's position is reported with a delay. Assume that the target device moves quickly but linearly to a node three nodes away from its previous estimated location. Since only transitions to neighbours are permitted, the location estimate must proceed via all of the intervening nodes, which causes a delay of three observation periods.

Problems solved by technology

It is possible for two or more locations to have near-identical sets of signal values, and a location estimate may be grossly inaccurate.

Method used


Image

  • Positioning technique
  • Positioning technique
  • Positioning technique

Examples


Embodiment Construction

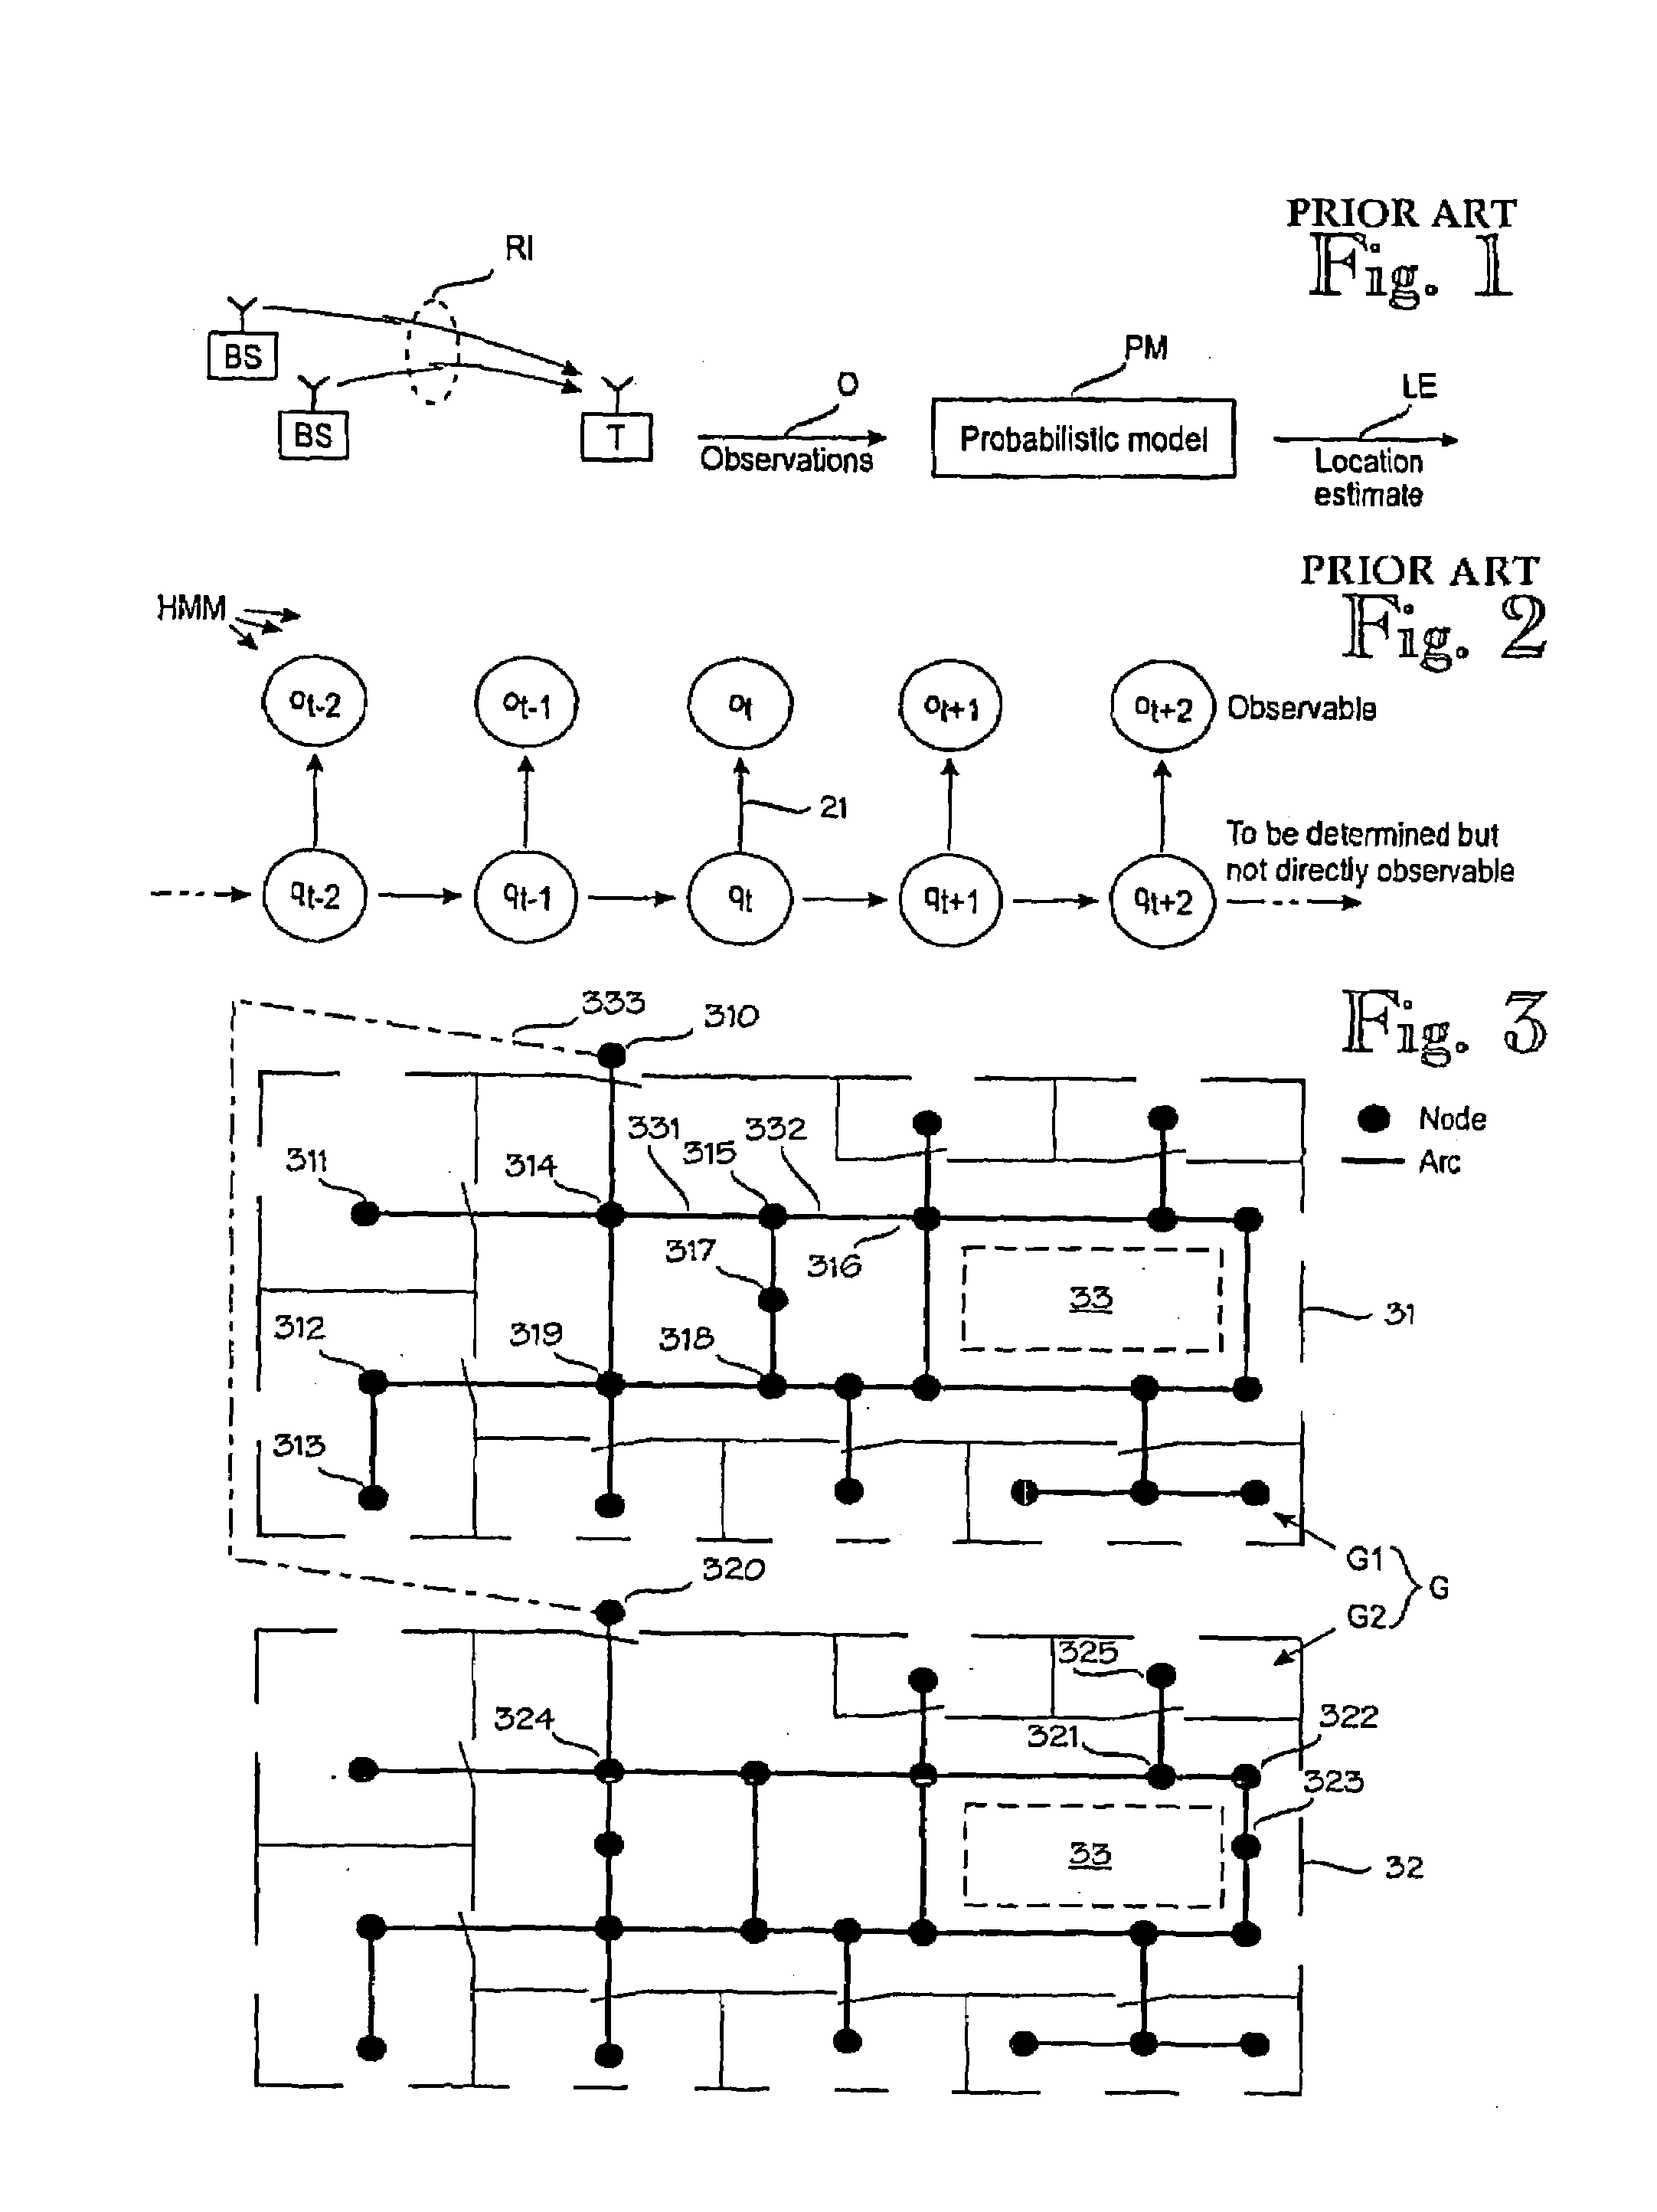
[0032]FIG. 3 illustrates a graph G according to the invention. In this example the graph G comprises two subgraphs G1 and G2 such that subgraph G1 corresponds to the floor plan 31 of the first floor and subgraph G2 corresponds to the floor plan 32 of the second floor. The graph comprises nodes, drawn as black circles, such that each node indicates a permissible location for a target device. The distance between nodes should be selected on the basis of the desired resolution. In most applications, the resolution (inter-node distance) is approximately one meter. A smaller distance gives a better resolution at the cost of increased consumption of resources. The consumed resources include calibration measurements, memory for storing the probabilistic model and computation power. For most office rooms, a single node is sufficient, such as the node 311 in the upper left-hand room. On the other hand, larger rooms may have more nodes such as the nodes 312 and 313 in the lower left-hand room...


PUM


Abstract

A target device's location in a radio network is estimated by maintaining a probabilistic model for several sample points that indicate expected distributions of signal values at a given location. The target device observes signal values, wherein the sequence of observations and the respective locations constitute a Hidden Markov Model. A graph models the topology of the positioning environment. The graph indicates several nodes which are permissible locations in the environment and several arcs which are permissible transitions between two nodes. The graph is used to estimate the target device's location based on the probabilistic model and the sequence of observations.

Description

[0001]This is a Continuation application of International Application No. PCT / FI03 / 00553, filed Jul. 8, 2003, which relies on priority from Finnish Application No. 20021357, filed Jul. 10, 2002, the contents of both of which are hereby incorporated by reference in their entireties.BACKGROUND OF THE INVENTION[0002]The invention relates generally to a positioning technique in which a target device's location is estimated on the basis of a sequence of observations on the target device's wireless communication environment. FIG. 1 schematically illustrates an example of such a positioning technique. A target device T communicates via base stations BS via a radio interface RI. In this example, the communication is assumed to be radio communication. The target device T observes signal values at the radio interface RI. The observations O are applied to a probabilistic model PM that models the target device's wireless communication environment and produces a location estimate LE. As used her...

Claims


Application Information

Patent Timeline
Patent Type & Authority Patents(United States)
IPC IPC(8): H04Q7/20H04B17/00G01S5/10G01S5/02G06F9/45H04W64/00
CPCH04W64/00G01S5/0252G01S5/02528
Inventor MISIKANGAS, PAULILEKMAN, LARE
Owner AIRISTA FLOW INC
Why Eureka
Try Eureka