
System and method for prediction of behavior in financial systems

a financial system and computer-based system technology, applied in the field of computer-based system and method for organization and prediction of behavior in complex systems, can solve the problems of large statistical uncertainty and biases in the derived model parameters, model can end up with too many parameters, improper representation of the system, etc., to accurate measurement and prediction of properties, and minimize the complexity of algebraic models

Inactive Publication Date: 2008-02-05
PIXON
View PDF8 Cites 28 Cited by
  • Summary
  • Abstract
  • Description
  • Claims
  • Application Information

AI Technical Summary

Benefits of technology

[0011]It is an advantage of the present invention to provide a method for minimizing the complexity of algebraic models for modeling the behavior of complex systems.
[0012]It is another advantage of the present invention to provide a method for minimizing the complexity of algebraic models used for modeling complex systems in a practical amount of time using a conventional computer.
[0013]Yet another advantage of the invention is to provide an accurate measurement and prediction of the properties of complex systems.
[0014]Still another advantage of the present invention is to provide a method for minimizing the number of factors that are required for modeling of behavior in a complex system.
[0015]It is another advantage of the present invention to provide a method for minimizing the number of factors needed to characterize a complex system in a practical amount of time using a conventional computer.
[0016]It is yet another advantage of the present invention to provide a method for assessment of risk and volatility in securities and other financial investments.

Problems solved by technology

Because of the complexity of the data and the presence of sampling errors, the model can end up with too many parameters, the quantity of which can equal, or even exceed, the number of data points.
This is a common problem in nonparametric analysis, where using too many parameters leads to large statistical uncertainty and biases in the derived model parameters, and in the correlations among them.
Conversely, the removal of too many parameters can result in an improper representation of the system, since adequate fitting of a model to the system requires a minimum of P parameters.
While minimum complexity has a clear theoretical advantage, it can be computationally intensive, making it difficult to reach a conclusion in a period of time that would permit practical application, unless the parameterization of the system in known in advance.
Even after a language is chosen, the set of all possible parameterizations with that language can become too large to search practically.
However, the choice of P elements among N(N+1) / 2 is a combinatorially large problem and an exhaustive evaluation of all of the possibilities is not practical.
Others in the field have proposed prediction and risk assessment techniques based using covariance matrices, with some developing relatively complex models with a large number of variables, thus producing a computationally-intensive model.
For the same reason, a minimum complexity model does not show signal-correlated residuals, and hence provides unbiased source strength measurements to a precision limited only by the theoretical limits set by the noise statistics of the data.
This is because a minimum complexity model only has sufficient parameters to describe the structures that are required by the data and has none left over with which to create false sources.

Method used

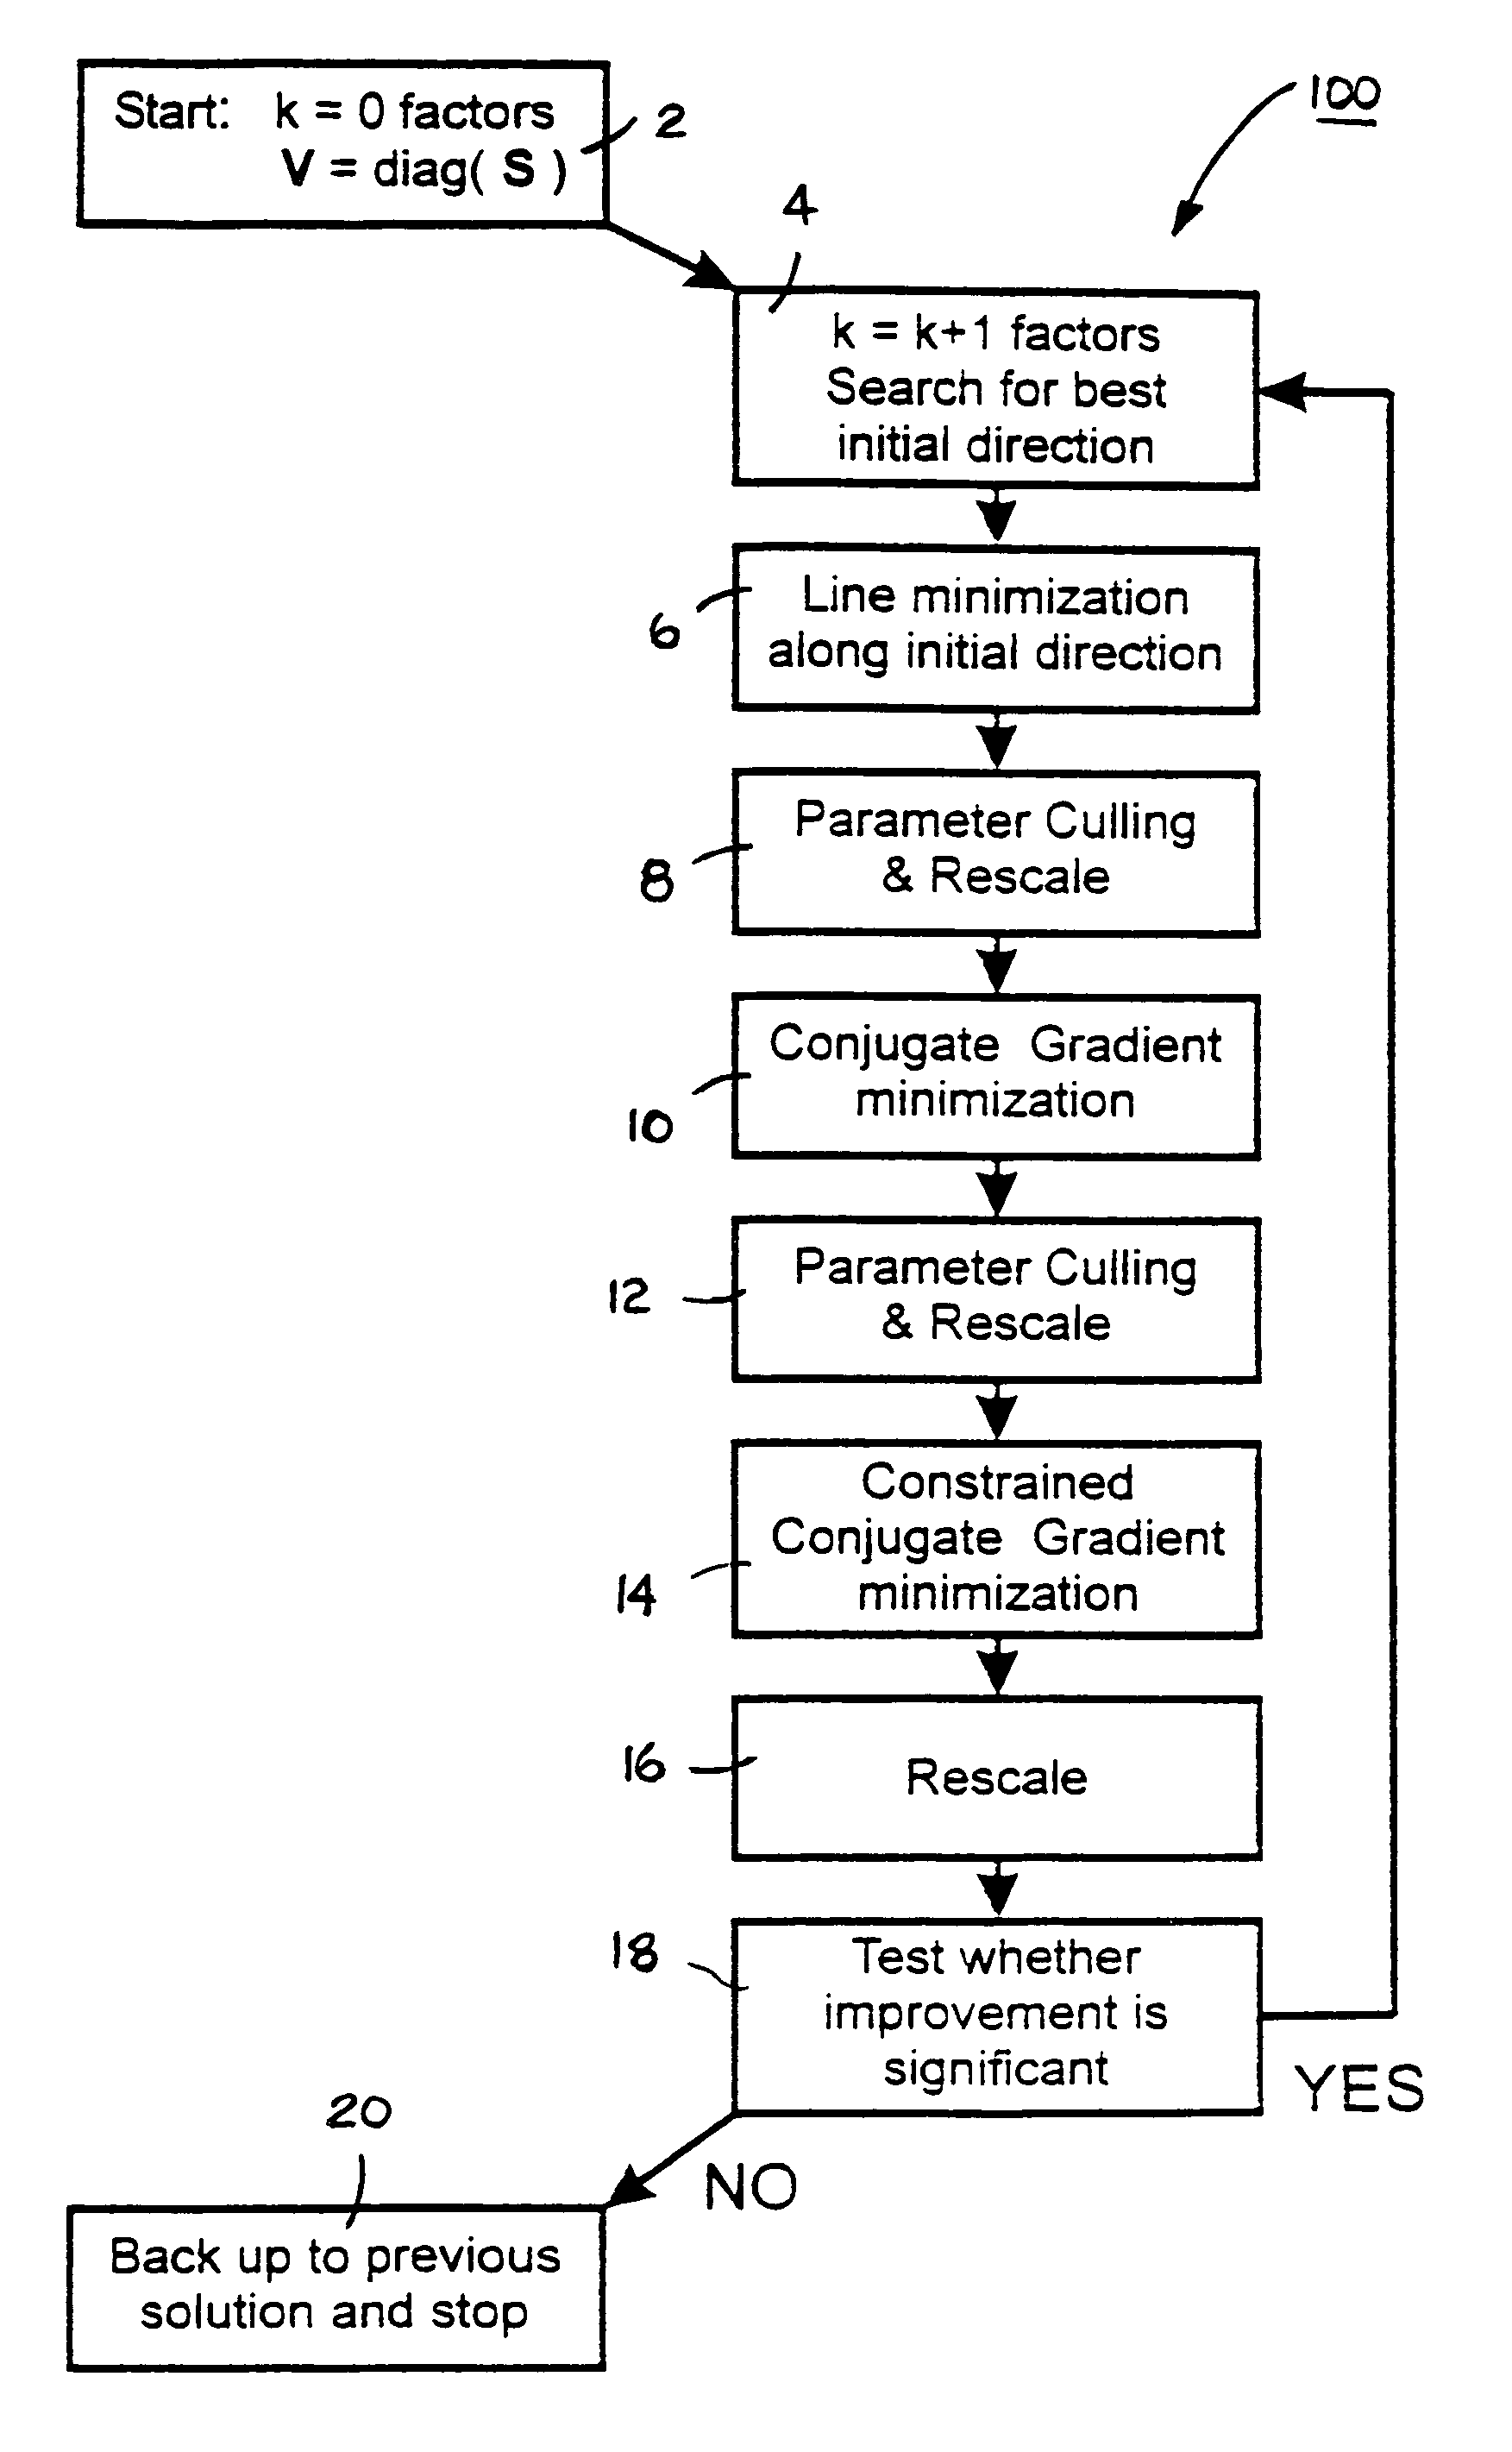

Image

  • System and method for prediction of behavior in financial systems
  • System and method for prediction of behavior in financial systems
  • System and method for prediction of behavior in financial systems

Examples


example 1

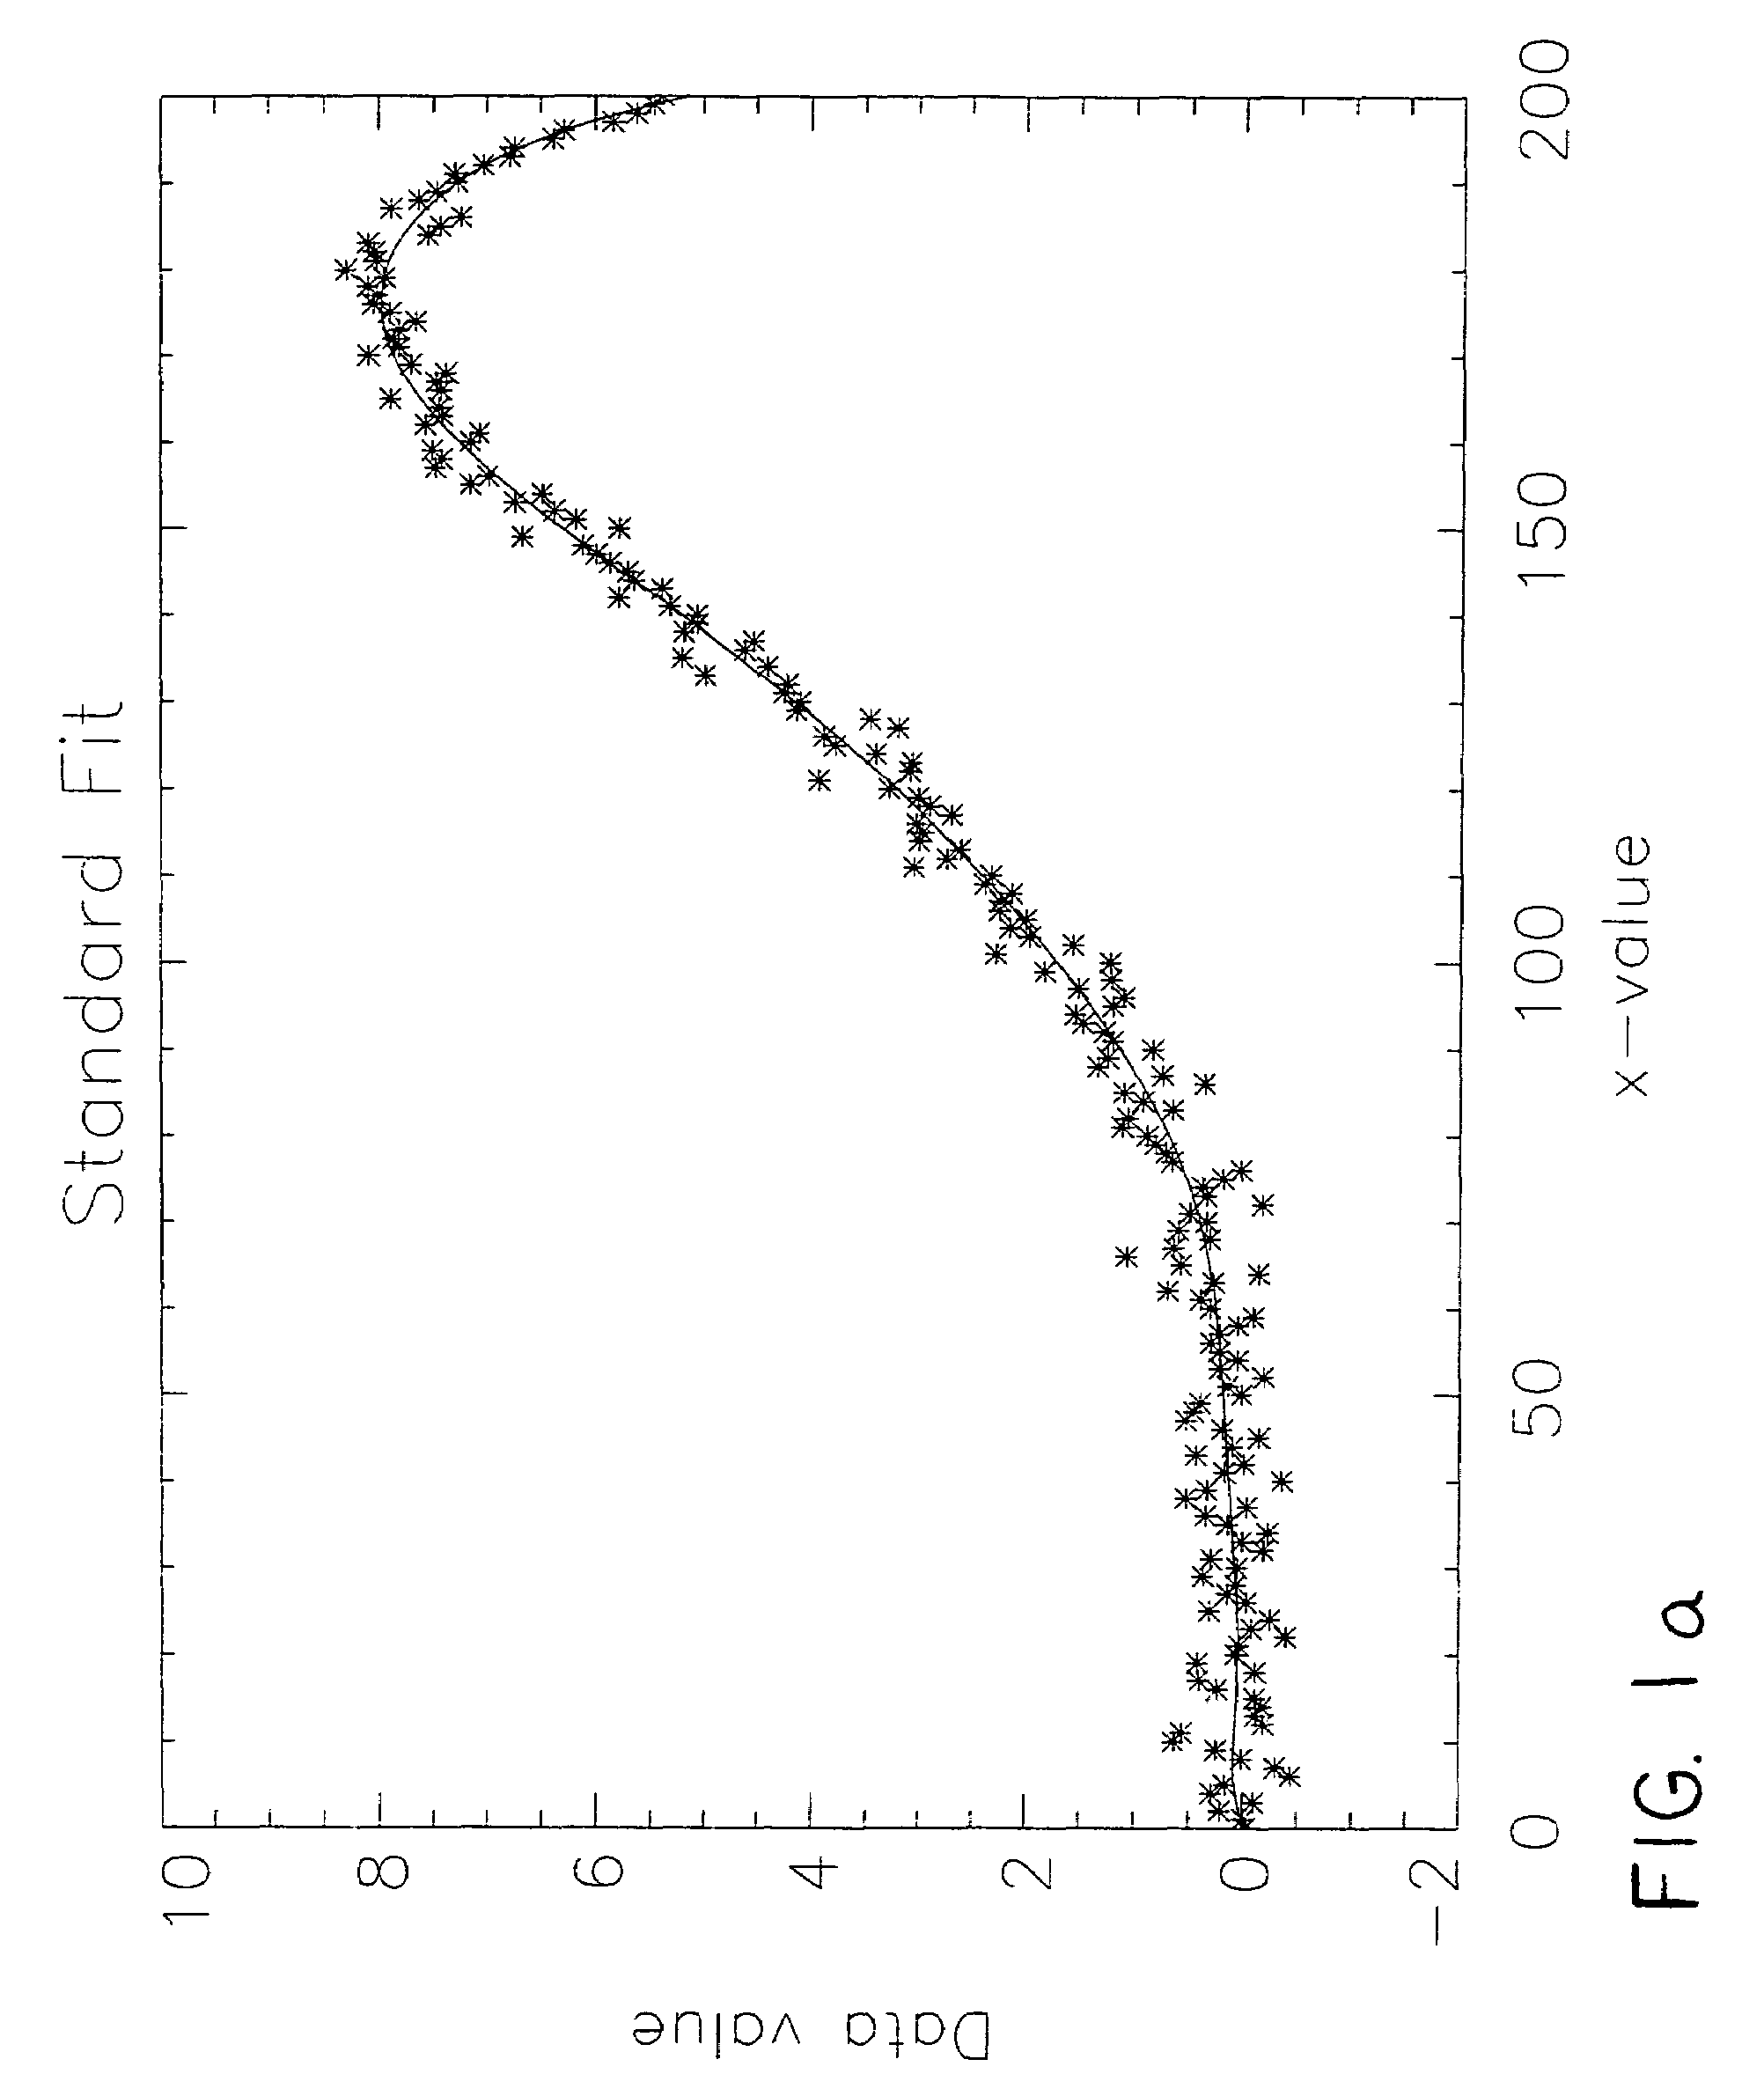
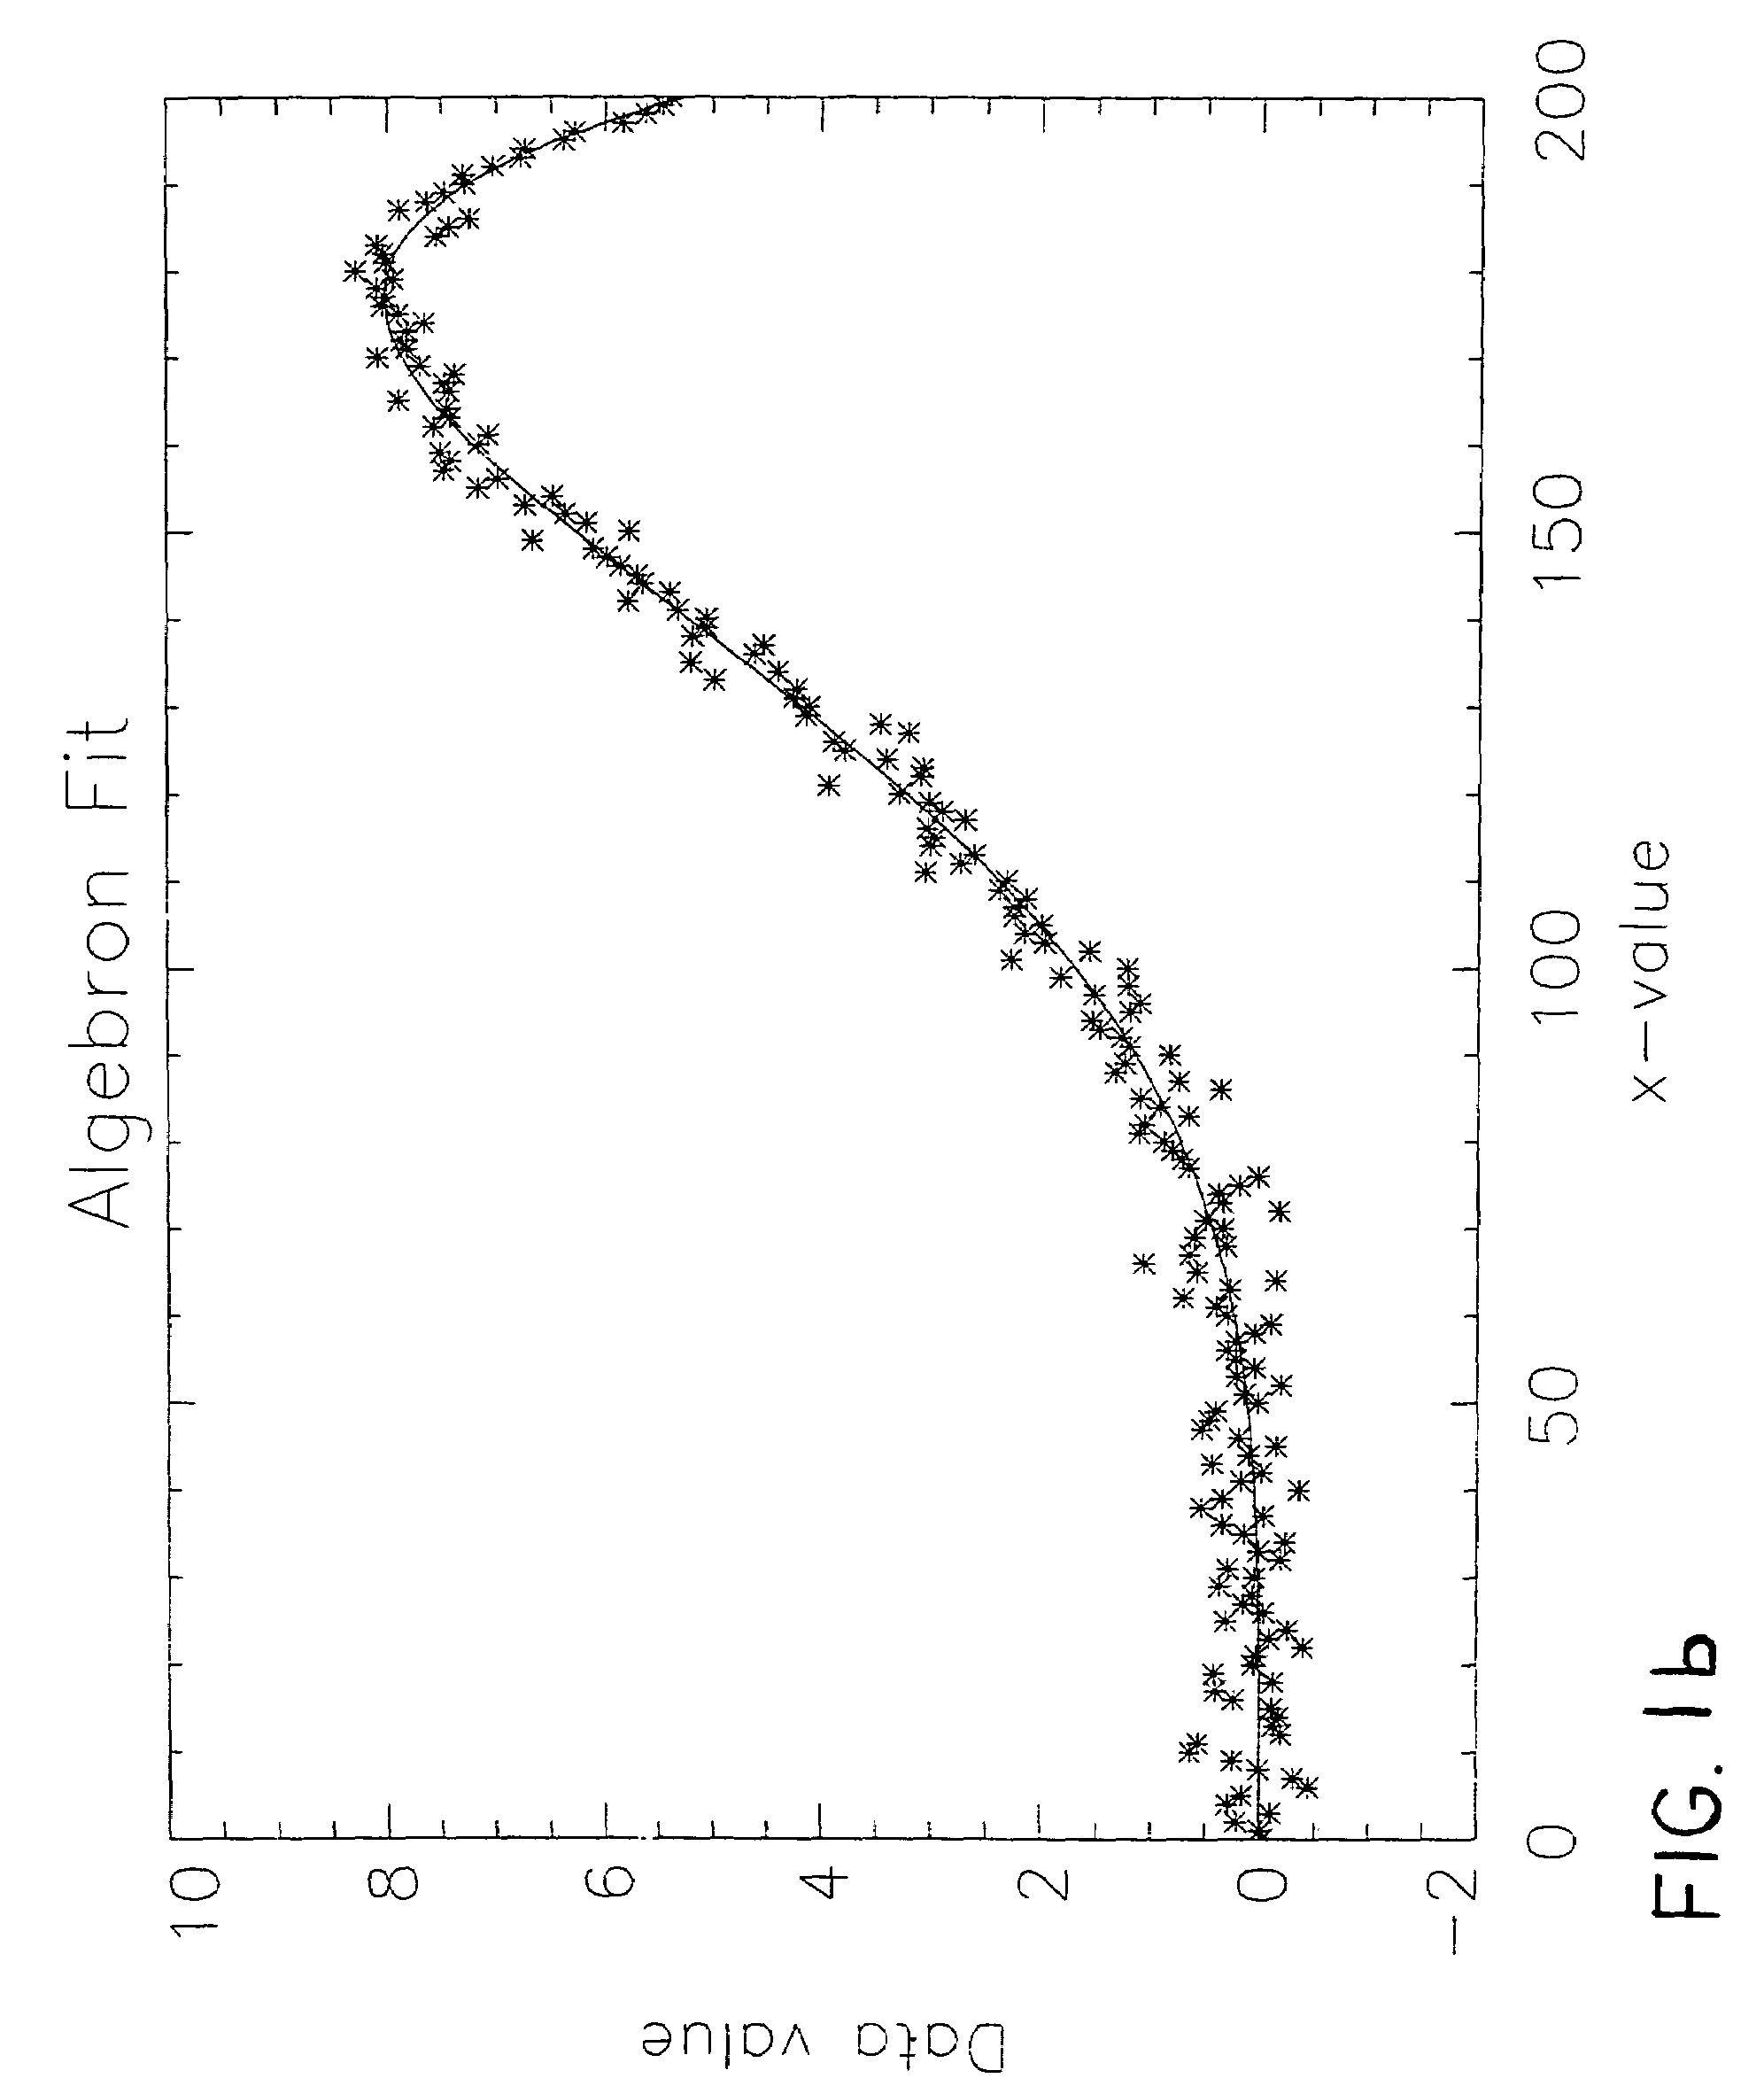
[0025]This example illustrates the use of the Algebron™ method to model noisy data that are known to contain an underlying twelfth order polynomial signal. FIGS. 2a and 2b show fits to the measured data. In the specific example chosen here, the true signal is the polynomial y(x)=30x4−20x7−5x8, and the noise is normally distributed (Gaussian) with a standard deviation of 0.25. FIG. 2a shows the result of a χ2-fit of a twelfth order polynomial to the data using standard methods. From visual inspection, the quality of the fit seems quite good. However, the values determined for the coefficients of x4, x7, and x8, of −27836.394, 728246.77, and −890971.70 respectively, are very far from the correct value of 30, −20, and −5. In fact, equally large magnitude values for the coefficients of the other absent polynomial powers are also determined. These large and disturbing errors are due to fitting the data with too complex a model. These problems can only be alleviated by imposing a minimum ...

example 2

[0027]In the second example, the Algebron™ method is used to estimate volatility (covariance matrix) of a family of 132 securities reported over a period of 820 days. With complete data, the covariances of the securities are directly calculable from the returns Xα and Xβ of the individual securities α and β. To reduce the number of independent elements of the covariance matrix, an analysis procedure is used in which each variable Xα is described as a linear combination of unknown factors fβ, and a part that fluctuates independently, Nα, which corresponds to the remaining “noise” associated with the securities:

[0028]Xα=∑β=1k⁢⁢Λα,β⁢fβ.+Nα,(1)

The k factors, fβ, are independent of each other, and independent of the noise terms Nα. The goal of the factor analysis is to determine the minimum set of factors necessary to describe the observations. When this is accomplished, the covariance matrix Vα,β is completely described in terms of the loading matrix Λα,β, and additional, independent di...


PUM


Abstract

A computer-based system and method are provided to determine the minimum number of factors required to account for input data by seeking an approximate minimum complexity model. In an exemplary embodiment, covariance in the daily returns of financial securities is estimated by generating a positive-definite estimate of the elements of a covariance matrix consistent with the input data. Complexity of the covariance matrix is minimized by assuming that the number of independent parameters is likely to be much smaller than the number of elements in the covariance matrix. Each variable is described as a linear combination of independent factors and a part that fluctuates independently. The simplest model for the covariance matrix is selected so that it fits the data to within a specified level as determined by the selected goodness-of-fit criterion.

Description

RELATED APPLICATIONS[0001]This application is related to co-pending application Ser. No. 09 / 905,528, filed Aug. 22, 2001, which is a continuation of Ser. No. 09 / 333,172, filed Jun. 14, 1999, now issued as U.S. Pat. No. 6,353,688, which is a continuation-in-part of application Ser. No. 08 / 073,929, filed Jun. 8, 1993, now issued as U.S. Pat. No. 5,912,993. The subject matter of these applications is incorporated herein by reference.COMPUTER APPENDIX[0002]A Computer Appendix containing computer program source code for programs described herein has been submitted concurrently with the filing of this application. The Computer Appendix will be converted to a Microfiche Appendix pursuant to 37 C.F.R. 1.96(b). The Computer Appendix, which is referred to as “Microfiche Appendix A”, is incorporated herein by reference in its entirety. The Computer Appendix contains material that is subject to copyright protection. The copyright owner has no objection to the facsimile reproduction by anyone of...

Claims


Application Information

Patent Timeline
Patent Type & Authority Patents(United States)
IPC IPC(8): G06Q40/00G06F19/00G06F17/17G06F17/18
CPCG06F17/18G06Q40/00G06Q40/06
Inventor YAHIL, AMOSPUETTER, RICHARD
Owner PIXON
Learn More