
Intuitive hierarchical time-series data display method and system

a time-series data and intuitive technology, applied in still image data browsing/visualisation, animation, instruments, etc., can solve the problems of difficult to grasp the whole hierarchical structure, the whole screen cannot be used effectively for display, and it is difficult to locate the intended directory or fil

Inactive Publication Date: 2008-02-26
CANON KK
View PDF12 Cites 84 Cited by
  • Summary
  • Abstract
  • Description
  • Claims
  • Application Information

AI Technical Summary

Benefits of technology

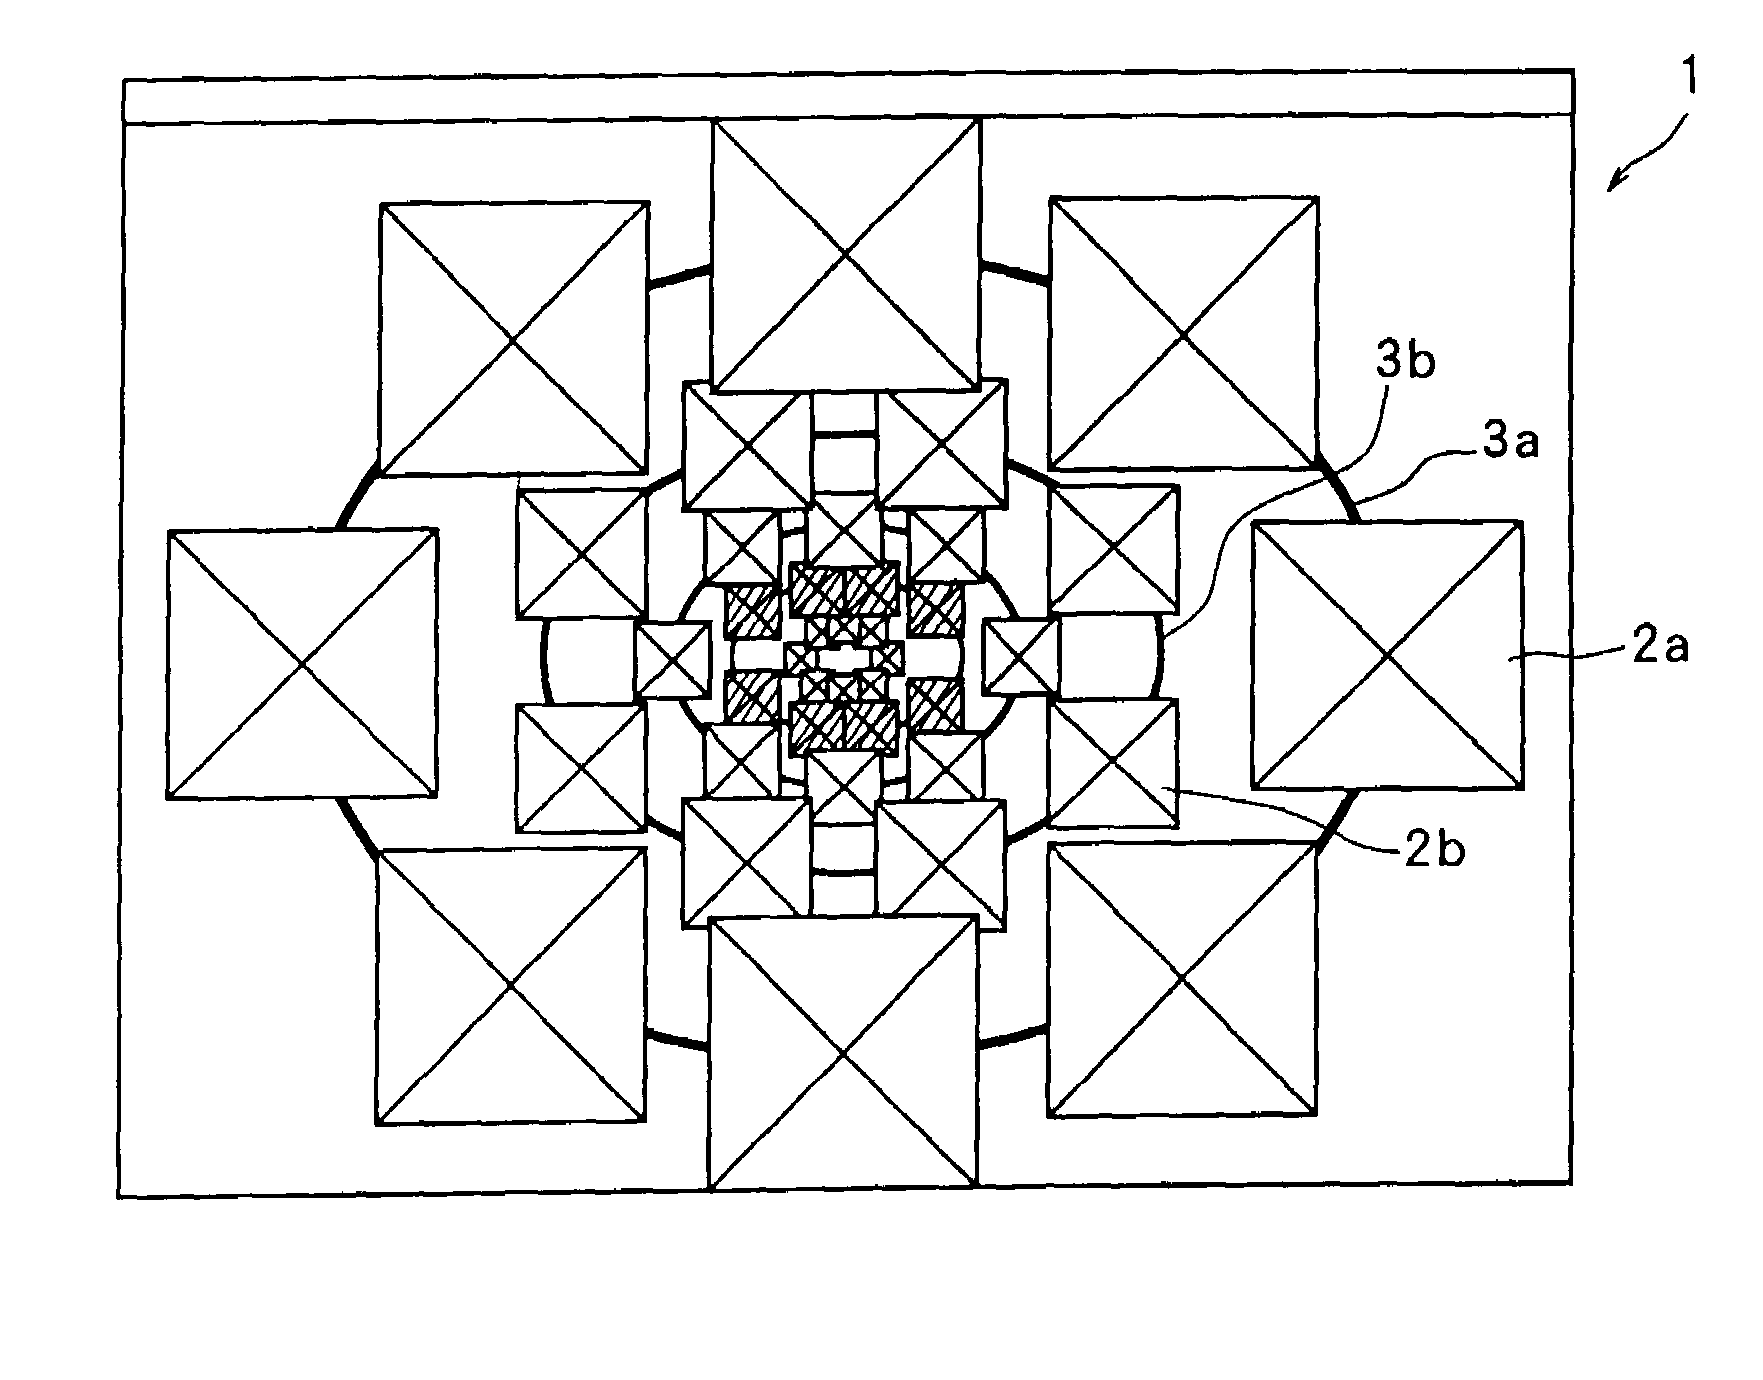
[0035]The first object of the present invention is to provide a hierarchical data display method and browser system in which the hierarchical structure of a file system or data base having a hierarchical structure is displayed in the form of a Venn diagram so that the whole structure can be grasped intuitively, data belonging to child hierarchical levels is not hidden but displayed in the form of reduced images so that intended data can be located easily.
[0036]There is provided a hierarchical data display method and browser system in which a deep hierarchical structure can be displayed within a screen of a limited area, a zoom-in means makes it possible to visualize detailed information concerning an intended hierarchical level quickly, and a zoom-out means makes it possible to obtain a brief idea on a hierarchical structure viewed from an higher level.

Problems solved by technology

This makes it rather hard to locate an intended directory or file.
The whole of a screen cannot often be used effectively for display.
It is therefore difficult to grasp the whole hierarchical structure.
An intended file cannot be located quickly.
Intended data is liable to be lost.
The foregoing drawbacks also lie in a browser system using a data base in which data is categorized hierarchically and adopting either of the foregoing display methods.
However, in the known file management system, it cannot be found explicitly whether dates associated with files displayed vertically adjacently in a list are close to or separated from each other.
When there are many people of a certain generation but few people of a certain generation, if a user wants to understand an overall trend, time-consuming work is needed.
The procedure is very complex and the work is hard.
Another problem is that a frame and image are made into a single image.

Method used


Image

  • Intuitive hierarchical time-series data display method and system
  • Intuitive hierarchical time-series data display method and system
  • Intuitive hierarchical time-series data display method and system

Examples


first embodiment

[0174]

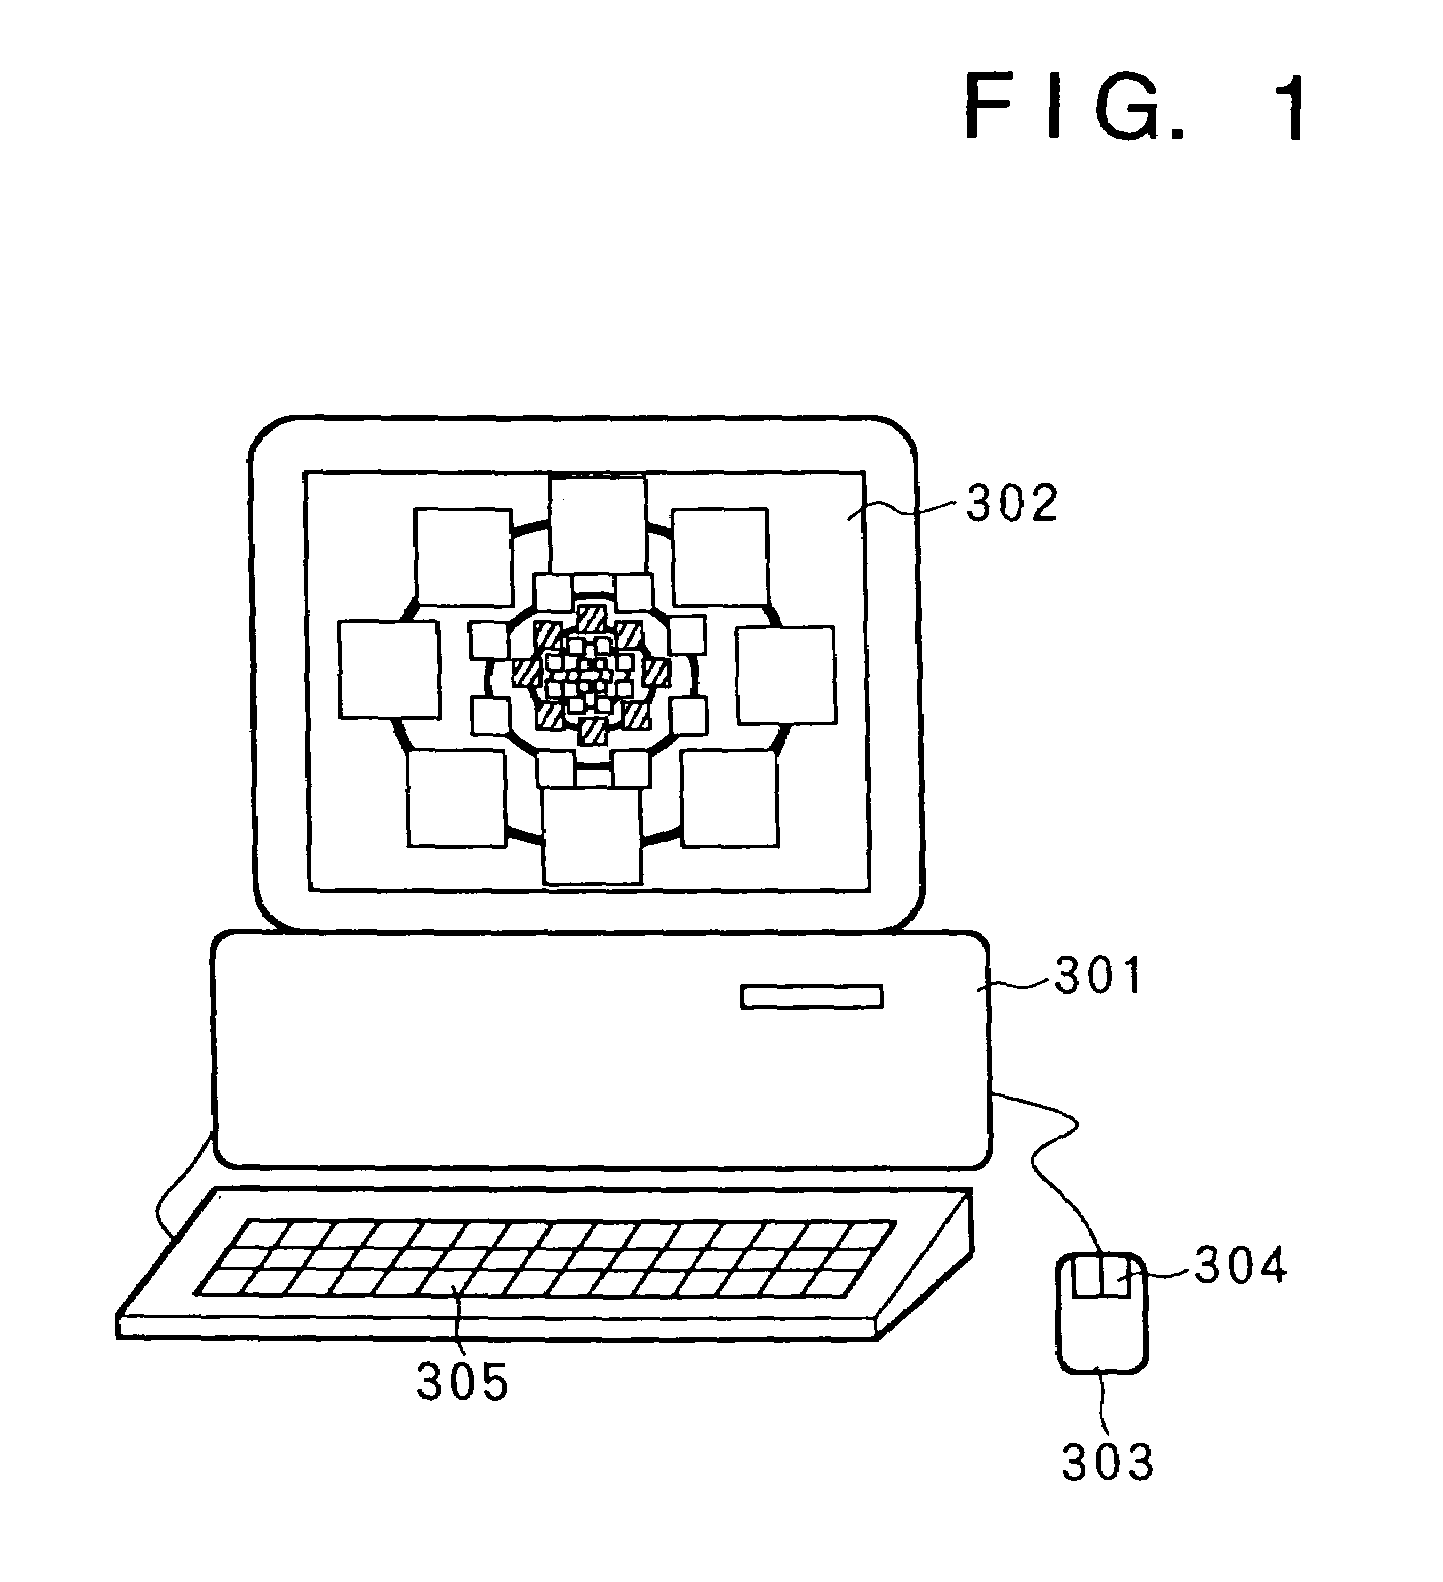
[0175]FIG. 1 shows an example of the configuration of a personal computer system serving as a platform in which the present invention is implemented.

[0176]In FIG. 1, reference numeral 301 denotes a main unit of a computer system. 302 denotes a display for displaying data. 303 denotes a mouse typical of a pointing device. 304 denotes a mouse button. 305 denotes a keyboard.

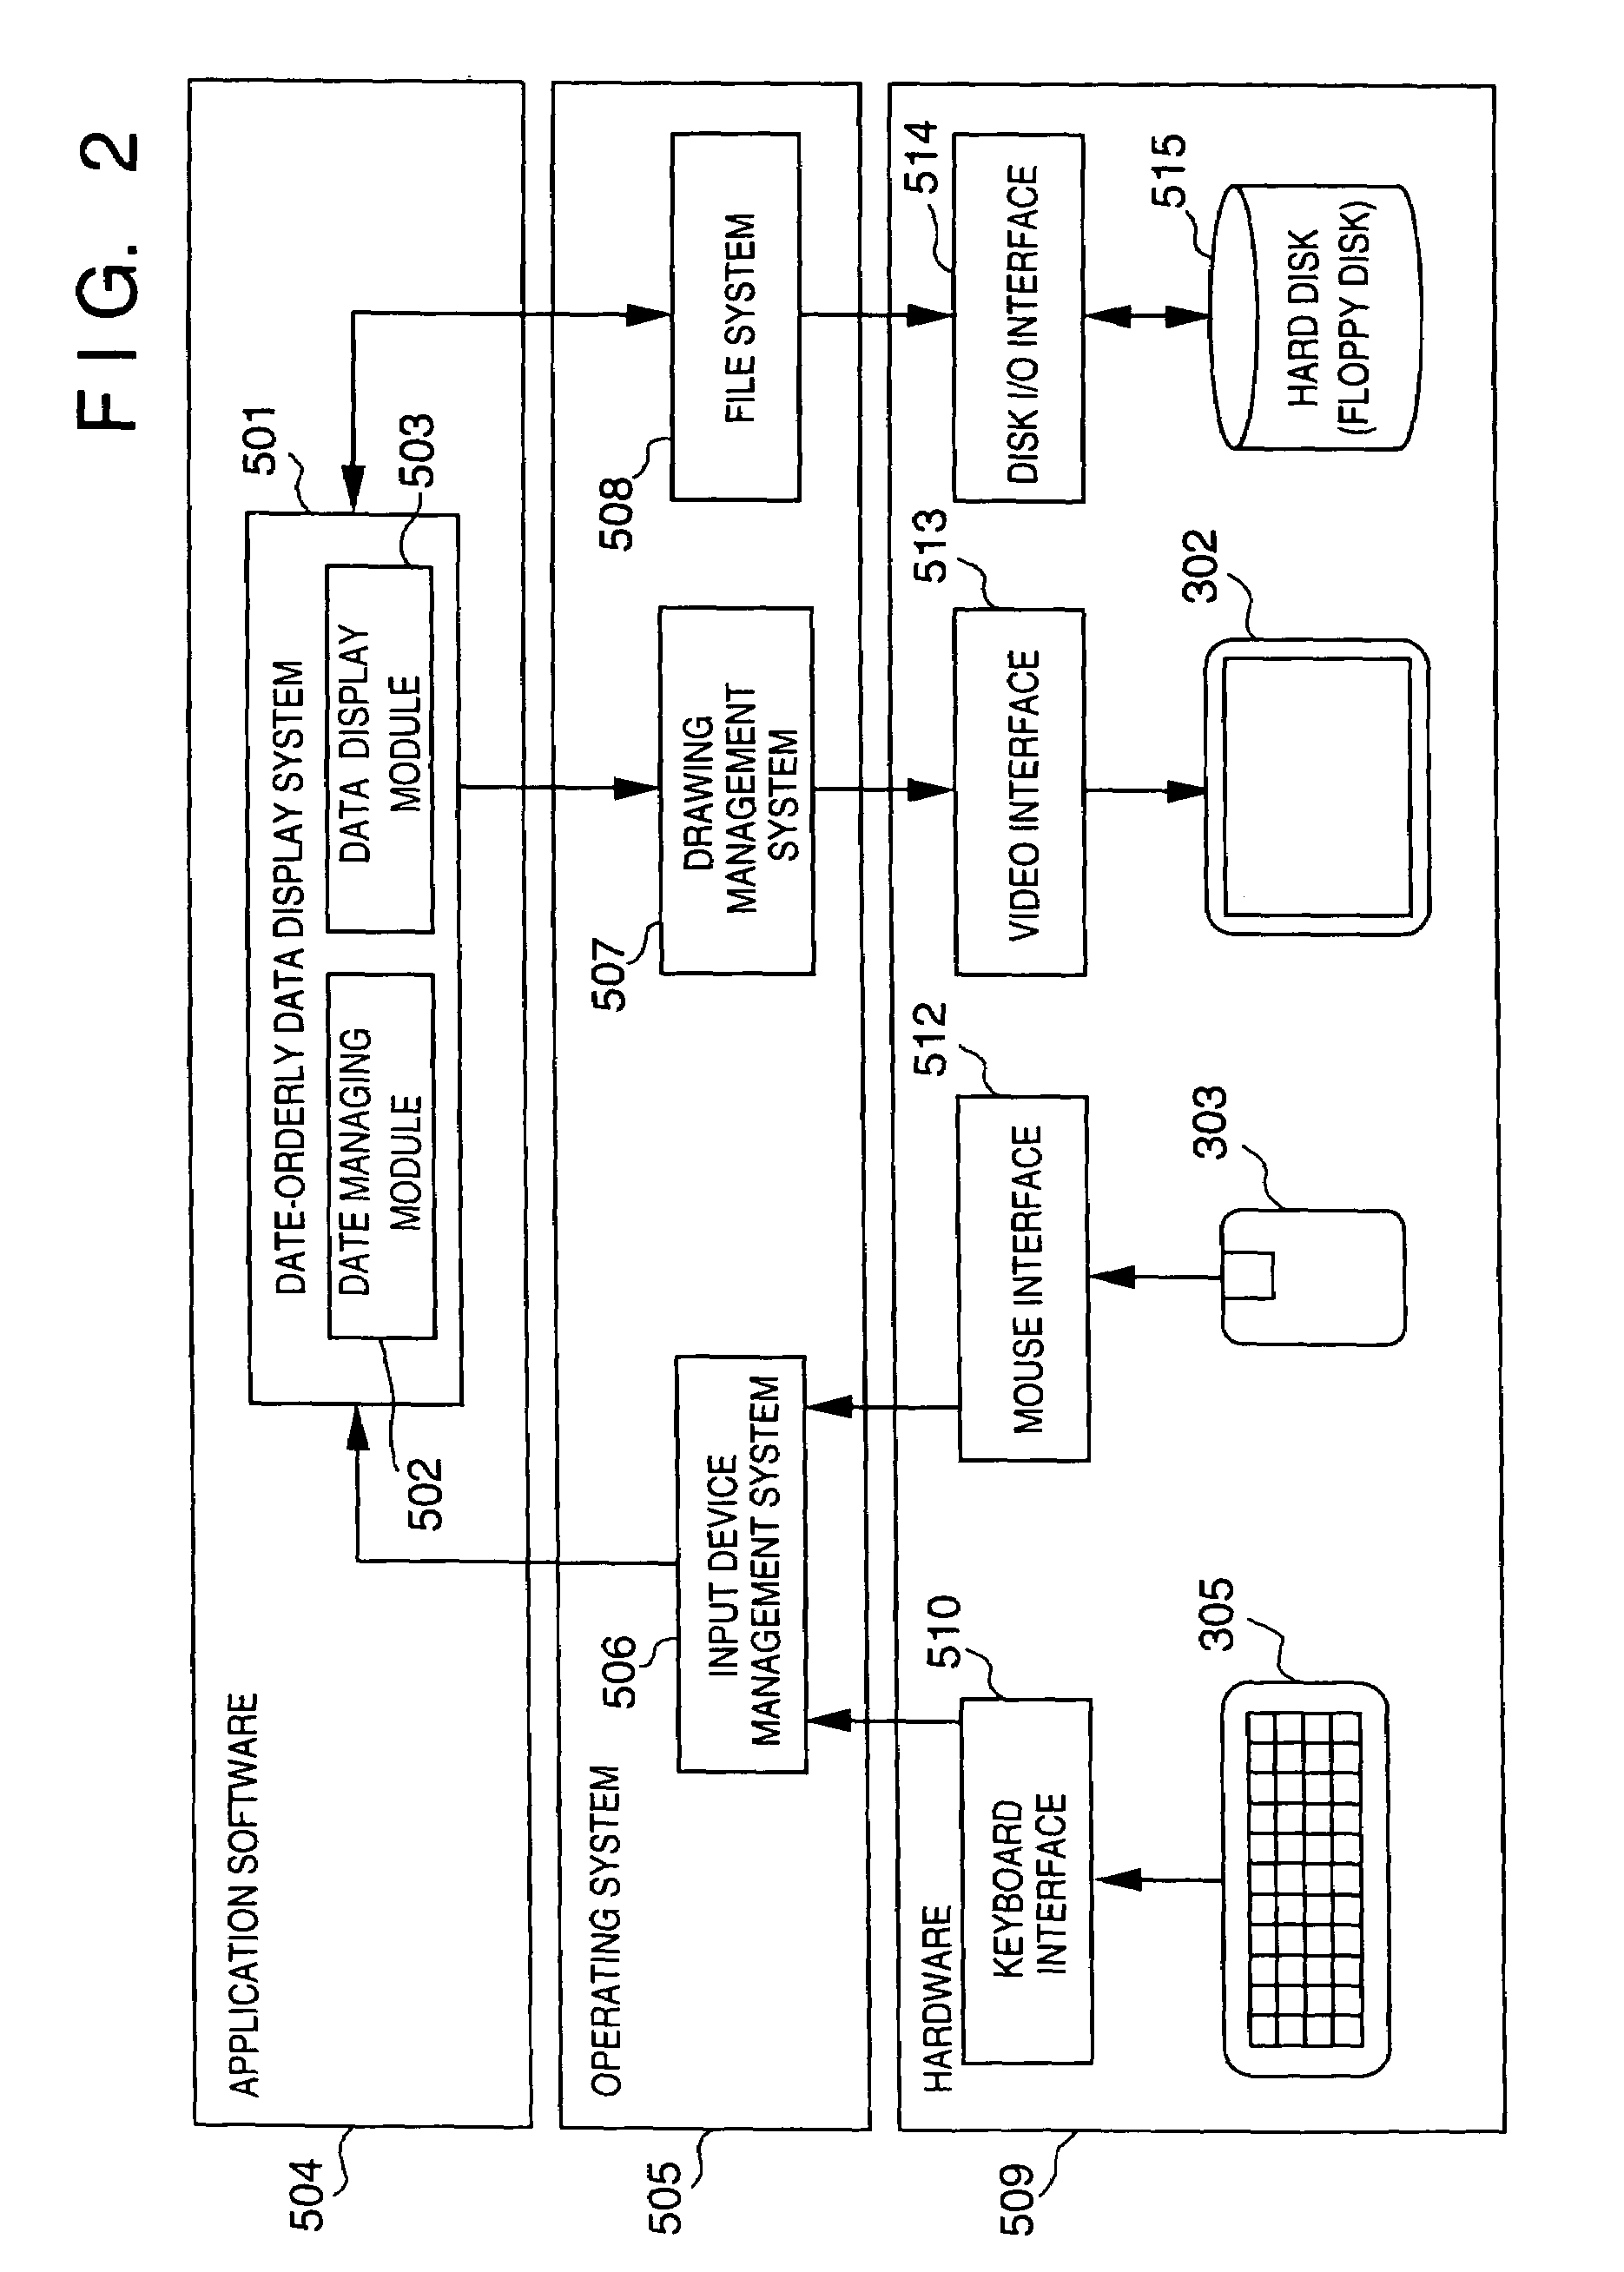
[0177]FIG. 2 shows the configuration of a hierarchical data management system including software and hardware.

[0178]In FIG. 2, reference numeral 509 denotes hardware. 505 denotes an operating system (OS) operating on the hardware 509. 504 denotes application software running under the OS 505. Some of blocks constituting the hardware 509 or OS 505 which are components of the hardware 509 or OS 505 but not directly needed for describing the present embodiment are not illustrated. The unshown blocks constituting the hardware include a CPU and memory, and those constituting the OS include a memory management syste...

second embodiment

[0248]

[0249]FIG. 39 shows an example of the configuration of a personal computer system that is a kind of platform in which the present invention is implemented.

[0250]In FIG. 39, similarly to FIG. 1, reference numeral 301 denotes a main unit of a computer system 302 denotes a display for displaying data. 303 denotes a mouse typical of a pointing device. 304 denotes a mouse button. 305 denotes a keyboard.

[0251]FIG. 40 shows the configuration of a hierarchical data browser system including software and hardware.

[0252]In FIG. 40, similarly to FIG. 2, reference numeral 509 denotes hardware. 505 denotes an operating system (OS) operating on the hardware 509. 504 denotes application software running under the OS 505.

[0253]In FIG. 40, reference numeral 518 denotes a CPU. 517 denotes a memory. 519 denotes a data bus. 515 denotes a hard disk for physically storing files and data items. 508 denotes a file management system constituting the OS. The file management system 508 has the ability to...

third embodiment

[0310]The third embodiment is concerned with another mode of the present invention. In displays and control flowcharts similar to those described in the second embodiment, components having the same functions as those in the second embodiment are assigned the same reference numerals. The description of the components will be omitted. Components whose functions are different from those in the second embodiment will be described.

[0311](Data Attribute Data)

[0312]Data attribute data 609 in this embodiment in FIG. 44 includes data items 622 to 625 shown under a dotted line in FIG. 44 in addition to the data attribute data in the second embodiment in FIG. 42. In FIG. 44, reference numeral 622 denotes a data name display area size. 623 denotes a data name font size. 624 denotes an icon picture ID. 625 denotes an icon picture display flag.

[0313](Example of a Structure of a Data Icon)

[0314]FIG. 45 is an explanatory diagram concerning component elements of a display of the data icon 404 shown...


PUM


Abstract

The present invention provides a time-series data display method and system for displaying time-series data items so that a user can grasp time more intuitively. First data associated with a desired date is retrieved and displayed, second data associated with a contiguous date is retrieved, and a display screen for the second data is displayed smaller than that for the first data in a temporal direction starting with the desired date. Third data is associated with a date contiguous to the second date retrieved, and is displayed inside the second data with a smaller display area. Also, in a hierarchical data display method and browser system, a display area is divided into an area where icons representing data items belonging to one level are displayed, and an area where child levels are displayed. As hierarchical depth increases, the data icons are made smaller and simpler. The hierarchical structure of a file system or data base can be displayed as a Venn diagram. Data items belonging to child levels are not hidden but displayed as reduced images, whereby intended data can be located effortlessly. A cutout form and image are registered mutually independently. An identifier, position, and size of the cutout form are specified as the attributes of the image. Thus, an image can be fetched into album software by performing a simple operation, or a cutout can be changed in size.

Description

BACKGROUND OF THE INVENTION[0001]The present invention relates to a hierarchical data display method for retrieving and displaying data from a data base, file system, or the like in which a plurality of data items are managed hierarchically, and to a browser system.[0002]More particularly, the present invention relates to a time-series data display method for displaying a plurality of data items that are managed using associated dates, and to an information processing system for realizing the method.[0003]The present invention also relates to an image editing method and system to be implemented in drawing software for handing images or a data base system.[0004]In a file management system or data base system for a computer, a technique of managing data hierarchically is often used to manage numerous data items. In a file system, especially, under almost all operating systems (hereinafter OSs), the whole of the file system is segmented and managed using a plurality of hierarchical dir...

Claims


Application Information

Patent Timeline
Patent Type & Authority Patents(United States)
IPC IPC(8): G06T13/00G06F17/30
CPCG06F17/30126G06F17/30274G06F17/30716G06F17/30958G06F16/9024G06F16/54G06F16/34G06F16/168
Inventor TAKIGUCHI, HIDEO
Owner CANON KK
Learn More