Method for preparing analytical standard, and analytical standard prepared by the same

a technology of analytical standards and analytical standards, applied in chemical methods analysis, material analysis using wave/particle radiation, instruments, etc., can solve the problems of large gap between the element content of biological samples to be measured and the analytical standard of evaporation type, and uneven element distribution at the portion where mercury is located

Inactive Publication Date: 2010-06-08
NAT INST OF RADIOLOGICAL SCI
View PDF3 Cites 1 Cited by
  • Summary
  • Abstract
  • Description
  • Claims
  • Application Information

AI Technical Summary

Benefits of technology

[0016]According to this method, by allowing the mixed solution to stand still at room temperature before freezing, lowering of the temperature of the mixed solution can be made slower. Therefore, it becomes further possible to surely remove gas from the mixed solution.
[0018]According to this method, while the mixed solution is allowed to stand still at room temperature, gas contained in the mixed solution can be removed with the suction apparatus. Therefore, it becomes further possible to surely remove gas contained in the mixed solution.
[0020]According to this method, in the freeze step, the mixed solution can be slowly frozen at a cooling rate slower than −2.9° C. / min. Therefore, it becomes further possible to surely remove gas contained in the mixed solution.
[0023]According to the present invention, it becomes possible to provide an analytical standard used for an elemental analysis utilizing microbeam, and a method for preparing the analytical standard.

Problems solved by technology

However, it is often the case that such an analytical standard cannot be applied to the measurement of biological samples of interest in biomedical field.
In other words, the amount of the element present in a biological sample to be measured frequently is as small as several ppm or less, which leads to a large gap in the element content between the biological sample to be measured and the analytical standard of evaporation type.
This may result in, in a drying step after dropping, an uneven element distribution at the portion where mercury was dropped.
As a result, it becomes difficult to obtain an analytical standard containing mercury of a desired concentration.

Method used


Image

  • Method for preparing analytical standard, and analytical standard prepared by the same
  • Method for preparing analytical standard, and analytical standard prepared by the same
  • Method for preparing analytical standard, and analytical standard prepared by the same

Examples


example 1

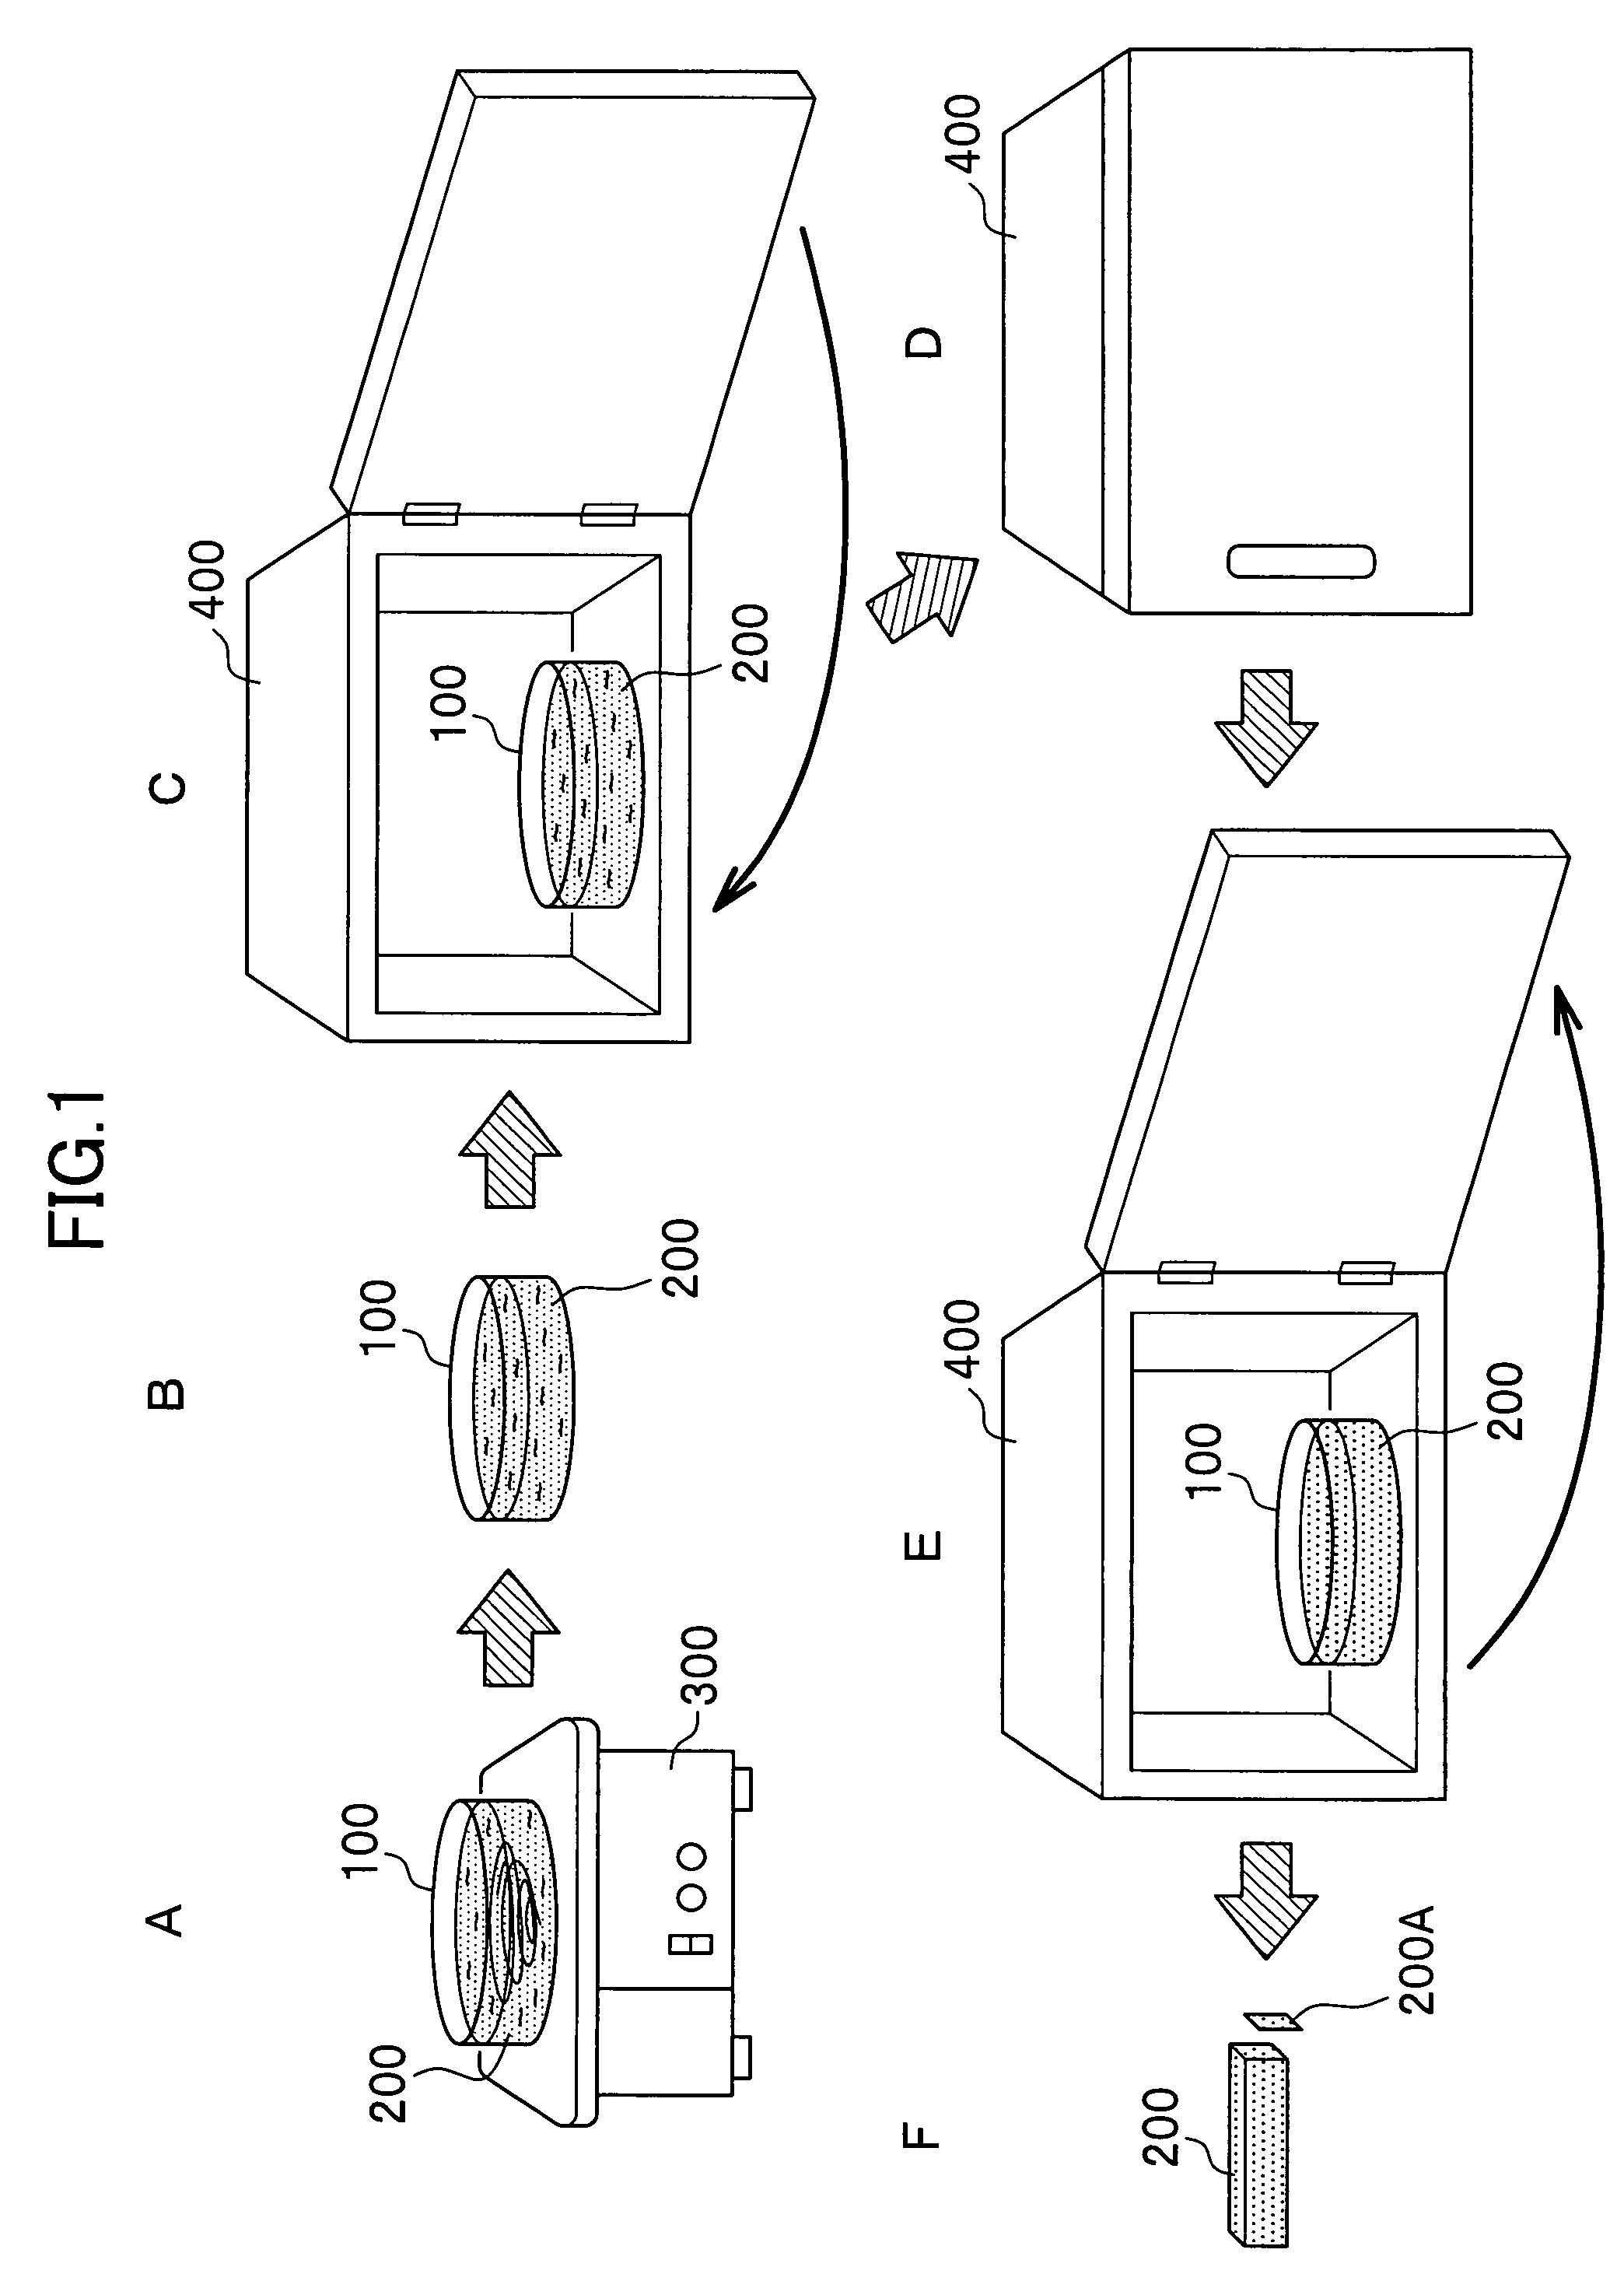
[0039]FIG. 2 shows elemental images of the analytical standard prepared by the method according to the embodiment described above in which: FIG. 2(a) shows a case where the element is zinc; and FIG. 2(b) shows a case where the element is selenium.

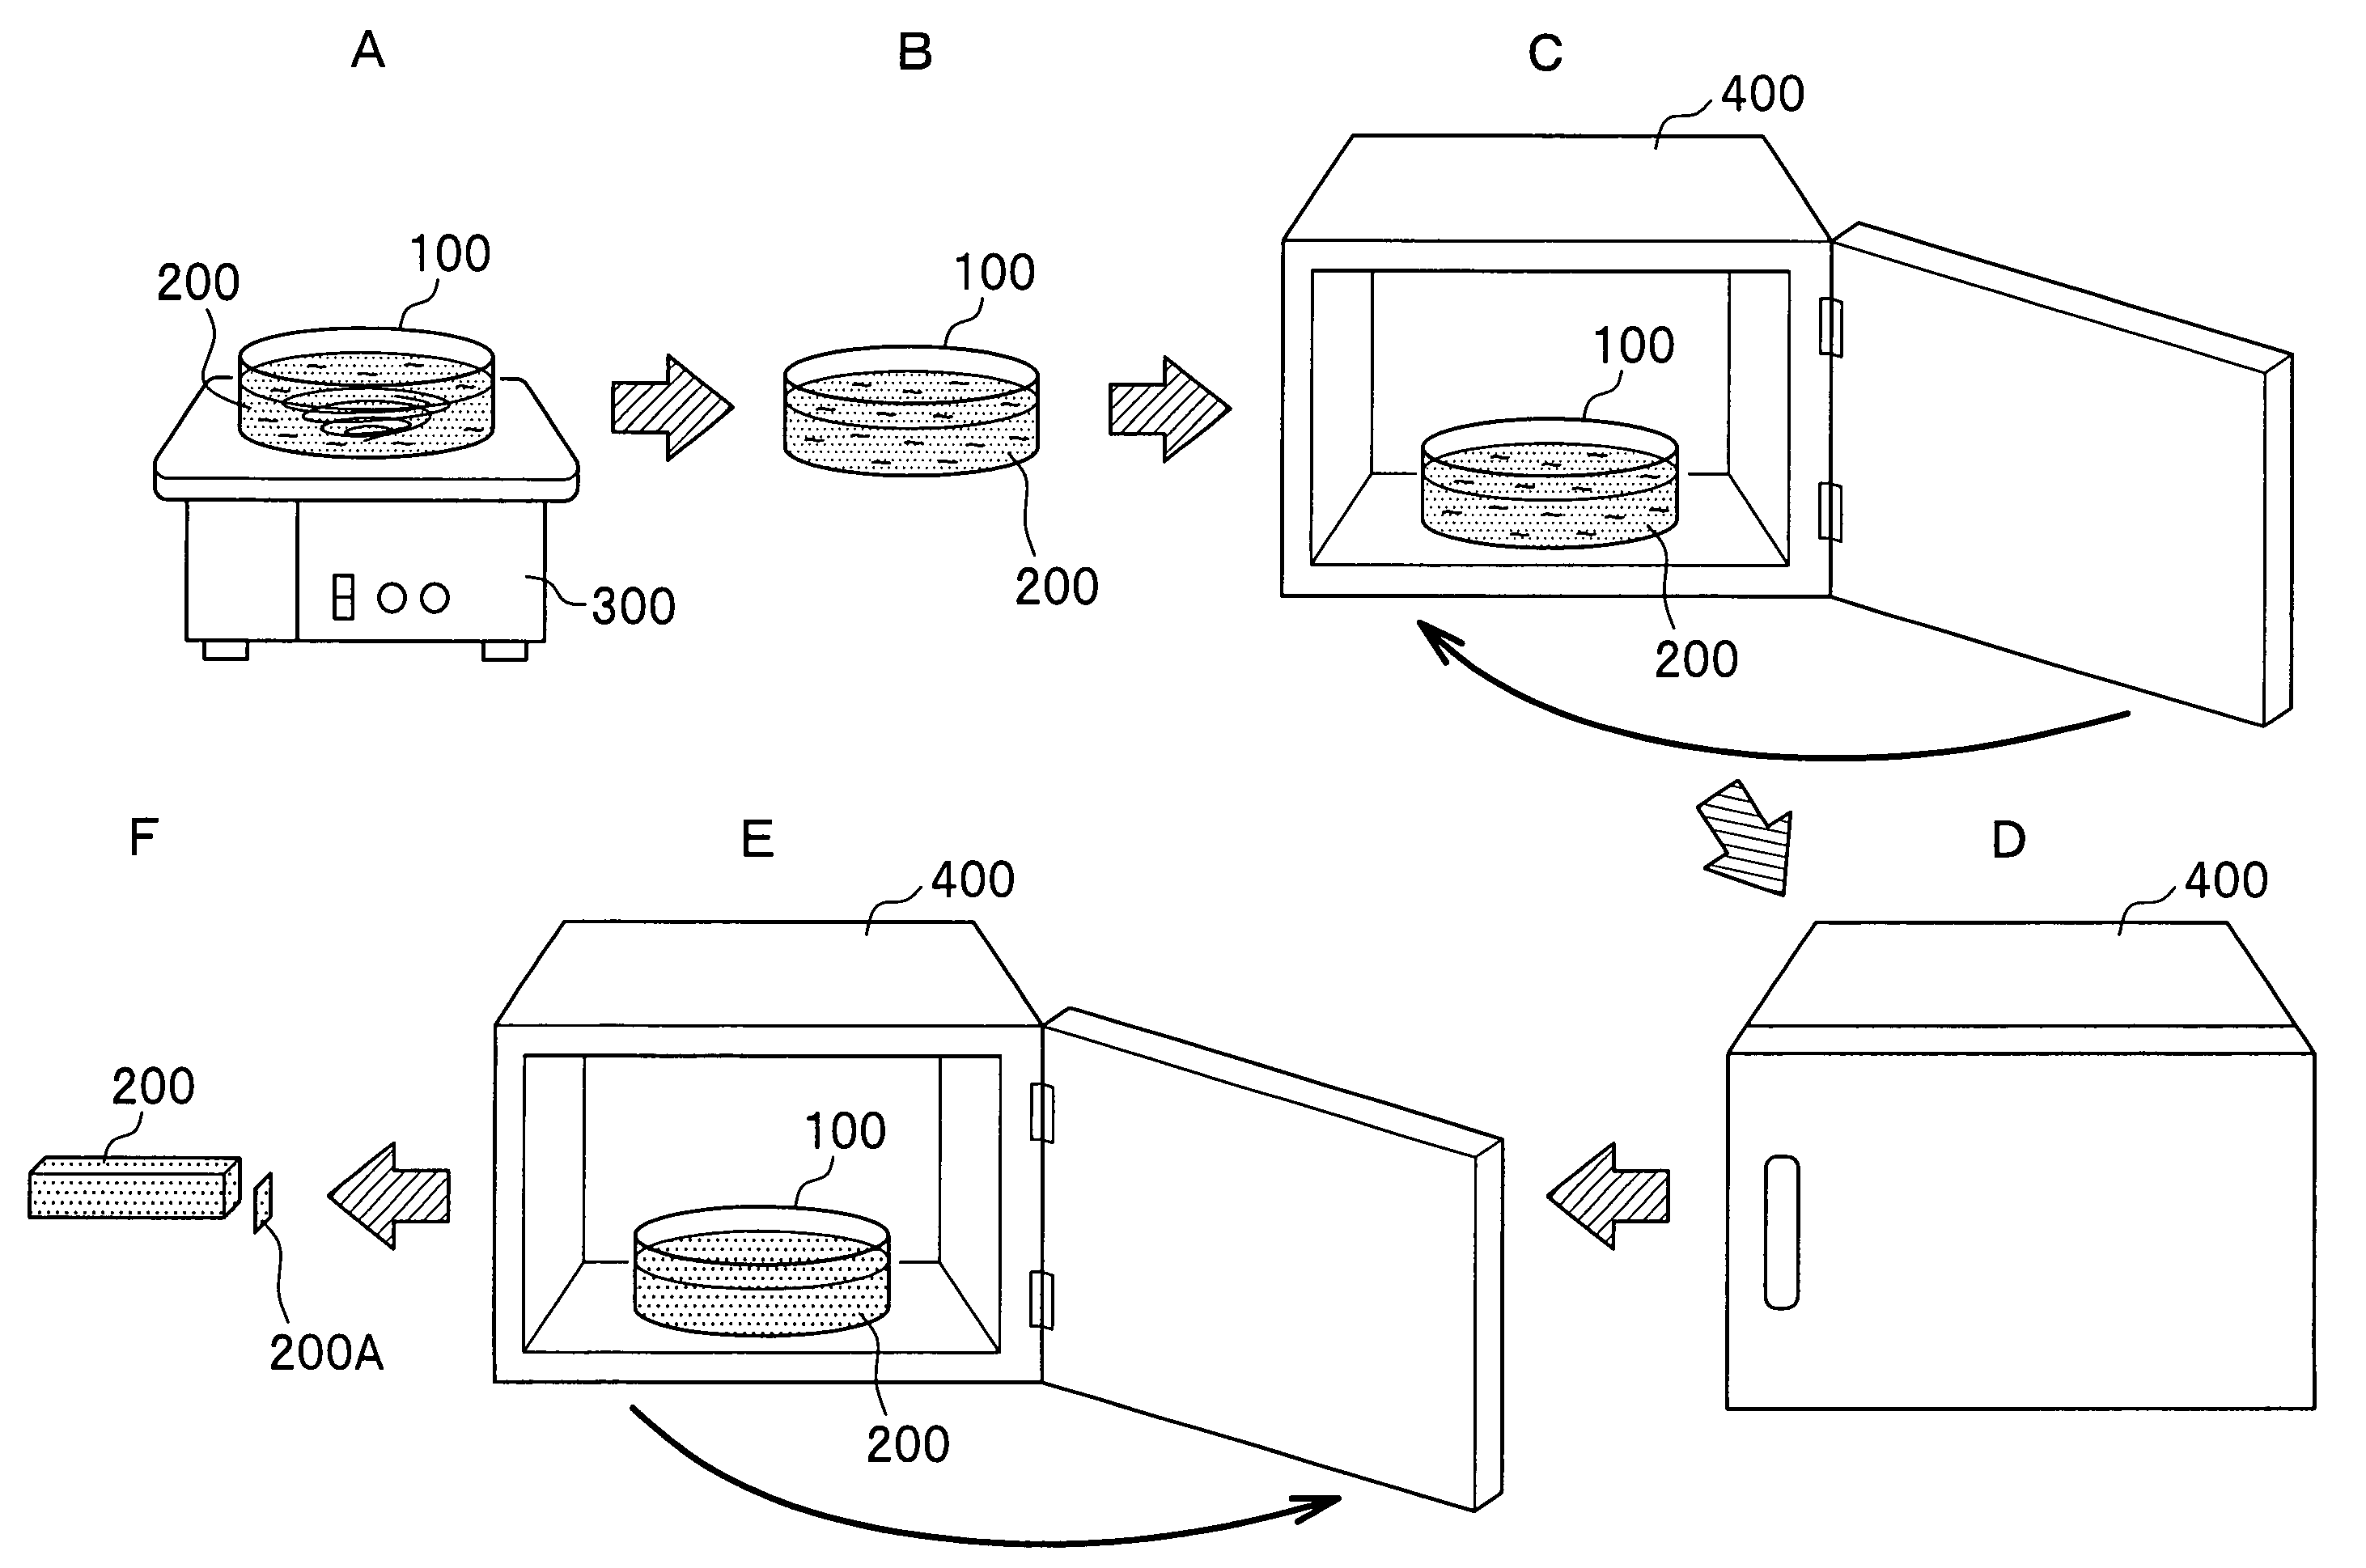
[0040]In an example illustrated in FIG. 2, 1.98 g of OTC compound was charged in a container (in a shape of an ellipsoid with a major axis of 27 mm, a minor axis of 22 mm and a depth of 4 mm) and 20 μl of an element solution (in the case of FIG. 2(a), a zinc chloride solution prepared by dissolving zinc chloride in distilled water to a concentration of 50,000 ppm in terms of zinc; and in the case of FIG. 2(b), a sodium selenite solution prepared by dissolving sodium selenite in distilled water to a concentration of 50,000 ppm in terms of selenium) was added to a final concentration of 500 ppm in terms of zinc in the OTC compound. A stirring bar (with a length of 15 mm and a diameter of 2 mm) was put in the container. The mixture was stirred...

example 2

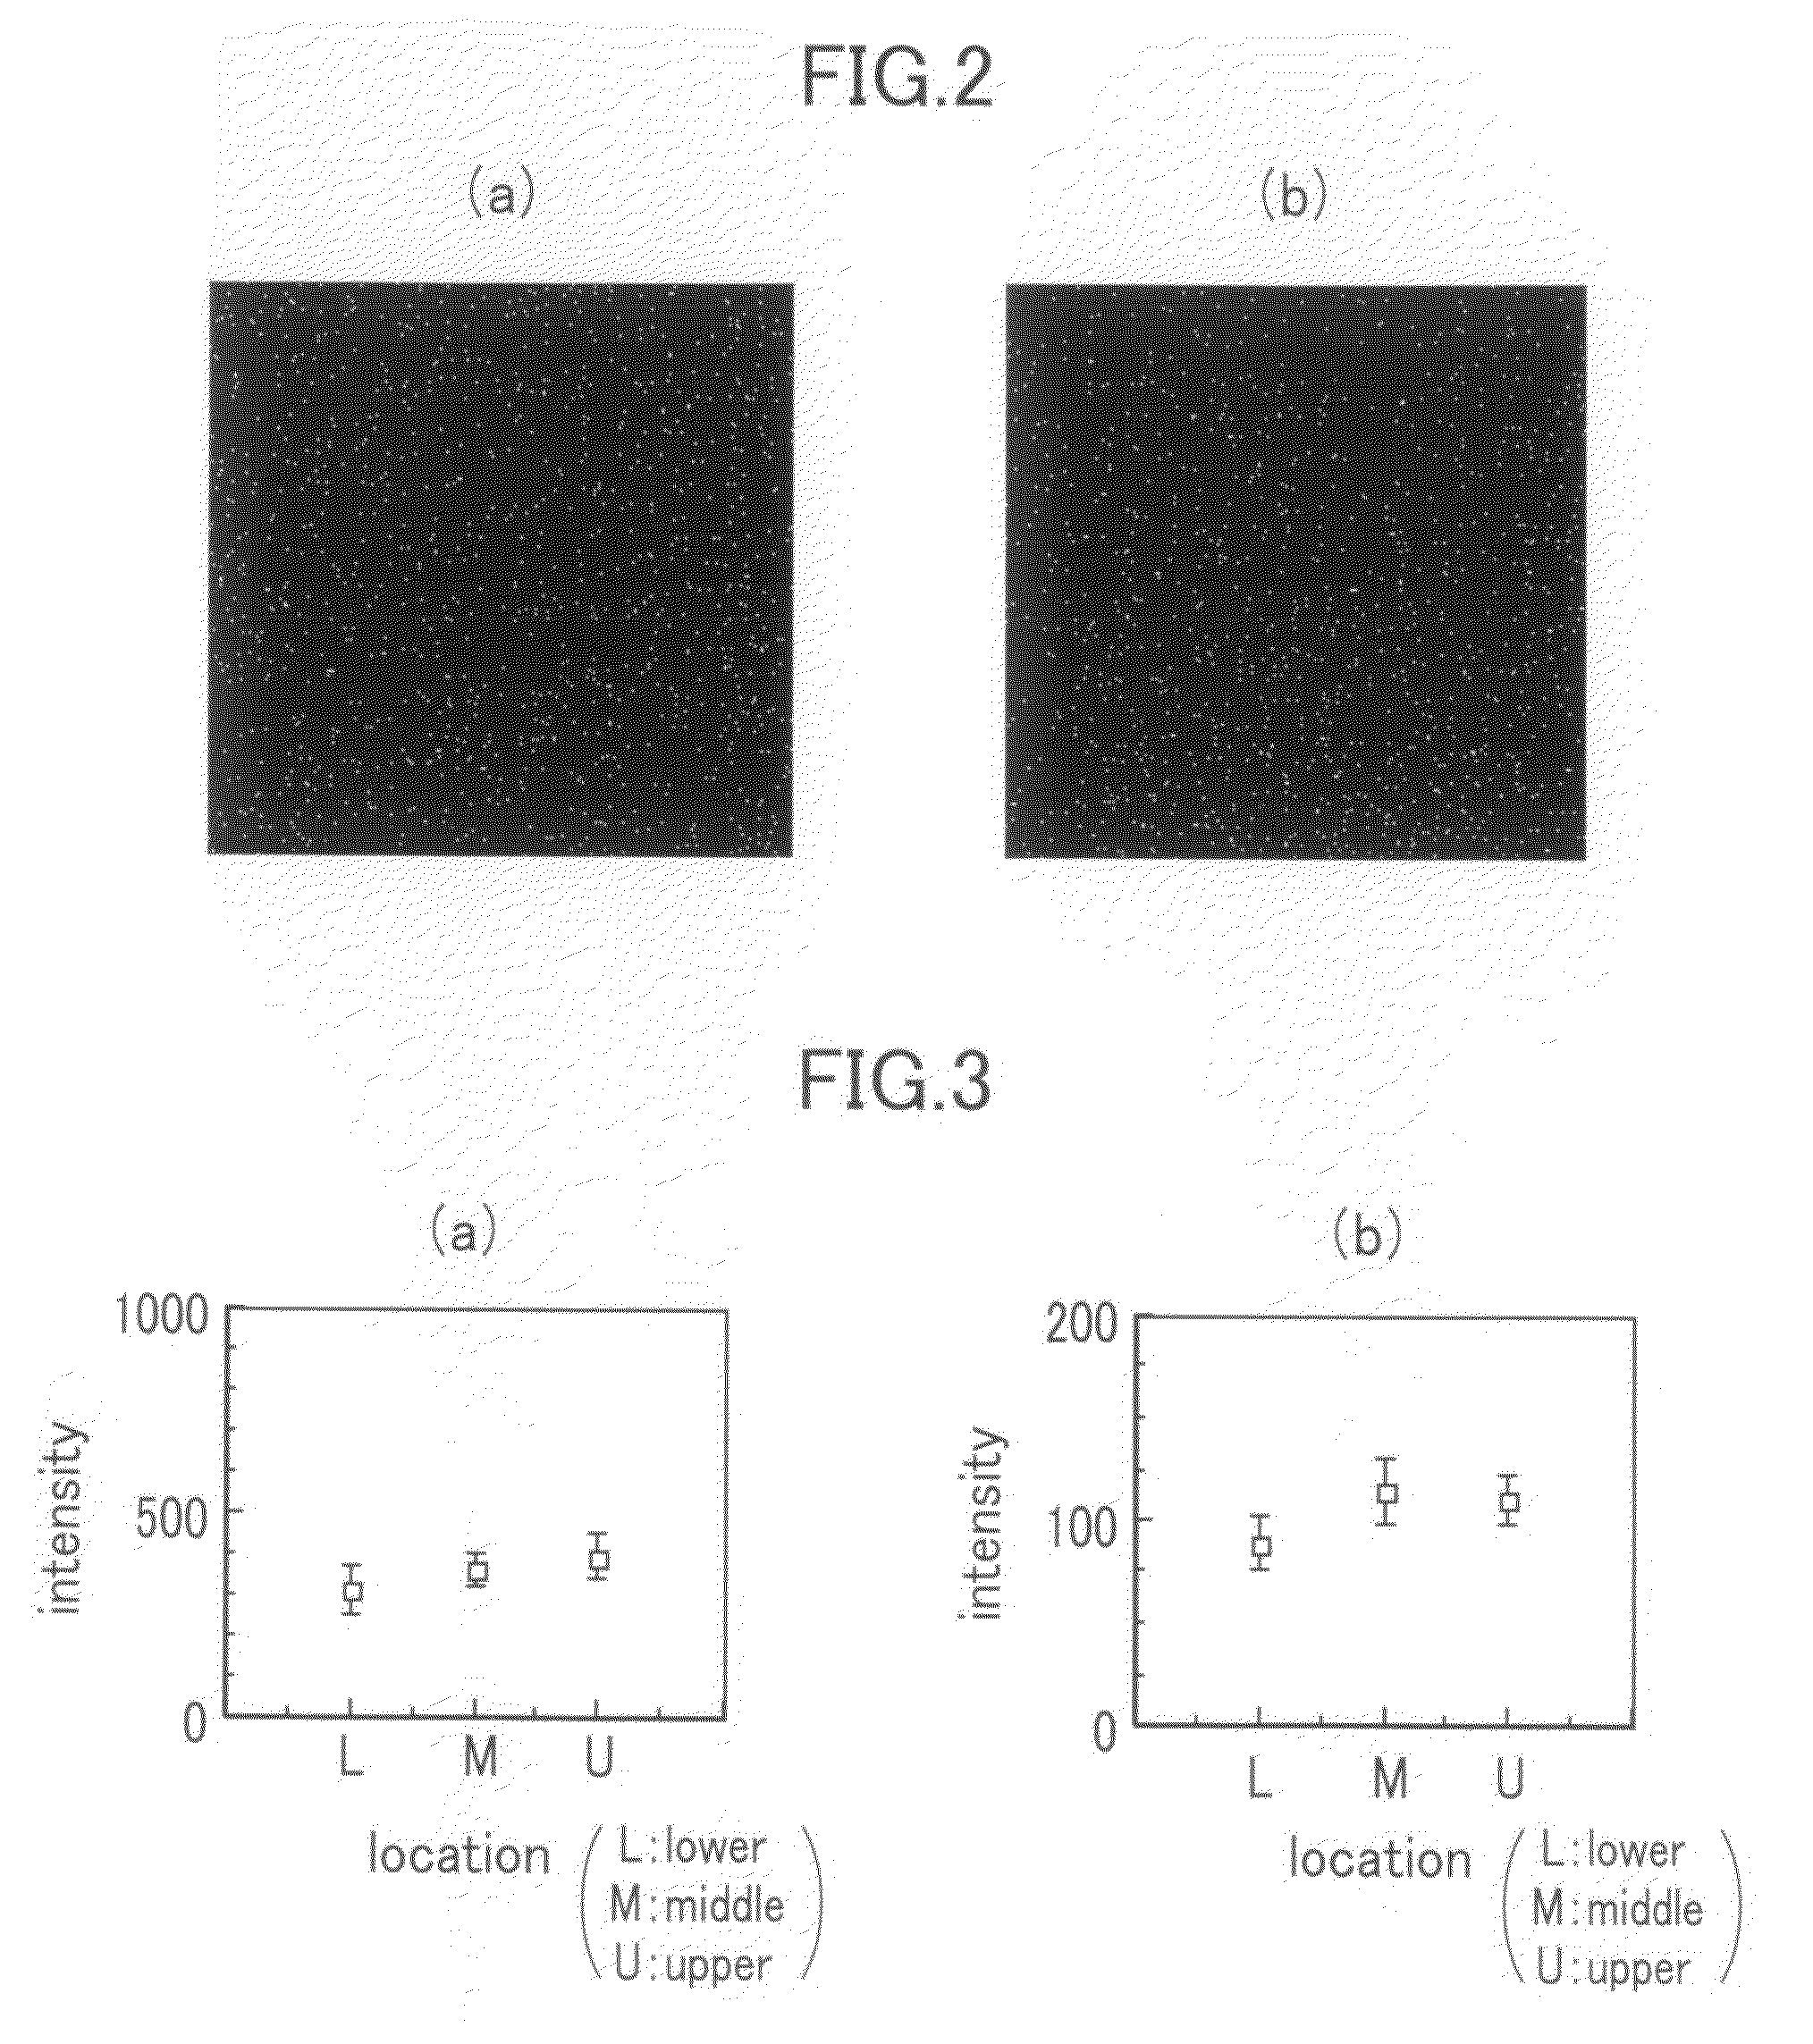
[0041]FIG. 3 shows graphs of element distribution in a depth direction in the frozen block of the analytical standard prepared by the method according to the embodiment described above in which; FIG. 3(a) shows a case where the element is selenium; and FIG. 3(b) shows a case where the element is mercury.

[0042]In the general microbeam X-ray fluorescence analysis, due to the limitation in the detector property, a subject to be measured is X-ray fluorescence which is detectable in the energy region of approximately 1-20 keV. Therefore, in a case of the element with which X-ray fluorescence as K-line (main peak) is out of the above-mentioned energy region, the detection should be made with L-line or M-line, detection efficiency of which is lower than that of K-line. As a representative element having such a property, mercury was selected, and a comparison was made with selenium detectable with K-line. Mercury is one of the elements with which it is difficult to obtain excellent results ...

example 3

[0044]FIG. 4 shows calibration curves of the analytical standard prepared by the method according to the embodiment described above in which: FIG. 4(a) shows a case where the element is selenium; FIG. 4(b) shows a case where the element is zinc; and FIG. 4(c) shows a case where the element is mercury.

[0045]In an example illustrated in FIG. 4, an element solution (in the case of FIG. 4(a), a sodium selenite solution, in the case of FIG. 4(b), a zinc chloride solution, and in the case of FIG. 4(c), a mercuric chloride solution) was added to the OTC compound to the final concentrations of 100, 250 and 500 ppm. Other conditions are substantially the same as those in Example 1. For each sample, 3 areas of 500×500 μm2 were scanned with nanobeam (an integrated current of 0.24 μC) using substantially the same analyzer as that of Example 2, and a mean value and standard deviation of the resultant intensity were plotted, to thereby obtain a calibration curve. It was found that, with respect t...


PUM

PropertyMeasurementUnit
thicknessaaaaaaaaaa
temperatureaaaaaaaaaa
temperaturesaaaaaaaaaa

Abstract

There is provided a method for preparing an analytical standard used for microbeam X-ray fluorescence analysis which includes: a mixing step in which an element is added to a base material, and the base material and the element are mixed by stirring to obtain a mixed solution; a deaeration step in which the mixed solution is deaerated; a freeze step in which the mixed solution is slowly frozen; and a cutting step in which a thin section is cut out from the frozen mixed solution. In order to surely remove bubbles from the mixed solution, the deaeration step may contain a stationary step in which the mixed solution is allowed to stand still at room temperature; or the stationary step includes a removal step in which gas contained in the mixed solution which is allowed to stand still is removed with a suction apparatus.

Description

BACKGROUND OF THE INVENTION[0001]1. Field of the Invention[0002]The present invention relates to a method for preparing an analytical standard used for an elemental analysis utilizing microbeam, and an analytical standard prepared by the method.[0003]2. Description of the Related Art[0004]Conventionally, as a technique for a local elemental analysis, there can be mentioned a microbeam X-ray fluorescence analysis in which: a sample is irradiated with sharp excitation light of from a several hundred-nanometer to several-micrometer radius; a type of element is specified based on energy of the generated X-ray fluorescence; and abundance of the element is determined based on the intensity of the generated X-ray fluorescence. The microbeam X-ray fluorescence analyses are classified into several categories depending on the type of the excitation light. Among these, because of less damage on the sample during measurement, attentions have been paid to a synchrotron radiation X-ray fluorescen...

Claims


Application Information

Patent Timeline
Patent Type & Authority Patents(United States)
IPC IPC(8): G01N1/00G01N1/28
CPCG01N1/286G01N23/2202Y10T436/10Y10T436/25Y10T436/25875
Inventor TAKEDA, SHINOYUKAWA, MASAENISHIMURA, YOSHIKAZU
Owner NAT INST OF RADIOLOGICAL SCI
Why Eureka
Try Eureka