Local dominant wave-vector analysis of seismic data

a seismic data and local dominant wave technology, applied in the field ofsignal processing, can solve the problems of insufficient interpretation, inability to provide sufficient, and inability to see subtle features that the interpreter needs to see, and achieve the effect of better visualization of frequency dependent features

Active Publication Date: 2011-02-01
CALGARY SCIENTIFIC INC
View PDF5 Cites 22 Cited by
  • Summary
  • Abstract
  • Description
  • Claims
  • Application Information

AI Technical Summary

Benefits of technology

[0009]It is further an object of the invention to provide better visualization of the frequency dependent features.

Problems solved by technology

However, like traditional 2-D data, these are likely contaminated by noise during data capture, and are distorted during subsequent data processing, for example, due to “edge effects” introduced by the migration processing step.
While an experienced interpreter of seismic data is able to disregard noise and artifacts, inevitably there arise instances in which subtle features that the interpreter needs to see are obscured.
As a consequence, the interpreter is not able to provide sufficient information, for example, about the location of a candidate petroleum reservoir, requiring more seismic investigations, or worse, the interpretation is incorrect.
Both scenarios result in substantial additional costs.
Although the Fourier transform is a powerful tool, its lack of positional resolution renders it ill-suited for describing local, or pixel-to-pixel, changes in spectral content of multi-dimensional data.

Method used


Image

  • Local dominant wave-vector analysis of seismic data
  • Local dominant wave-vector analysis of seismic data
  • Local dominant wave-vector analysis of seismic data

Examples


first embodiment

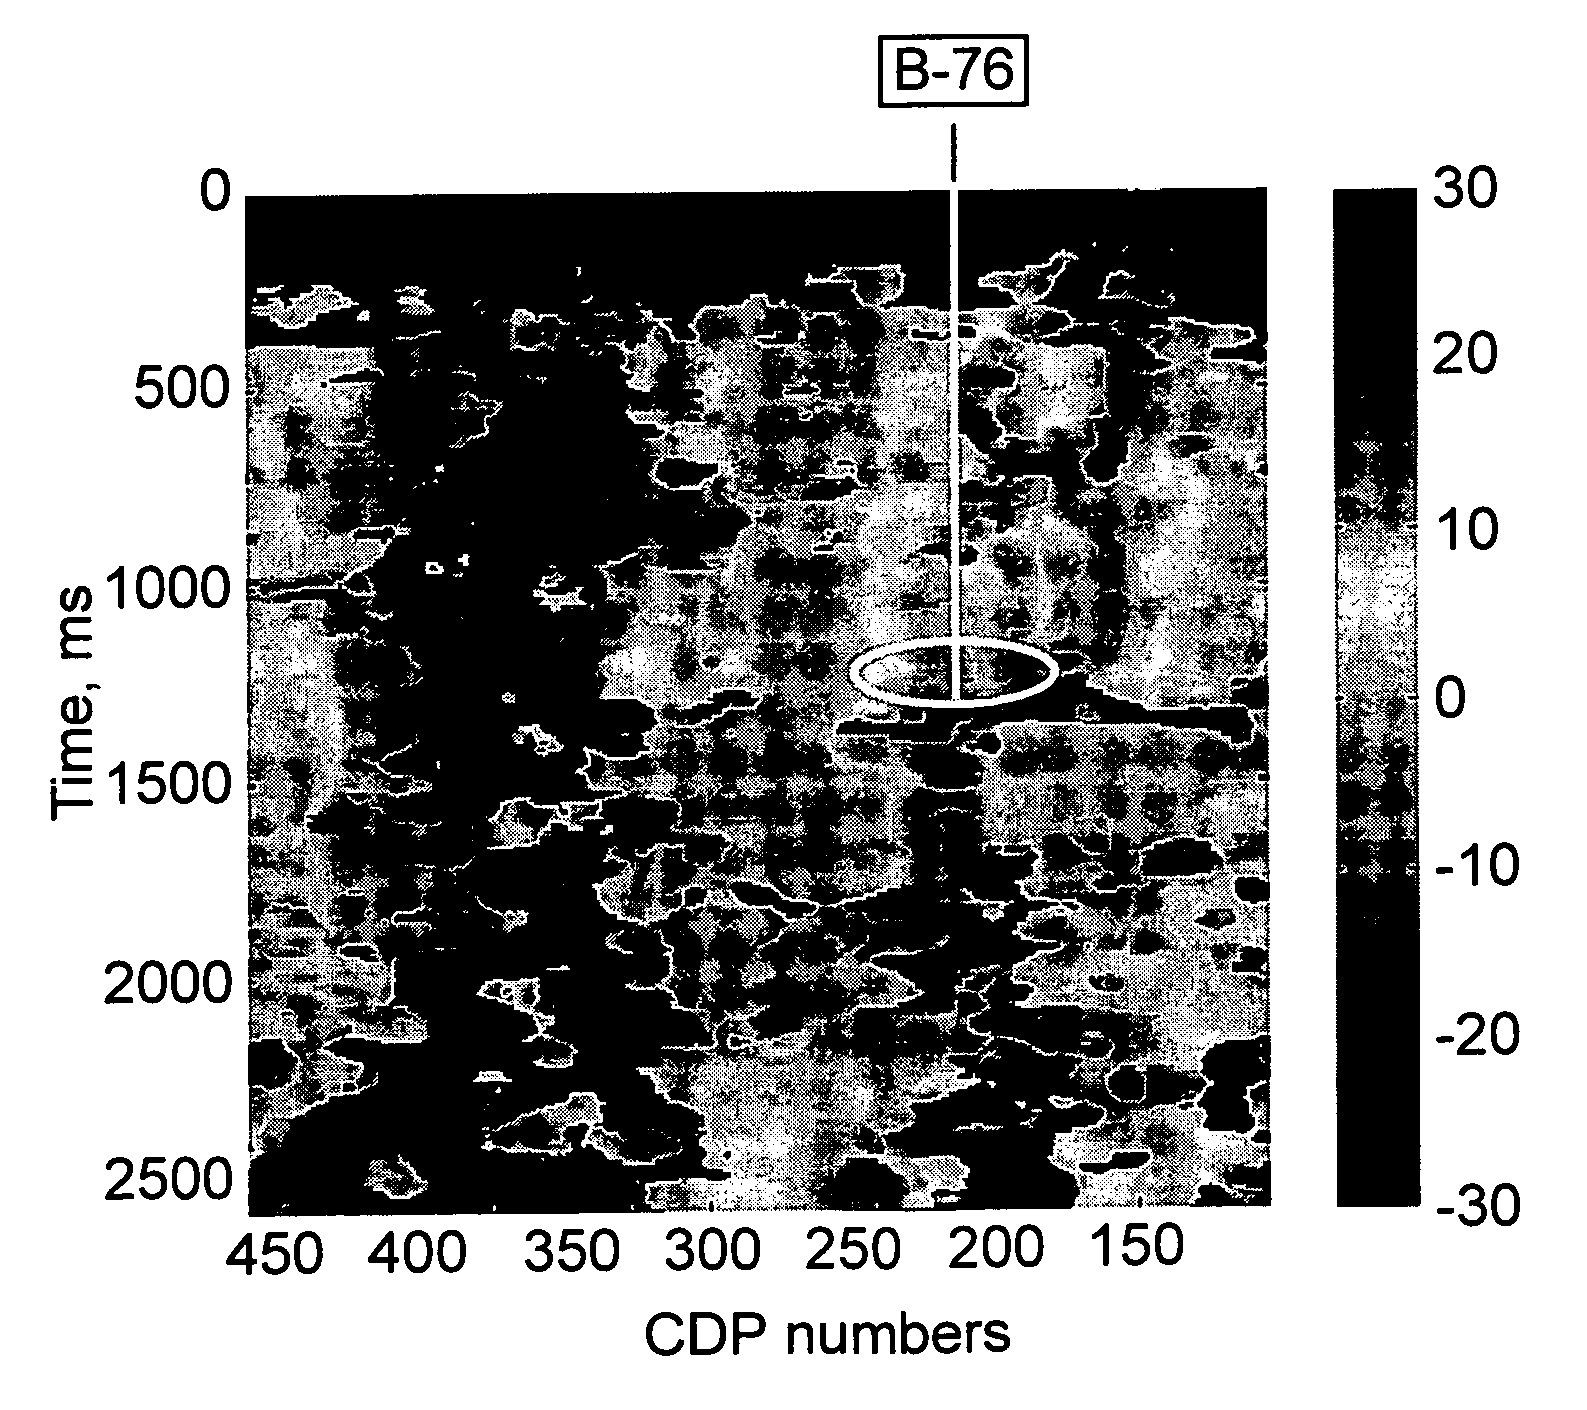
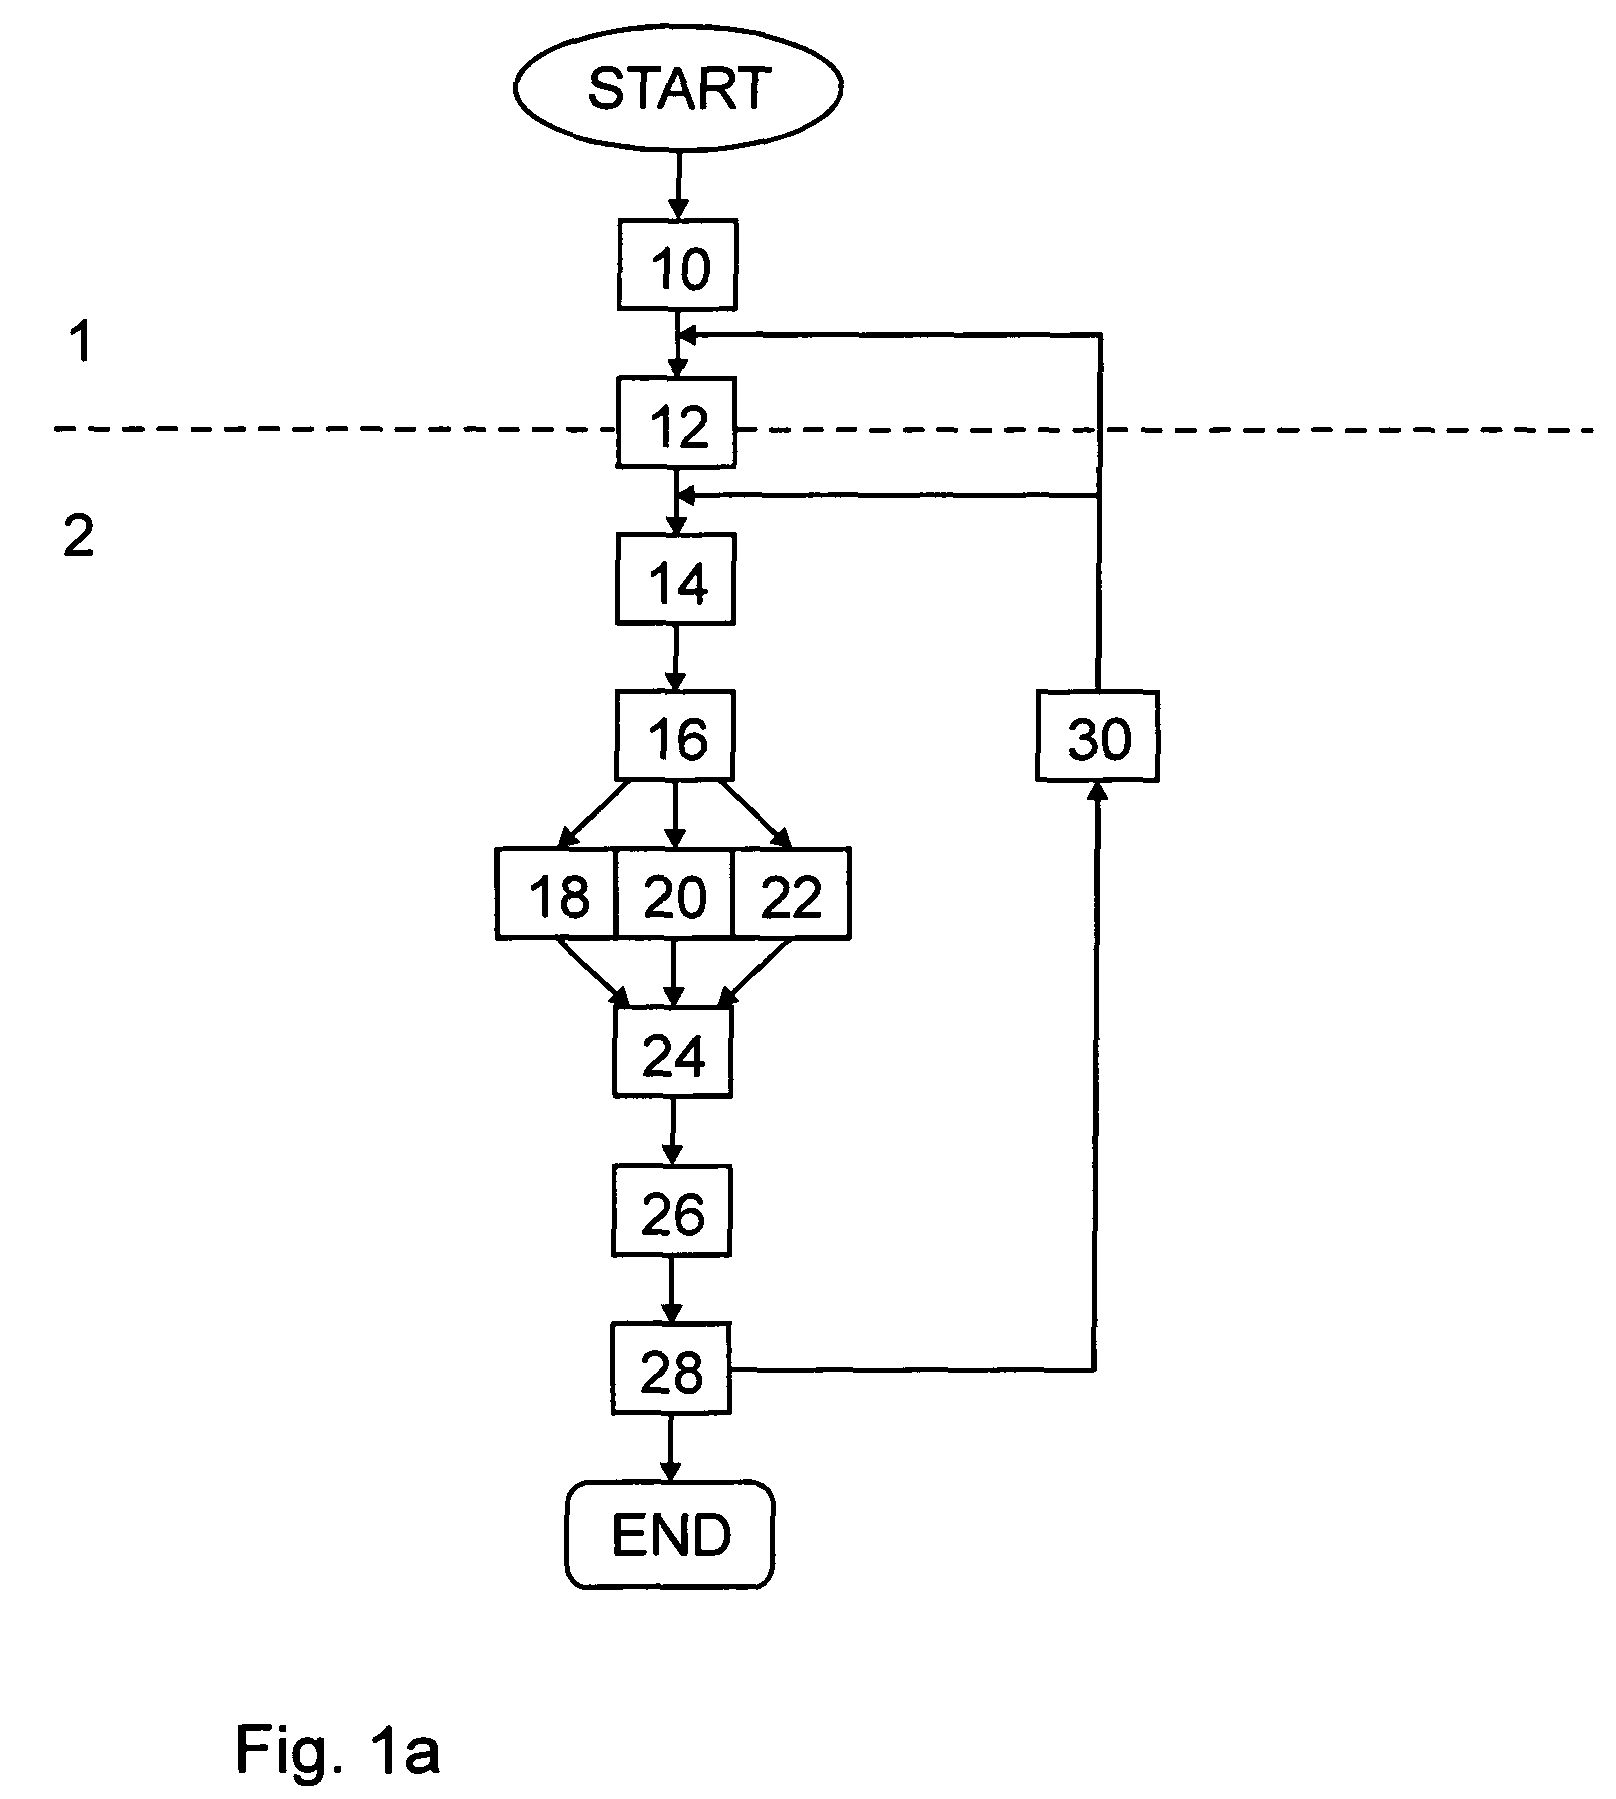
[0060]Referring to FIG. 1a, a simplified flow diagram of a method for processing multi-dimensional signal data to determine frequency dependent features therefrom according to the invention is shown. The multi-dimensional signal data received for processing—box 10—comprise, for example, two- or three-dimensional data indicative of a characteristic of an object or physical event. Such data are, for example, seismic data—seismic sections—indicative of structural features in the ground of an investigated area as will be shown in an example below. The multi-dimensional data are space-dependent, i.e. the signal data are dependent upon two or three space coordinates or, alternatively, time-space-dependent, i.e. the signal data are dependent upon time and one or two space coordinates. As will become evident to those of skill in the art, the method for processing multi-dimensional signal data according to the invention is not limited to seismic data, but is beneficial for extracting frequen...

second embodiment

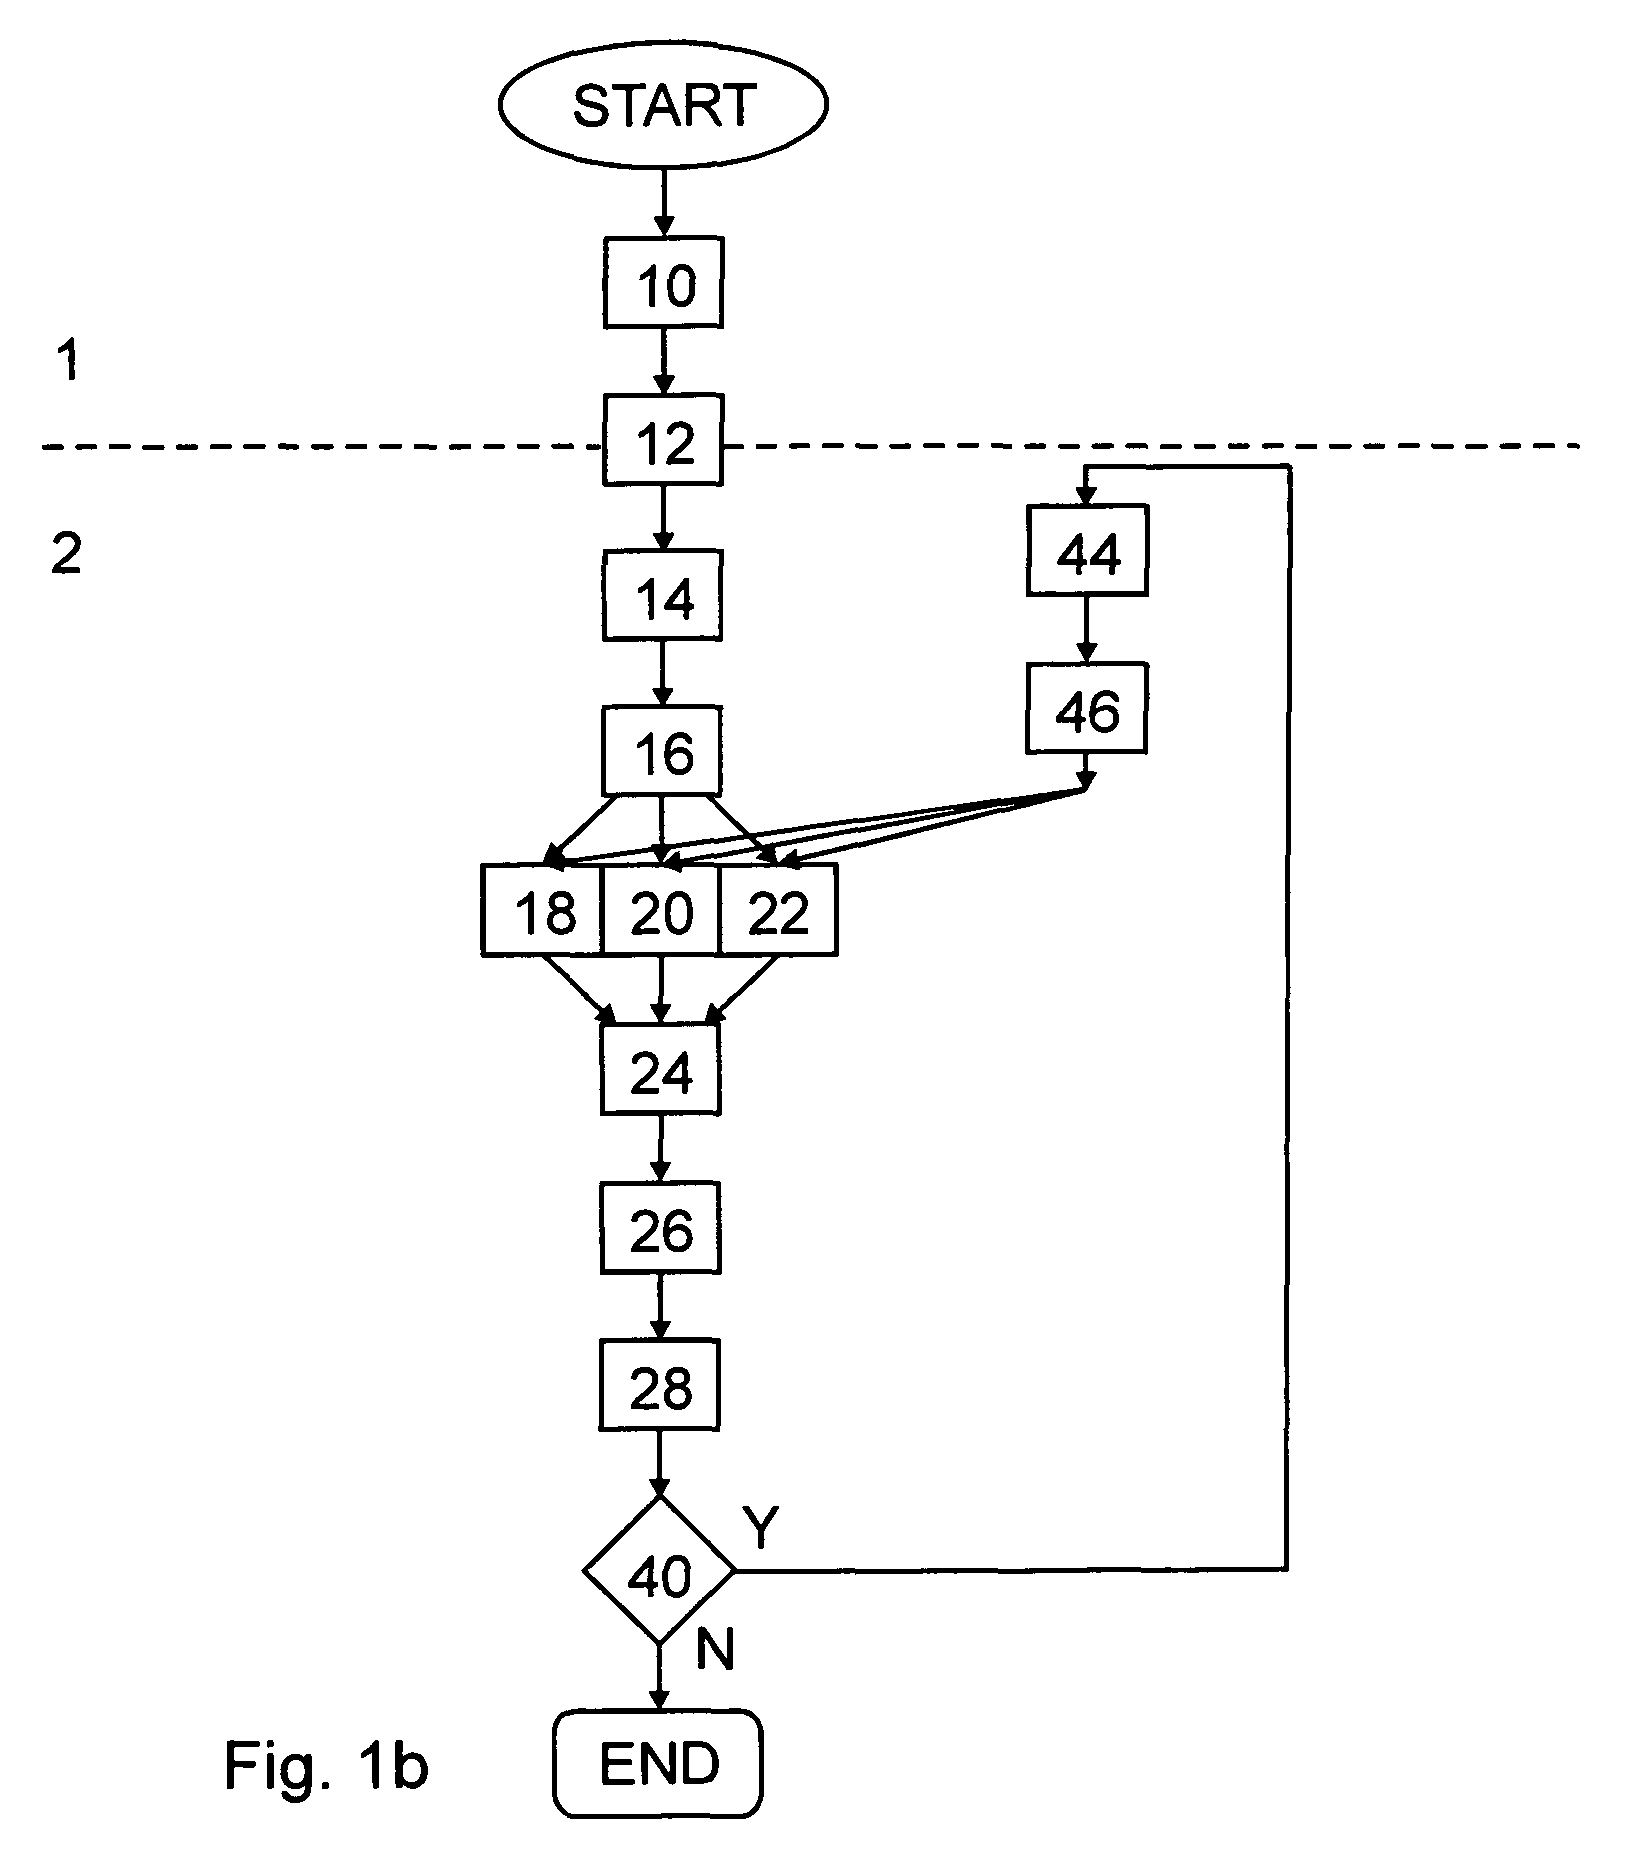
[0062]Referring to FIG. 1b, a simplified flow diagram of a method for processing multi-dimensional signal data to determine frequency dependent features therefrom according to the invention is shown. Here, the determination of secondary features is integrated into the method shown in FIG. 1a to replace the dominant feature at locations where the same is determined to be indicative of noise or an artifact. For simplicity, same reference numerals are used for same processing steps. Referring to box 40, a user determines if at a location the dominant feature is indicative of noise or an artifact. At such a location secondary features are determined corresponding to peak values smaller than the largest value of the second signal data—box 44. At each of these locations a wave-vector corresponding to the secondary features is determined—box 46—for replacing the wave-vector corresponding to the dominant feature in the following processing steps. Optionally, the secondary features are enhan...

third embodiment

[0063]Referring to FIG. 1d, a method for processing multi-dimensional signal data to determine frequency dependent features therefrom according to the invention is shown. Here, the received multi-dimensional data are three-dimensional—or higher. For simplicity, same reference numerals as in FIG. 1a are used for same processing steps. To reduce the requirements for computer memory and computing time it is possible, as outlined above, to divide the three-dimensional data into NSub two-dimensional “slices”—or sub-sections—through selected values of x, y, and z—box 50—and then to calculate the two dimensional space-frequency or time-space-frequency transform of each of the slices—box 12. The signal processing according to the boxes 14 and 16 are performed for each of the “slices”. Based on the wave-vectors of the NSub “slices” dip, frequency, and amplitude are then determined to provide dip, frequency, and amplitude volumes.

[0064]Obviously, the various embodiments of the method for proc...


PUM


Abstract

The present invention relates to a method and system for processing multi-dimensional signal data to determine frequency dependent features therefrom. The multi-dimensional signal data are transformed into space-frequency or time-space-frequency domain, providing second signal data. At predetermined locations of at least a portion of the one of space and time-space of the second signal data a dominant feature corresponding to a largest value of the second signal data is determined. This is followed by the determination of a wave-vector corresponding to the dominant feature at each of the predetermined locations. Finally, a dip map, a frequency map, and an amplitude map are generated using the wave-vectors. The method and system for processing multi-dimensional signal data to determine frequency dependent features therefrom according to the present invention provide a powerful tool for improved and more detailed evaluation of seismic data using dip, frequency, and amplitude maps, resulting in substantially more accurate geophysical surveys.

Description

[0001]This application claims benefit from U.S. Provisional Patent Application No. 60 / 749,638 filed Dec. 13, 2005 the entire contents of which are incorporated herein by reference.FIELD OF THE INVENTION[0002]This invention relates to signal processing and in particular to a signal processing method and system for local dominant wave-vector analysis of seismic data.BACKGROUND OF THE INVENTION[0003]Interpretation of seismic data, for example, in determining locations of candidate petroleum reservoirs, is typically based on various techniques of visualizing processed seismic sections. Traditionally, two-dimensional (2-D) seismic interpretation is based on a migrated post-stack seismic section—often referred to simply as the seismic section—for visualization. The migrated post-stack seismic section shows amplitudes of fully processed seismic traces as functions of time and Common Depth Point (CDP) position.[0004]With the emergence of three-dimensional (3-D) seismic techniques, the 2-D s...

Claims


Application Information

Patent Timeline
Patent Type & Authority Patents(United States)
IPC IPC(8): G06K9/00G01V1/00H03F1/26
CPCG06K9/0053G01V1/28G06F2218/10
Inventor PINNEGAR, CHARLES ROBERTLEMIRE, PIERREKONG, RYANBIRD, DOUG
Owner CALGARY SCIENTIFIC INC
Why Eureka
Try Eureka