Diffusion bases methods for segmentation and clustering

a clustering and diffusion base technology, applied in the field of image processing algorithms, can solve the problems methods that fail to produce satisfactory segmentation, and none of the segmentation/clustering methods described above are intended for segmentation/clustering of hyper-spectral data volumes. , to achieve the effect of reducing the dimensionality of data

Inactive Publication Date: 2011-06-14
SCHCLAR ALON +1
View PDF3 Cites 7 Cited by
  • Summary
  • Abstract
  • Description
  • Claims
  • Application Information

AI Technical Summary

Benefits of technology

[0038]The present invention provides a basic technology that offers a coherent methodology to efficiently handle both USDs and HDDs. While the invention is described in detail with reference to processing USDs, it can equally well be applied to HDD problems. For example, the algorithm disclosed in this invention can detect buildups that lead to computer crashes and reveal correlations between different measured quantities.
[0040]The invention provides a framework based on diffusion processes for finding meaningful geometric descriptions in data sets. The proposed framework relates the spectral properties of Markov processes to their geometric counterparts. It enables to reduce the dimensionality of data and embed it into smaller subspaces where all the requested and sought-after information lies, while the geometric coherency of the dataset is preserved in the dimension-reduced subspaces. It also enables to discover meaningful visual connections in huge data sets.

Problems solved by technology

The main challenge is to reduce the dimensionality of the data, embedding it in a 2-3 dimensional space while preserving its original structure in its full dimensionality.
a) Learning phase: Normal data activities are studied and the data parameters are extracted. This is performed once or a very limited number of times during the day.
b) Prediction phase: Based on the learning phase, each new record of data that arrives in a time unit is analyzed to determine whether it belongs to normal behavior or whether it deviates from it. The latter case might be an indication of a problem buildup. This phase predicts and classifies the behavior of this dynamic dataset.
These methods fail to produce a satisfactory segmentation in the presence of noise.
None of the segmentation / clustering methods which are described above are intended for segmentation / clustering of hyper-spectral data volumes.
However, this method uses a pixel similarity matrix without attempting to reduce the dimensionality of the data, which renders it to be computationally expensive.
However, they only guarantee to discover the true structure of data in case it lies on or near a linear subspace of the high-dimensional input.
However, the pitfall of these methods is that they are global i.e. they take into account the distances between every pair of points.
This makes them highly sensitive to noise.
Furthermore, many datasets contain nonlinear structures that can not be detected by PCA and MDS.

Method used


Image

  • Diffusion bases methods for segmentation and clustering
  • Diffusion bases methods for segmentation and clustering
  • Diffusion bases methods for segmentation and clustering

Examples


first embodiment

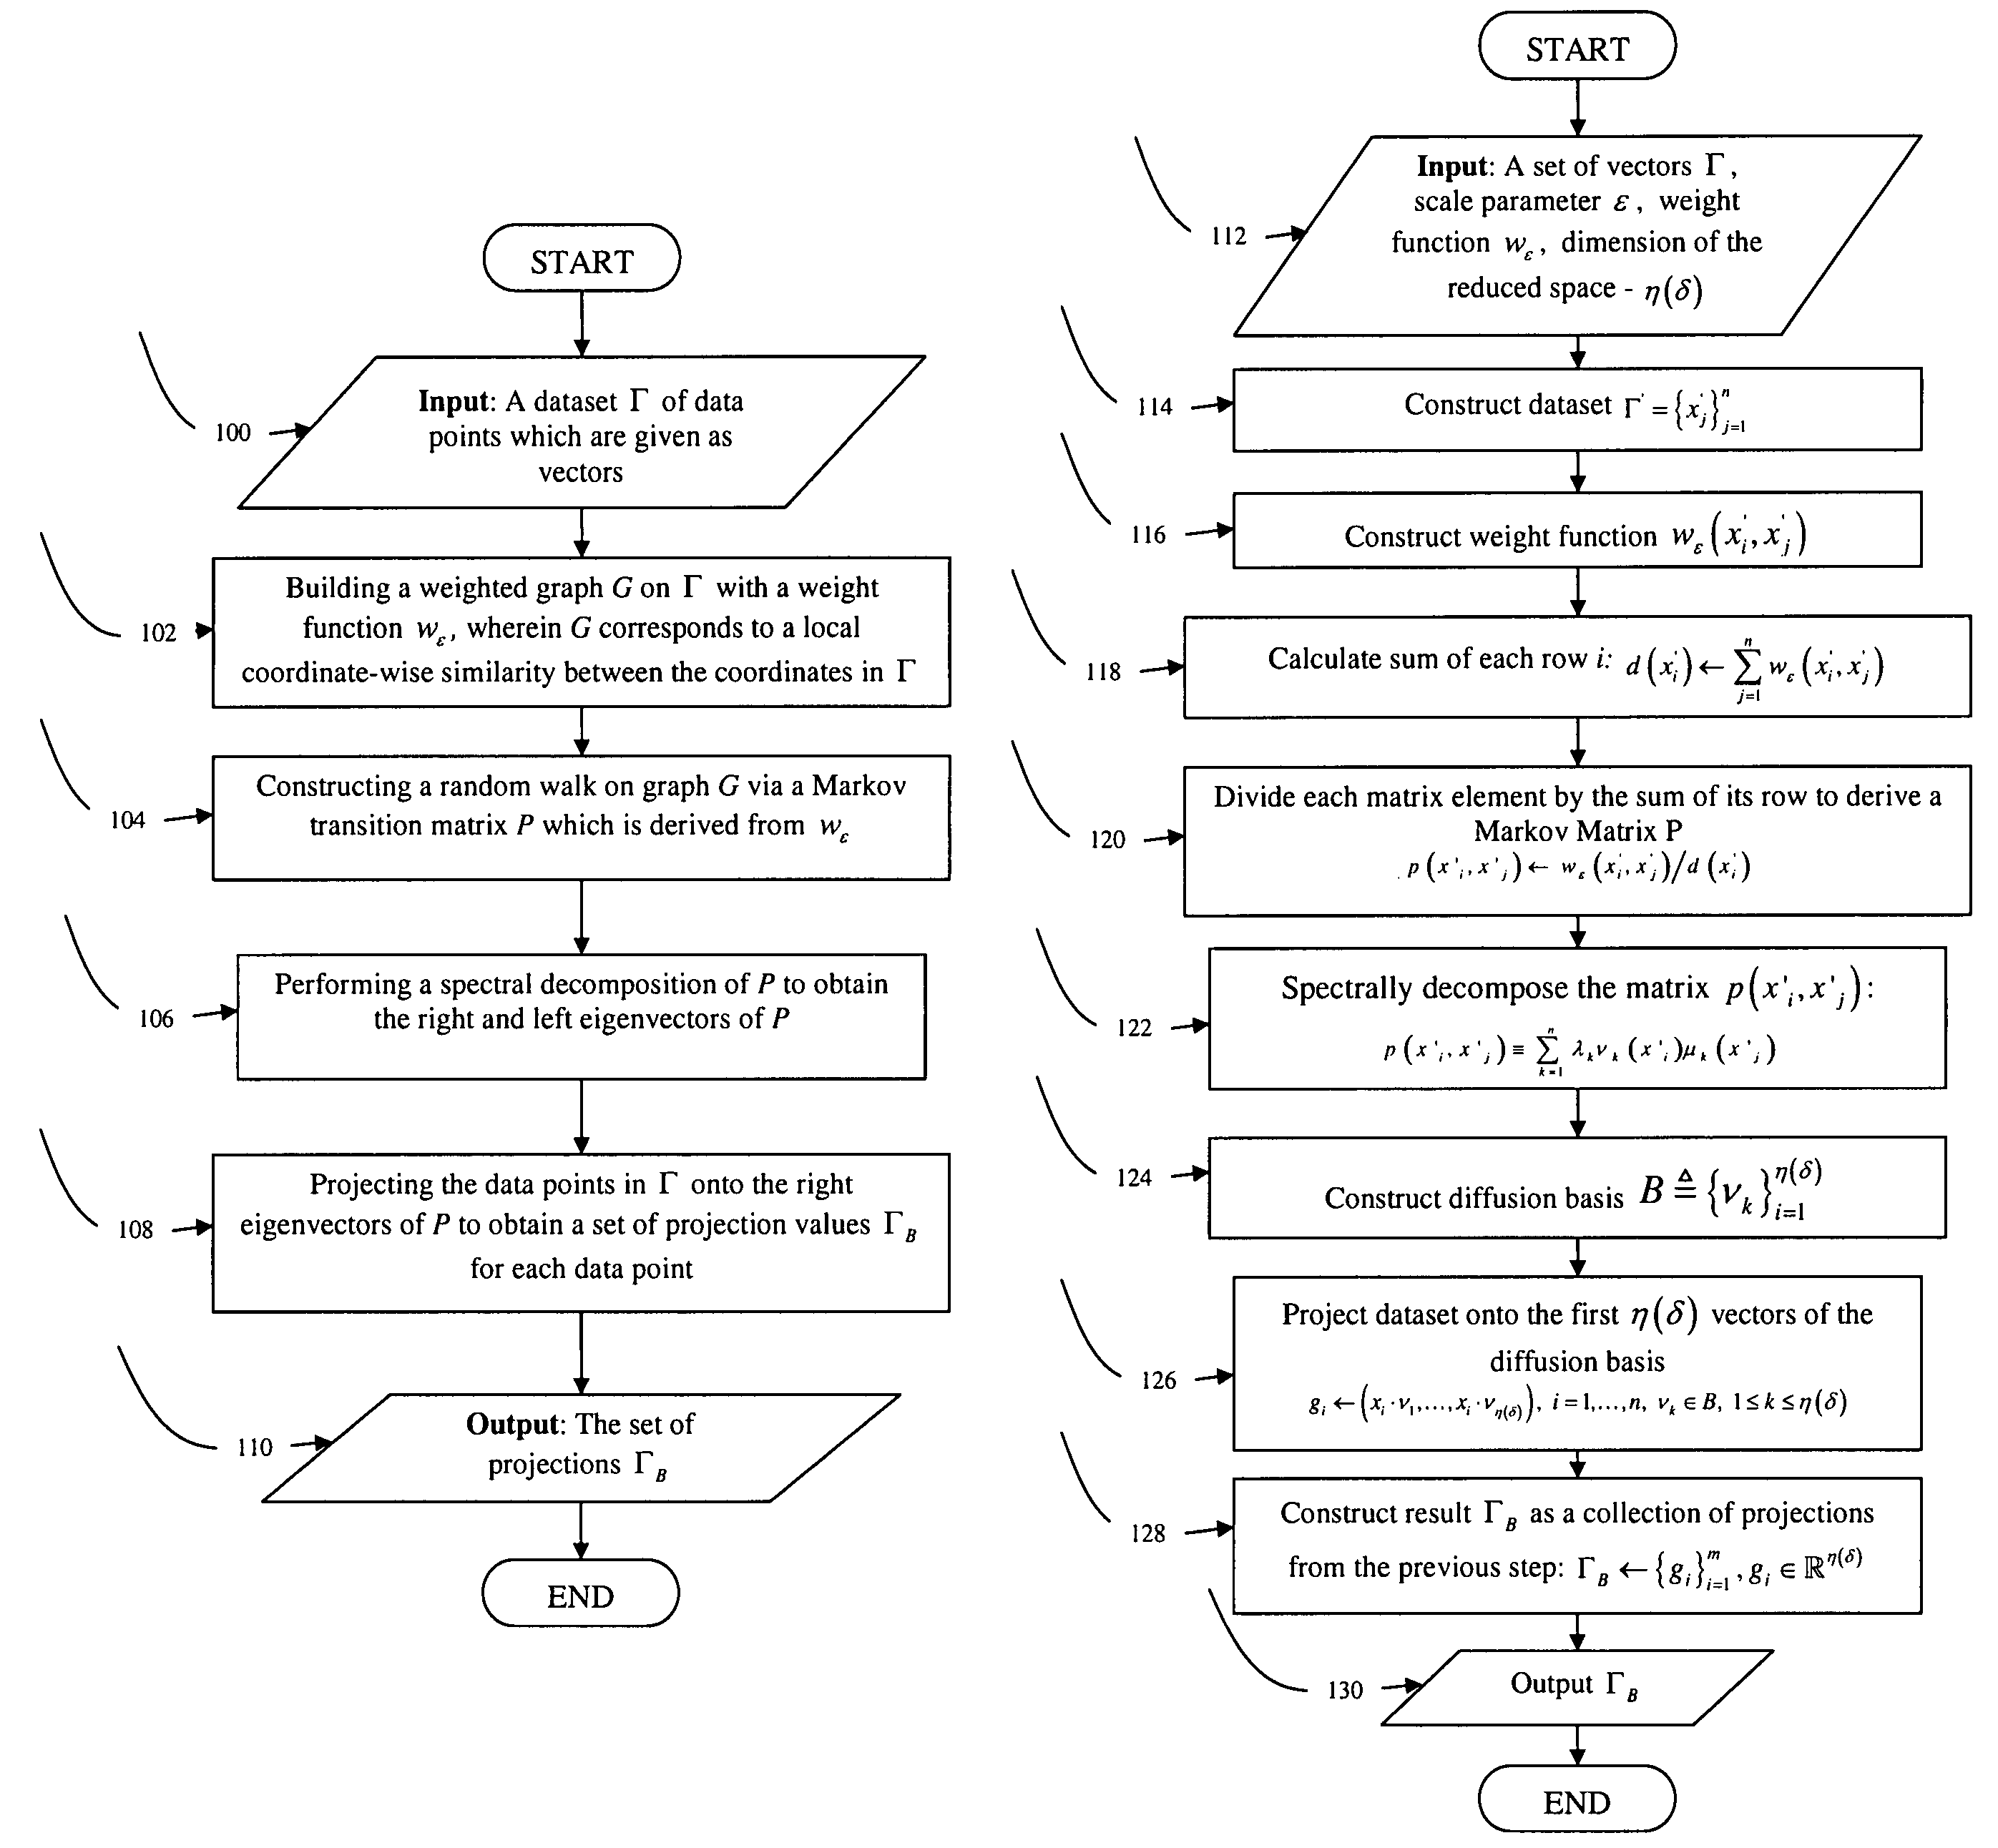
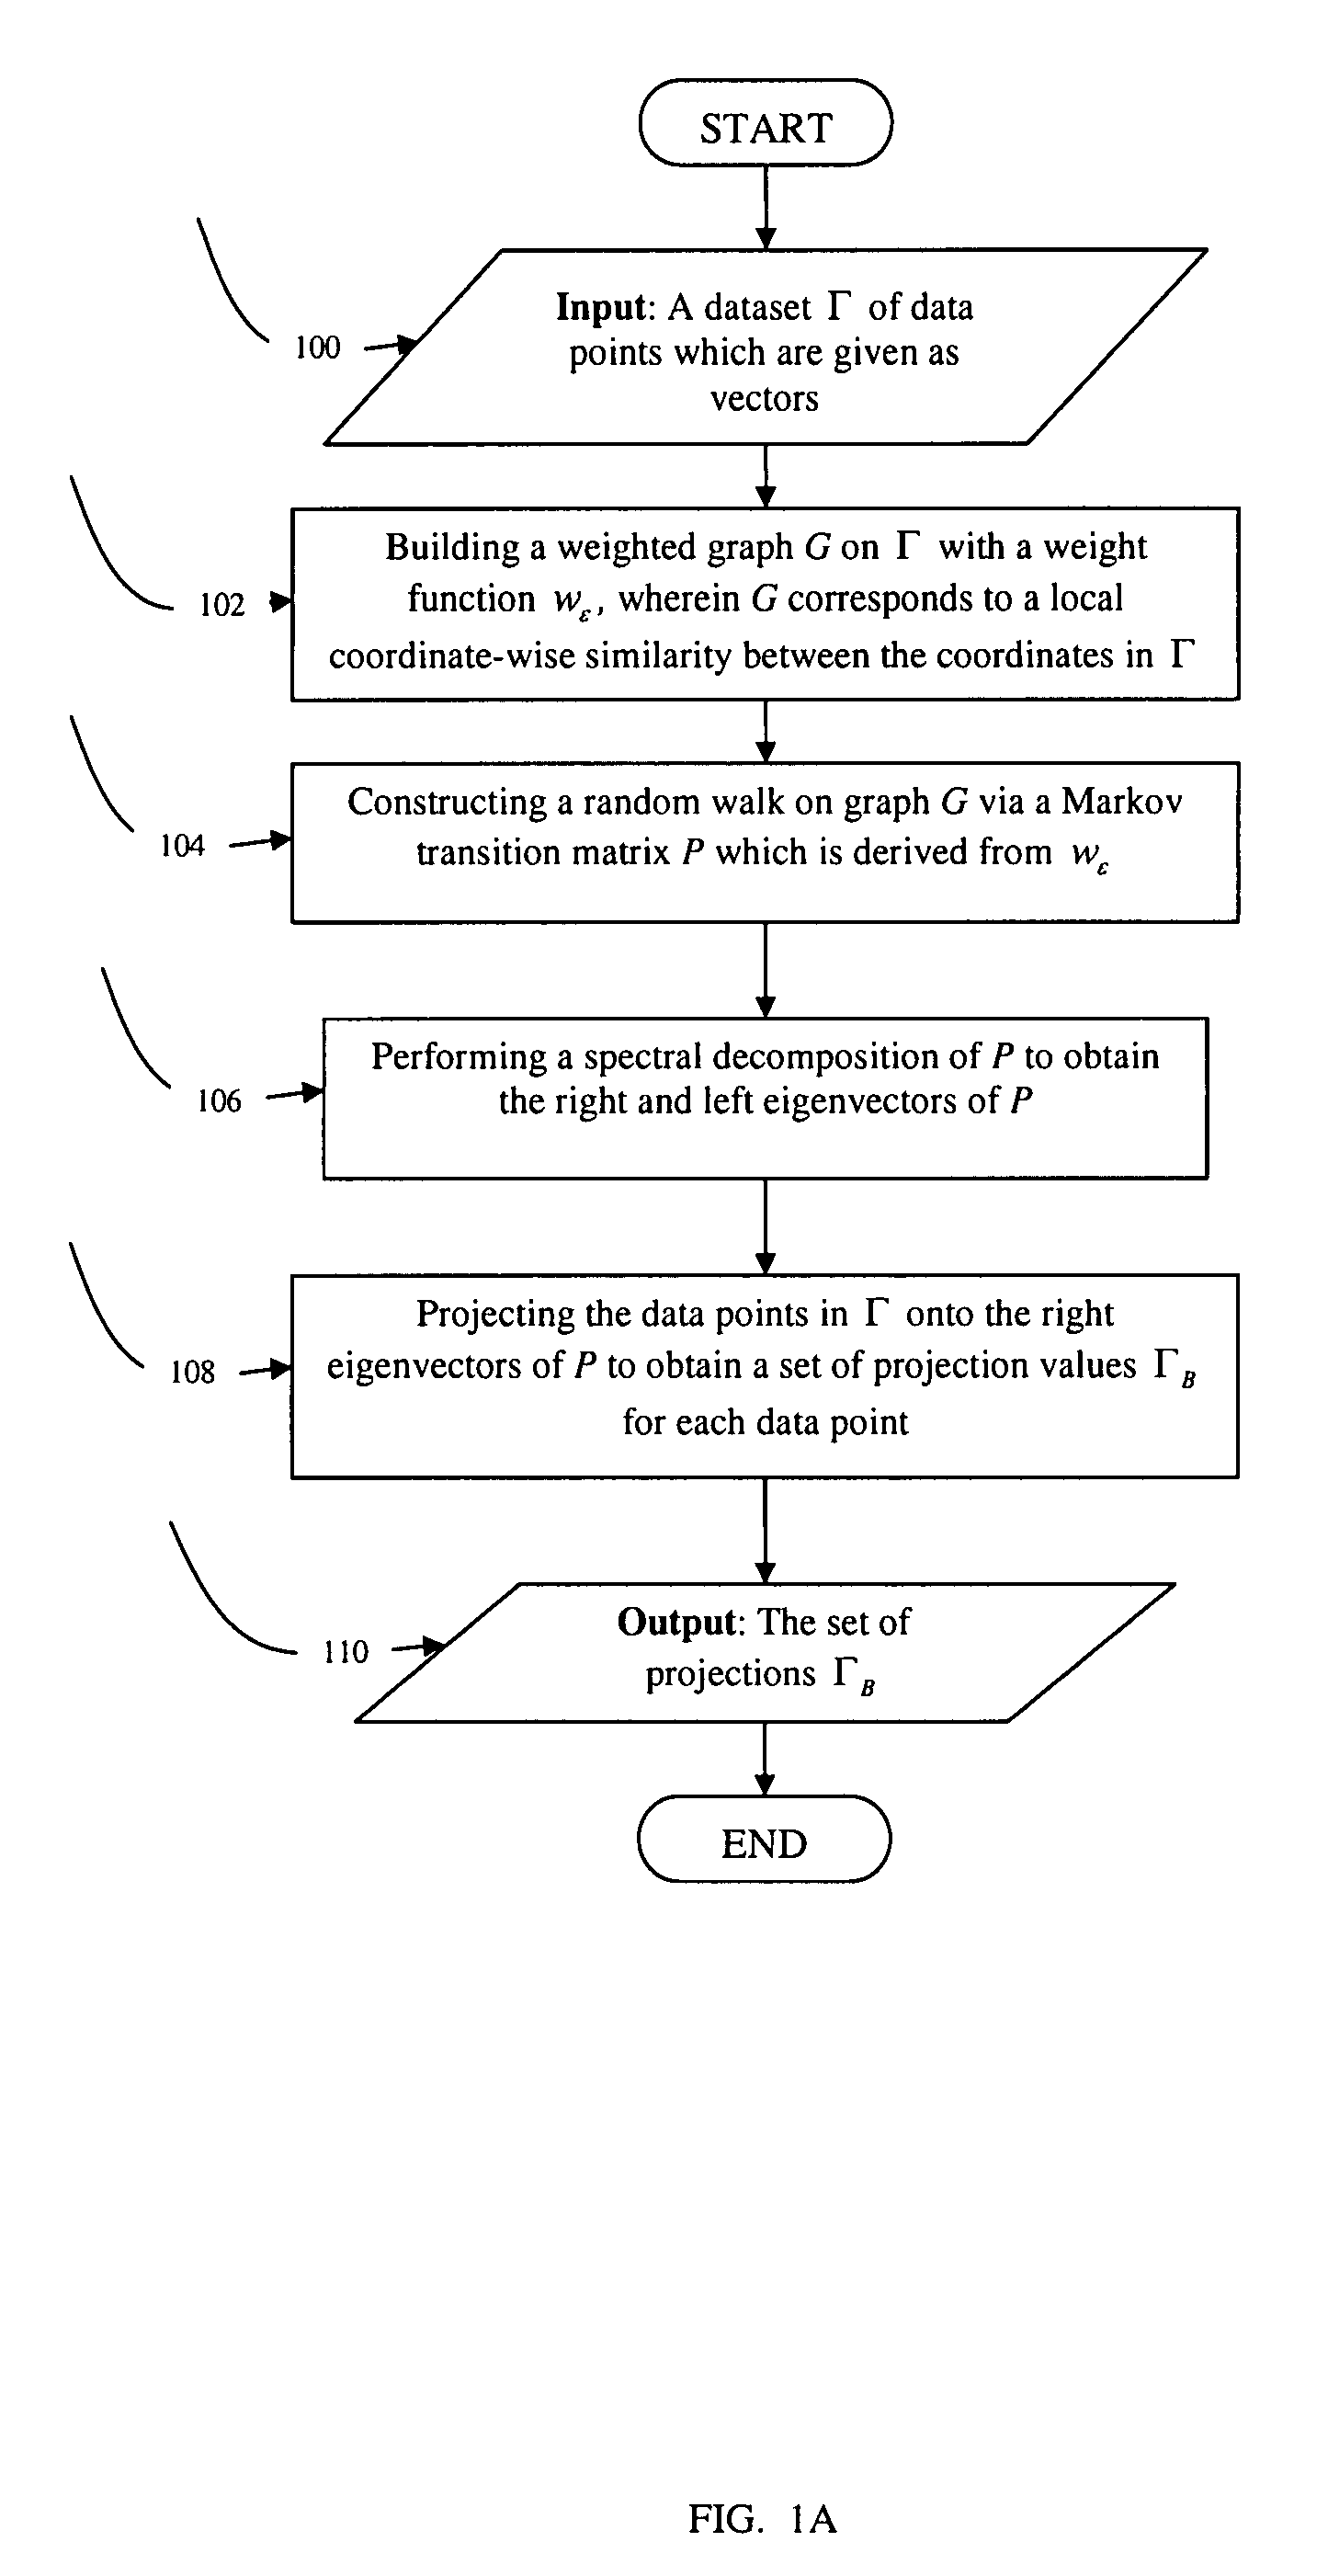
[0075]FIG. 1a shows the main steps of the DB algorithm. A dataset Γ of data points which are given as vectors is provided in step 100. A graph G is then built on Γ with a weight function wε in step 102. The weight function corresponds to the local coordinate-wise similarity between the coordinates in Γ. A random walk is constructed on graph G via a Markov transition matrix P which is derived from wε in step 104. A spectral decomposition of P is performed in step 106, and the data points in Γ are projected onto the eigenvectors of P in step 108. The set of projections ΓB is then output in step 110.

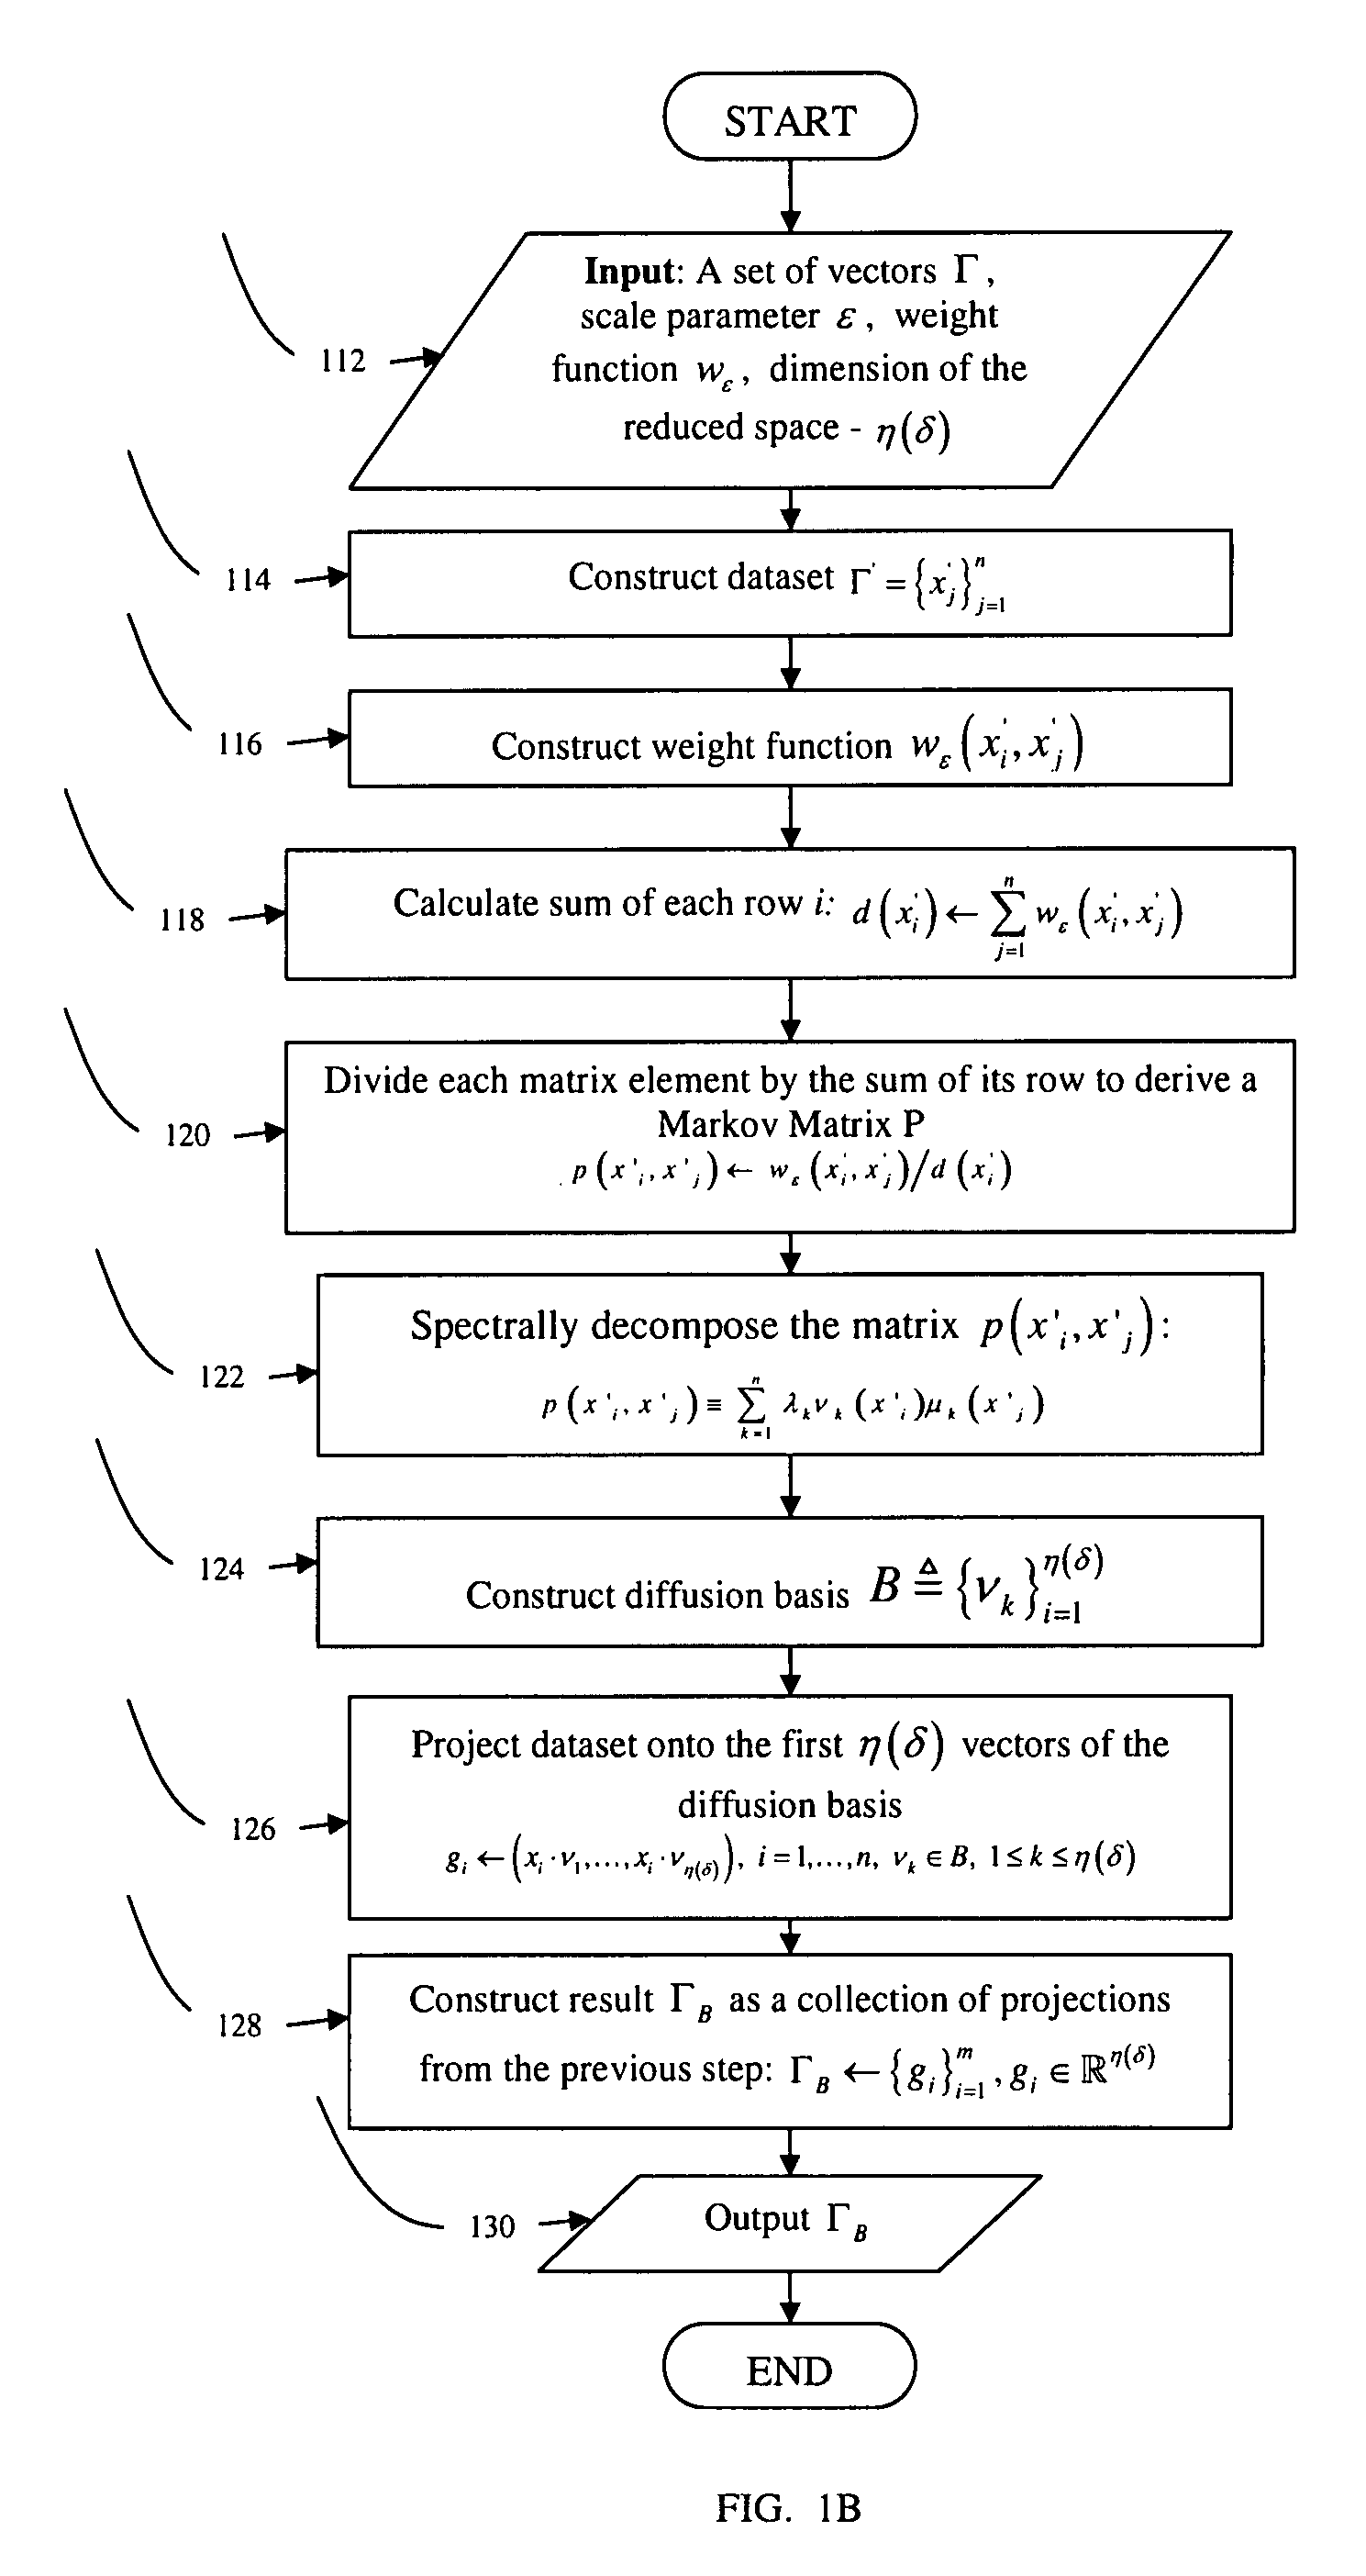
[0076]FIG. 1b provides more details of the steps in FIG. 1a. The dataset Γ, the scale parameter ε, the weight function wε and the dimension of the reduced space η(δ) are input in step 112 to the DB algorithm. Let Γ={xi}i=1m,xiεn be the original dataset of vectors in n and let xi(j) denote the jth coordinate of xi, 1≦j≦n. The vector xj′(x1(j), . . . , xm(j)) is defined to be the jth coordina...

second embodiment

[0083]FIG. 2a shows the main steps of the DB algorithm according to the present invention. This is a “modified” DB algorithm with steps similar to that in FIG. 1a (i.e. steps 200, 202 match steps 100, 102 therein) except for the third step (204). The main difference vs. algorithm of FIG. 1a is that instead of constructing a Markov matrix P as in 104, step 204 constructs a matrix A which is the result of dividing each element of wε by the square sum of its row times the square sum of its column.

[0084]FIG. 2b describes in more detail the modified algorithm. Steps 212-218 are identical to steps 112-118. Dataset Γ, weight function wε, scale parameter ε and the dimension of the reduced space η(δ) are input to the modified algorithm in step 212. A dataset Γ′={xj′}j=1n is constructed in step 214. The weight function is calculated for Γ′ in step 216, as described in Eq. 1. Matrix A is then constructed in steps 218 and 220 following respectively Eqns. 3 and 8. A is spectrally decomposed acco...


PUM

PropertyMeasurementUnit
wavelengthsaaaaaaaaaa

Abstract

Methods for dimensionality reduction of large data volumes, in particular hyper-spectral data cubes, include providing a dataset Γ of data points given as vectors, building a weighted graph G on Γ with a weight function wε, wherein wε corresponds to a local coordinate-wise similarity between the coordinates in Γ; obtaining eigenvectors of a matrix derived from graph G and weight function wε, and projecting the data points in Γ onto the eigenvectors to obtain a set of projection values ΓB for each data point, whereby ΓB represents coordinates in a reduced space. In one embodiment, the matrix is constructed through the dividing each element of wε by a square sum of its row multiplied by a square sum of its column. In another embodiment the matrix is constructed through a random walk on graph G via a Markov transition matrix P, which is derived from wε. The reduced space coordinates are advantageously used to rapidly and efficiently perform segmentation and clustering.

Description

FIELD AND BACKGROUND OF THE INVENTION[0001]The present invention relates to image processing algorithms and particularly to algorithms used to process large data volumes (“cubes”).[0002]Two cube-generating applications relevant to the present invention are hyper-spectral imaging, which provides uniform (homogeneous) static datasets (USD), and use of monitoring systems, which provides heterogeneous dynamic datasets (HDD). The volumetric size depends both on the number of wavelengths / network activities and on the number of recorded samples. The main challenge is to reduce the dimensionality of the data, embedding it in a 2-3 dimensional space while preserving its original structure in its full dimensionality. Once the data is embedded, it is visualized in order to reveal and locate geometric meaningful structures (segments or clusters).[0003]“Uniform” data include pixels in images / video and pixels in hyper-spectral images. The basic elements in USDs are all pixel-based. Finding unifor...

Claims


Application Information

Patent Timeline
Patent Type & Authority Patents(United States)
IPC IPC(8): G06K9/00G06K9/34G06K9/40G06K9/36G06K9/62G01N33/48G06V10/28
CPCG06K9/342G06K9/6252G06K9/6224G06K9/38G06V10/28G06V10/267G06V10/7635G06V10/7715G06F18/2323G06F18/21375
Inventor SCHCLAR, ALONAVERBUCH, AMIR ZEEV
Owner SCHCLAR ALON
Why Eureka
Try Eureka