Method for the determination of the concentration of a non-volatile analyte

a non-volatile analyte, concentration technology, applied in the direction of naphthalimide/phthalimide dye, optical radiation measurement, instruments, etc., can solve the problems of unsatisfactory plurality of fluids and other supplies, requiring expensive apparatus, and requiring time-consuming calibrating procedures involving various calibrating media prior to actual measuremen

Active Publication Date: 2012-04-17
ROCHE DIAGNOSTICS OPERATIONS INC
View PDF1 Cites 11 Cited by
  • Summary
  • Abstract
  • Description
  • Claims
  • Application Information

AI Technical Summary

Benefits of technology

[0201]It is advantageous to perform the single-point-calibration at an analyte concentration which lies in the expected range of the sample analyte concentration. Preferably the analyte concentration is chosen such that the ratio cB / cD (eqn. 6) has a value between 0.1 and 0.9, even more preferably between 0.3 and 0.7.

Problems solved by technology

As a consequence, time-consuming calibrating procedures involving various calibrating media prior to actual measurement will not be acceptable, especially when “single-use” sensors are concerned.
Since the cost of miniaturized devices and sensing elements must be kept low, procedures requiring costly apparatus, complex sensing elements, or a plurality of fluids and other supplies are unsatisfactory.
This packaging method has the effect of limiting the shelf-life of these sensing devices.
Since sensors generally have a limited lifetime, they must be replaced at certain intervals.
Such factory calibration is both time-consuming and expensive, requiring extremely tight control over sensor characteristics and concomitant control over the characteristics of the measuring device or instrument.
As described below, very often a multiplicity of methods are applied within a single system, due to the scarcity of indicator molecules responsive to all desired analytes within their respective concentration ranges.
Such systems employing multiple methods are often complex and expensive.
In contrast to the measurement of luminescence decay time, the determination of luminescence intensity poses greater problems as regards the parameters of the components of the optical system.
Unfortunately there are a large number of analytes, especially ions and metabolites, for which no simple indicators or indicator systems with long luminescence decay times are available.
Indicators with decay times less than 100 nanoseconds (ns) are less affected by such problems, however the accurate and calibration-free determination of such small decay times usually requires more costly and complex instrumentation.
Transmission measurement using multiple analysis wavelengths is costly and requires measures to correct for variations of the characteristics of the optical components and of the light paths.
Working with multiple wavelengths or detection at multiple wavelengths with the characteristics of the optical components fully known demands costlier technology however.
In contrast to the measuring of pH-values there is a large number of analytes for which no luminescence indicators suitable for multiple wavelength methods are available.
A disadvantage here is the fact that certain parameters of the optical components of the measurement set-up and of the individual sensors, which influence luminescence intensity, will affect the measurement result.
Although it is basically possible to build optical systems and sensors with stable components and sensors whose characteristics are precisely determined, this will be unrealistic in view of the above requirements and the expense and costs involved.
The disadvantage is that the “shelf-life” of the sensors is limited to several months when they are stored in a liquid.
A further disadvantage lies in the fact that the single-use measuring element must hold the liquid without loss during shelf-life and that a fluidic system for transport of the calibration liquid must be provided.
Minimizing these variances is costly and therefore economically not feasible where low-cost measuring systems are concerned.

Method used


Image

  • Method for the determination of the concentration of a non-volatile analyte
  • Method for the determination of the concentration of a non-volatile analyte
  • Method for the determination of the concentration of a non-volatile analyte

Examples


example 1

(With Sub-Variants 1.1 (FIG. 1a), 1.2 (FIG. 1b), and 1.3 (FIG. 1c) Using Equations 1 to 10)

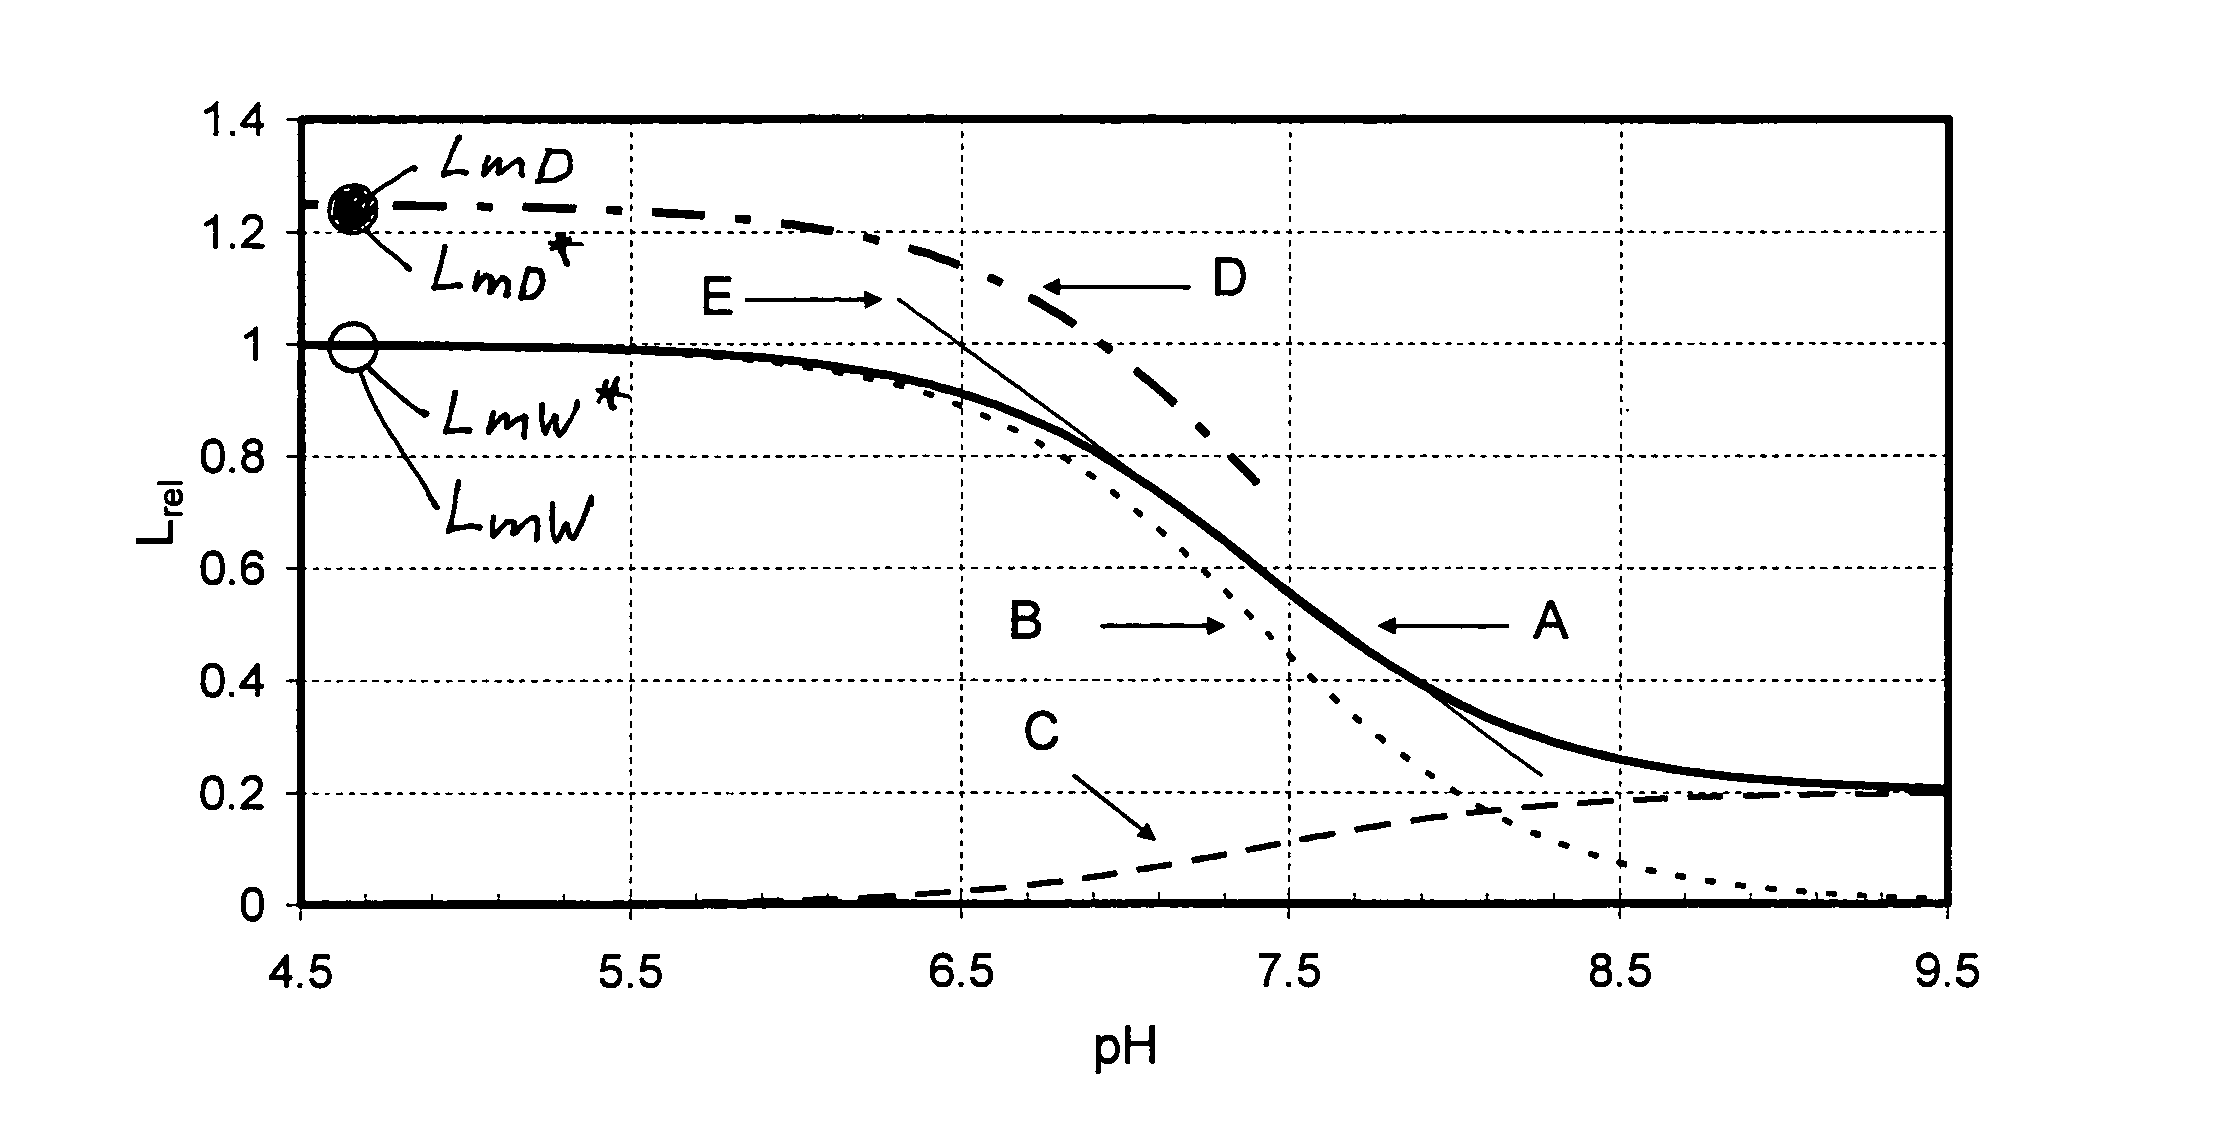
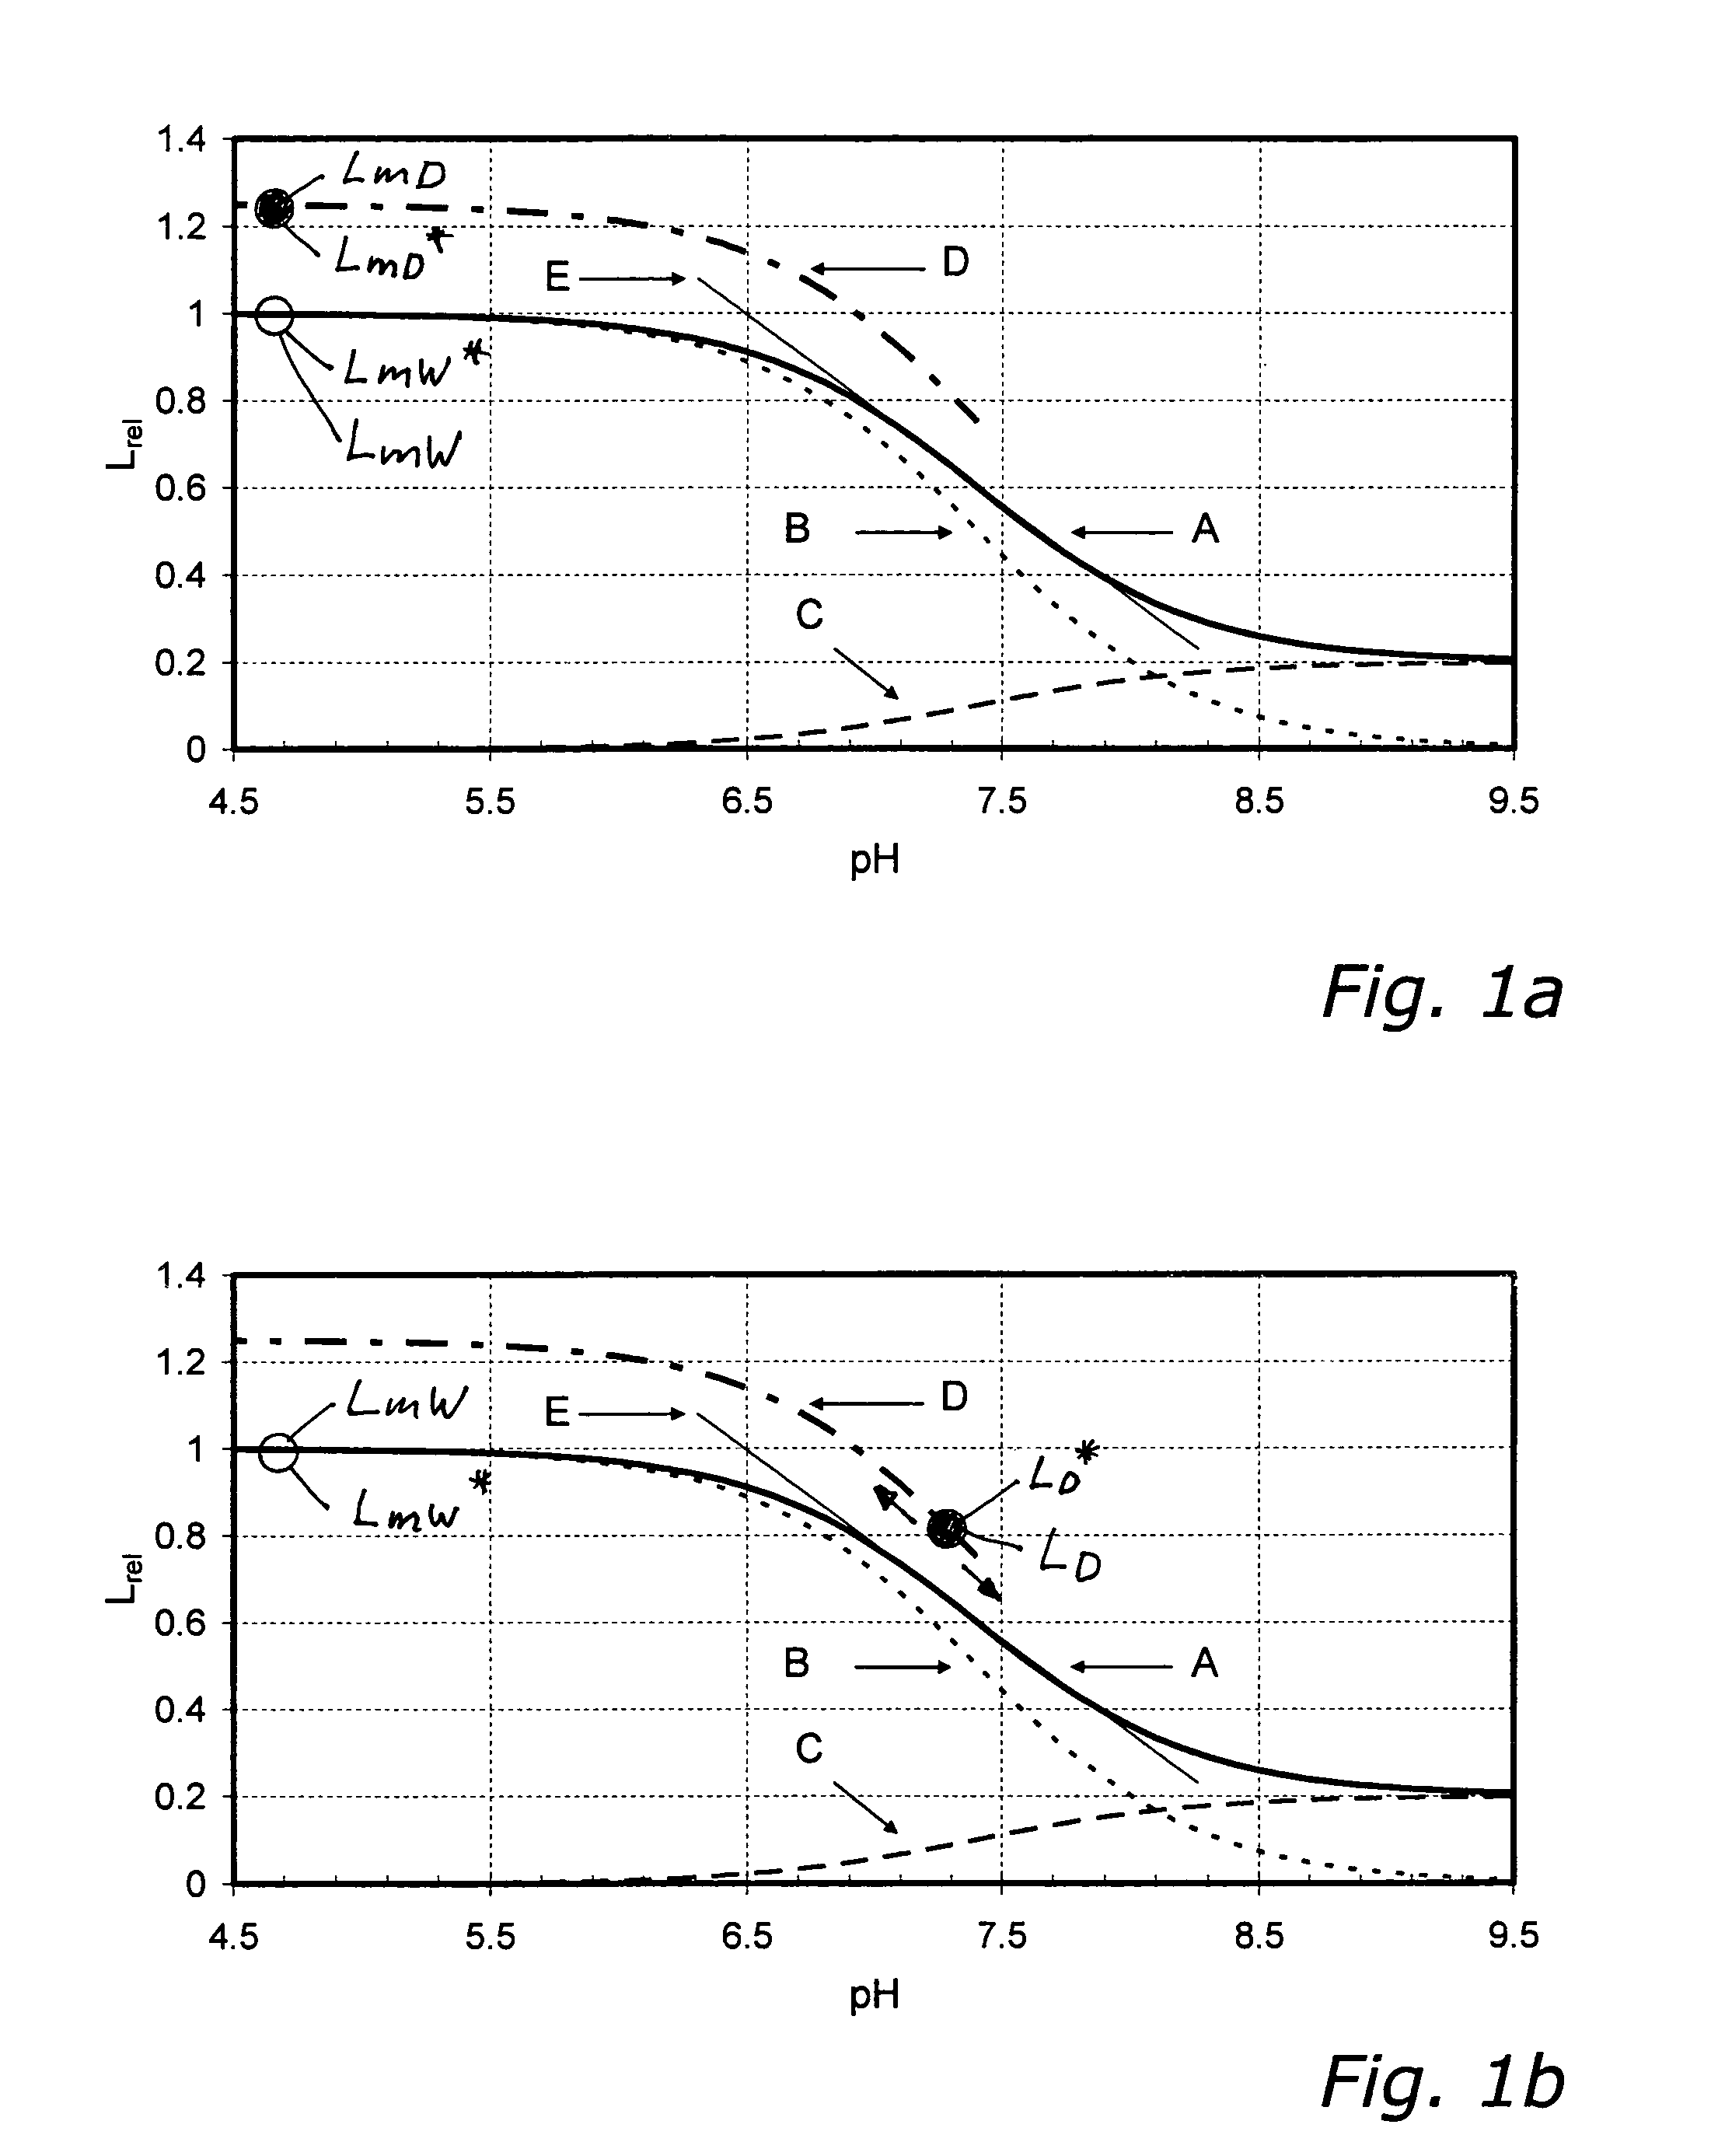
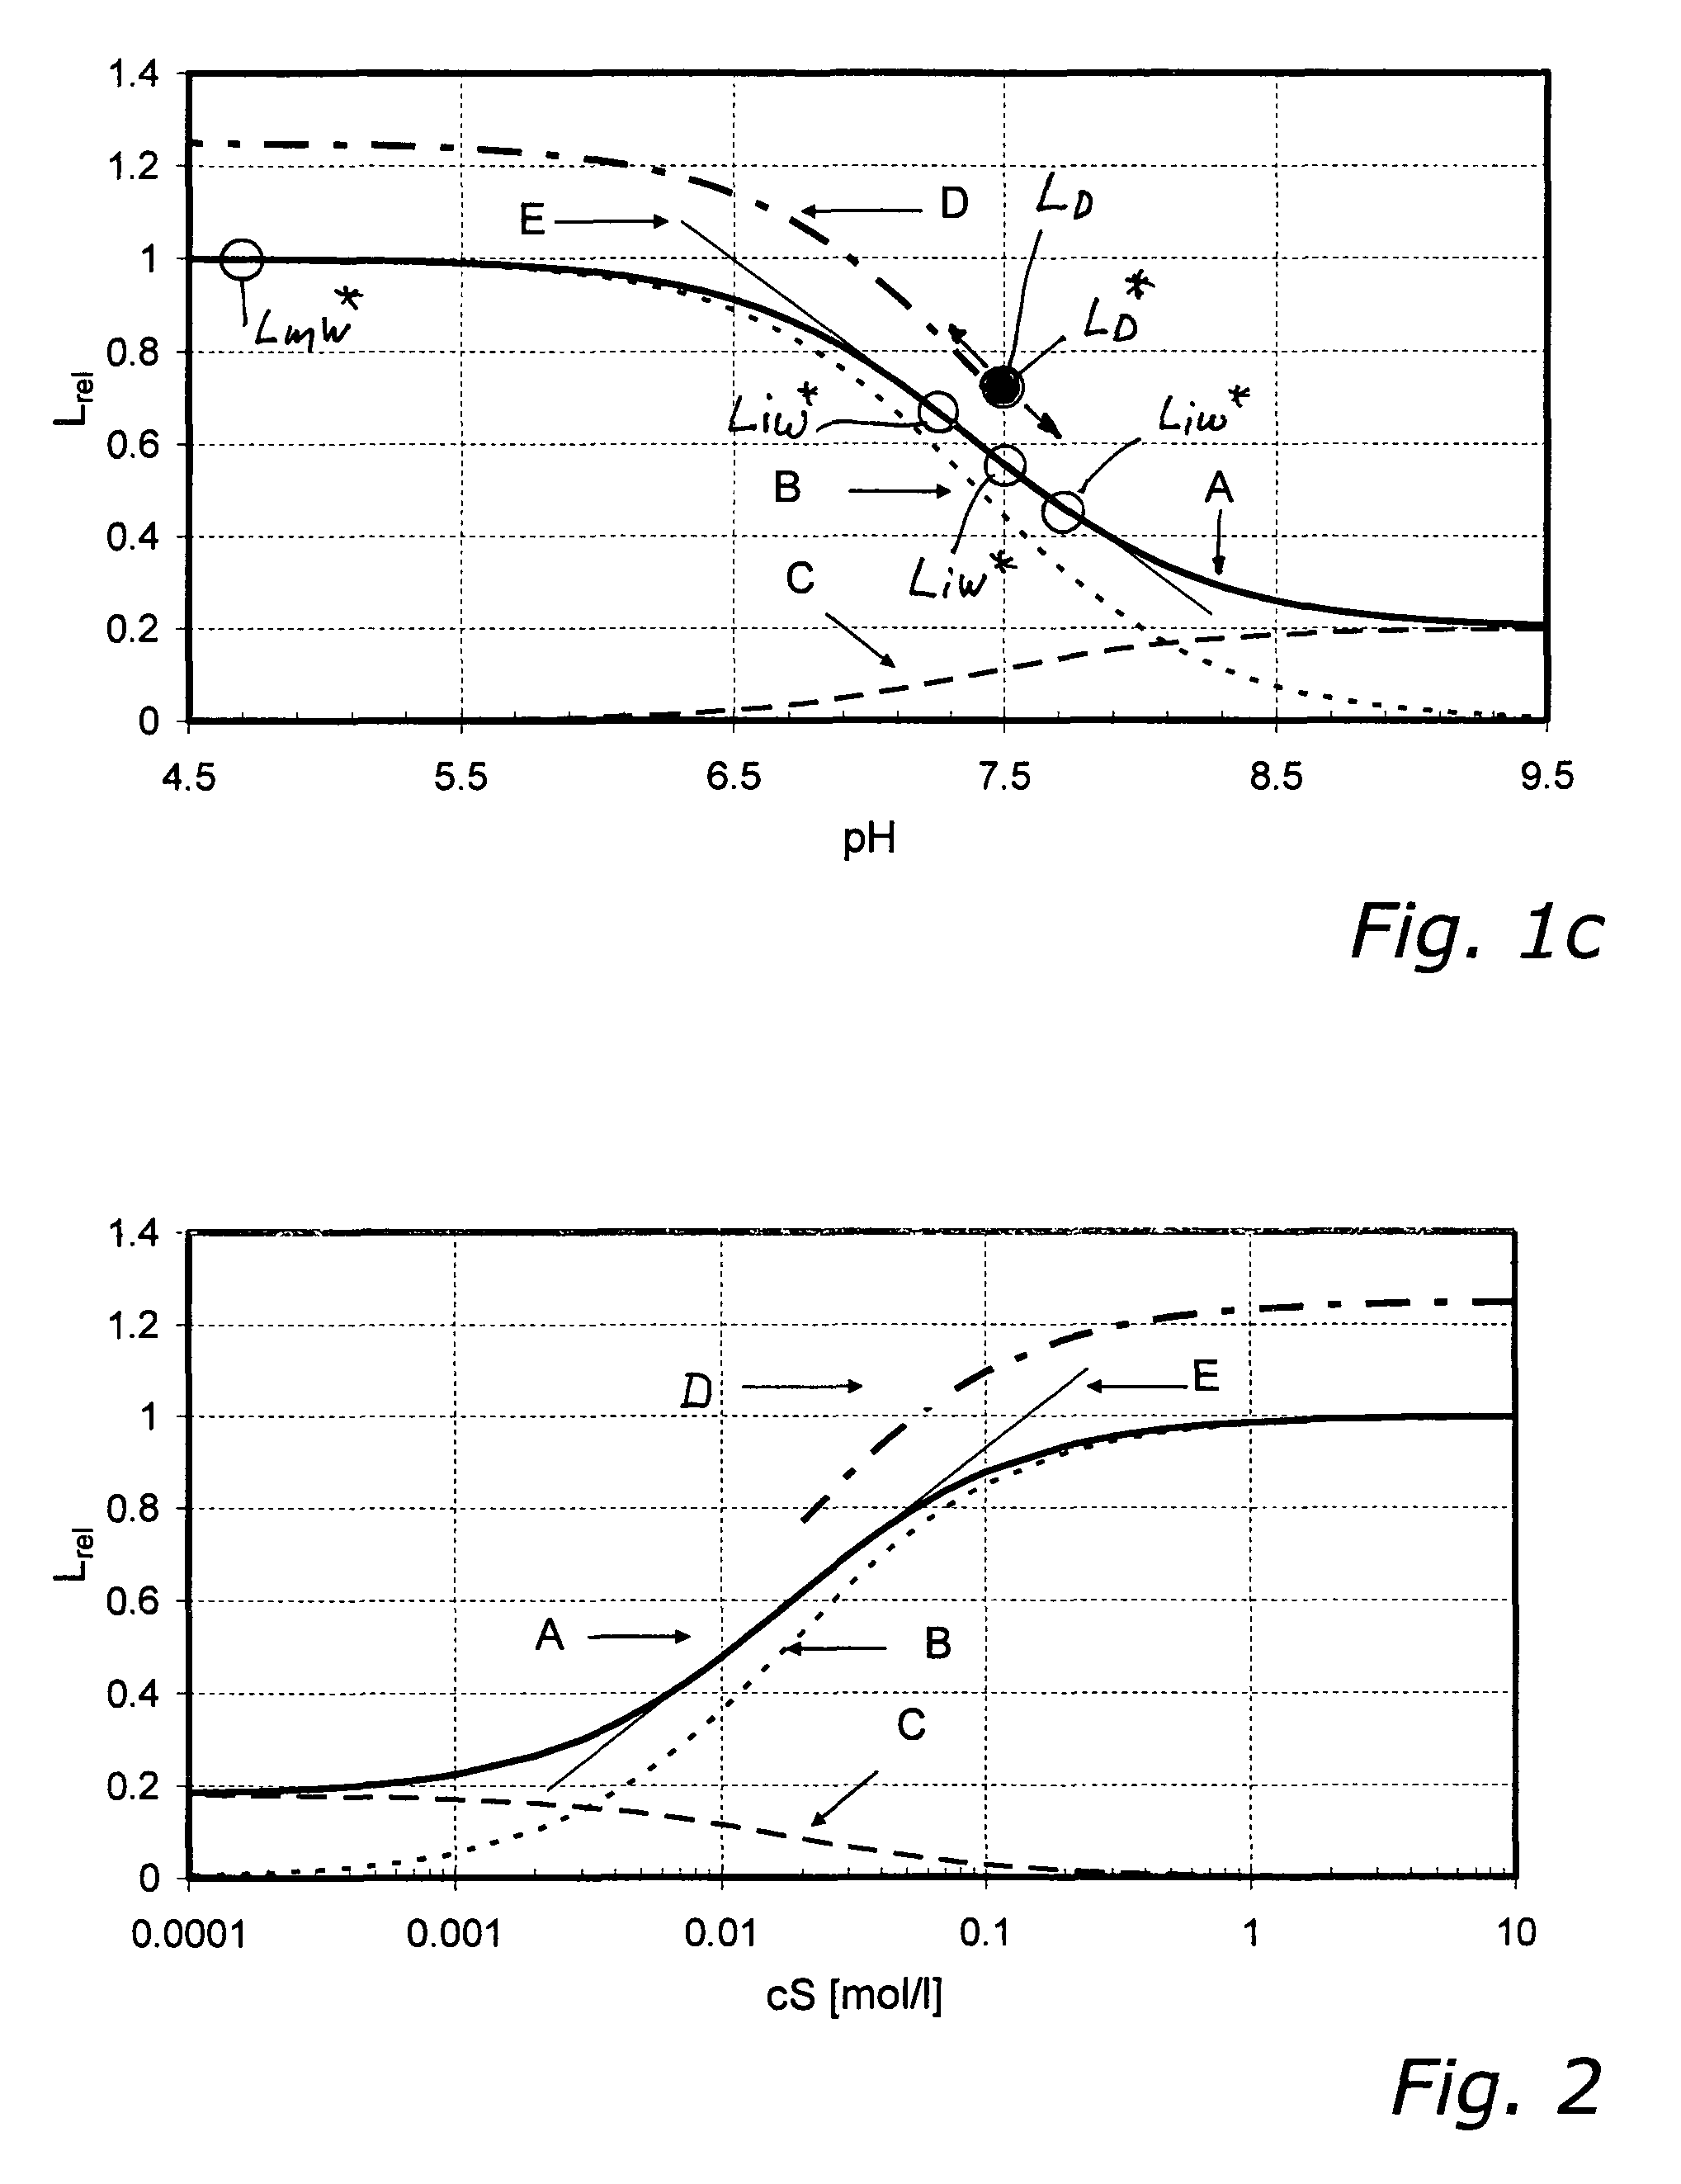
[0213]In FIGS. 1a to 1c, which illustrate the sub-variants 1.1, 1.2 and 1.3 described in the following, the luminescence intensities scaled to LmW=1 of the individual species of a pH sensor (i.e., with H+ being the non-volatile analyte) are shown as functions of pH-value. Curve A represents the relative characteristic and is the sum of the luminescence intensities LAW and LBW of the individual species A and B. It was obtained from equation 10, with the value 7.4 used for parameter pK and the value 0.2 used for the parameter q, and equation 10 divided by LmW. The ratio between lowest intensity (right side) and highest intensity (left side) is the value of the parameter q. Curve B is the relative luminescence intensity of species B as a function of pH-value. Curve C is the relative luminescence intensity of species A as a function of pH-value. From curves B and C it can be seen that for pH9.5 es...

example 2

(With Subvariants 2.1 and 2.2 Not Using Equations 1 to 10)

[0272]It is an advantage of theoretically derived functional equations for the sensor characteristic that they usually describe the shape of the characteristic curve over the whole range of measurable analyte concentrations with sufficient accuracy. But for the purpose of dry calibration according to the invention it is not absolutely necessary to use the above, theoretically derived equations.

[0273]In principle alternative functional relationships may be used. The shape of the characteristic curve—at least over the expected range of the analyte concentration—can be represented sufficiently accurately, for instance by polynomials of first or second degree, by logarithmic functions, by rational functions or by combinations of these functions (e.g. LW=a+b·cS, LW=a+b·log(cS), LW=a+b·cS+c·(cS)2, or LW=a+b·pH, LW=a+b·log(pH), LW=a+b·pH+c·(pH)2). The functions cited as examples differ from the theoretically derived functions (e.g. ...

example 2.1

[0287]In a preferred variant of the method according to the invention a representative number of dry sensors S0 is selected from a plurality of sensors Sn made in the same way and the luminescence intensity LD* is measured without the use of an aqueous calibrating medium. Subsequently each of the sensors S0 is brought into contact with a number n of aqueous calibrating media with known concentrations cSi of the analyte, which are distributed at least over the expected range of the concentration to be measured, and n luminescence intensities (LiW*; i=1 . . . n) are measured, yielding n data pairs (cSiW*, LiW*; i=1 . . . n).

[0288]A suitable function of general form LW*=f(P1*, . . . , Pn*, cS or pH) (e.g. LW*=P1*+P2*·cS or LW*=P1*+P2*·pH) describing the shape of the sensor characteristic is fitted to the n data pairs, resulting—at least for part of the range of the analyte concentrations to be measured—in values for the parameters P1*, . . . , Pn* of an effective sensor characteristic ...


PUM

PropertyMeasurementUnit
activity coefficientaaaaaaaaaa
pHaaaaaaaaaa
thicknessaaaaaaaaaa

Abstract

The invention relates to a method for the determination of the concentration of a non-volatile analyte in an aqueous sample medium, with the use of an optical sensor which contains a luminescent dye and is calibrated at the user site by means of a single-point-calibration. To enable the user to completely dispense with all calibration media a luminescence measurement value is obtained at the user site with the sensor in contact with the aqueous or bloodlike sample medium, which value is referenced to the relative characteristic obtained at the factory site and to a measured dry calibration value obtained at the user site, the concentration of the non-volatile analyte being deduced from these data.

Description

FIELD OF THE INVENTION[0001]The invention relates to a method for the determination of the concentration of a non-volatile analyte present in an aqueous sample medium with the use of an optical sensor which contains a luminescent indicator dye whose luminescence depends on the concentration of the analyte and which is calibrated at the user site by means of a single-point-calibration.BACKGROUND OF THE INVENTION[0002]Analyzers for the determination of non-volatile substances in a liquid (e.g. ionic substances such as H+ (pH), Na+, K+, Ca++, Cl−, neutral or charged molecules such as glucose, urea or lactate) are used in medical, environmental, and industrial technology. Clinical diagnosis, in particular, relies heavily on analyzing equipment for the determination of so-called “critical care analytes” in biological fluids such as urine, plasma, serum and above all whole blood. Such systems frequently comprise diverse sensing elements for determining the respective parameters. Such sens...

Claims


Application Information

Patent Timeline
Patent Type & Authority Patents(United States)
IPC IPC(8): G01N21/76
CPCG01N21/274G01N21/6428C09B57/08G01N21/80G01N21/8483G01N31/22Y10T436/102499Y10S435/97Y10S435/805Y10T436/115831G01N2021/6432
Inventor LEINER, MARCO JEAN-PIERRETUSA, JAMES KENNETH
Owner ROCHE DIAGNOSTICS OPERATIONS INC
Why Eureka
Try Eureka