Method and user interface for the graphical presentation of medical data

a technology of medical data and user interface, applied in the field of graphical presentation of medical examination results, can solve the problems of losing the overview of the presented data sets, user's inability to discern the focus, etc., and achieve the effect of reducing the information content of unfocused objects and limited available spa

Inactive Publication Date: 2013-11-26
SIEMENS HEALTHCARE GMBH
View PDF19 Cites 9 Cited by
  • Summary
  • Abstract
  • Description
  • Claims
  • Application Information

AI Technical Summary

Benefits of technology

[0021]An advantage of the invention is that the data symbols are presented in multiple dimensions and can be searched through. This reduces on the one hand the cognitive effort for the user and on the other hand the time costs in the evaluation and finding since all available data objects can be presented simultaneously in an overview, and the selected data object can be shown enlarged, which is why no switching between various views needs to occur.
[0022]In other words, a simultaneous presentation of focused and unfocused context information is possible without introducing additional levels or implementing explicit user interactions. The invention solves the problem of the limited available space on the screen via a reduced information content of unfocused objects. It is assumed that such a mode of operation accommodates visually oriented people. The presentation can be adapted without further measures to various questions; the screen space can thereby always be optimally utilized.
[0023]The above object also is achieved in accordance with the present invention by a computer-readable medium encoded with programming instructions that, when executed by a computer in which the medium is loaded, because the computer to implement the method according to the invention described above including all embodiments.

Problems solved by technology

The user thus can easily fail to discern the focus and lose the overview of the presented data sets.

Method used


Image

  • Method and user interface for the graphical presentation of medical data
  • Method and user interface for the graphical presentation of medical data
  • Method and user interface for the graphical presentation of medical data

Examples


Embodiment Construction

[0028]The presentation in the figures is not to scale; identical elements or elements have identical effects are provided with the same reference characters.

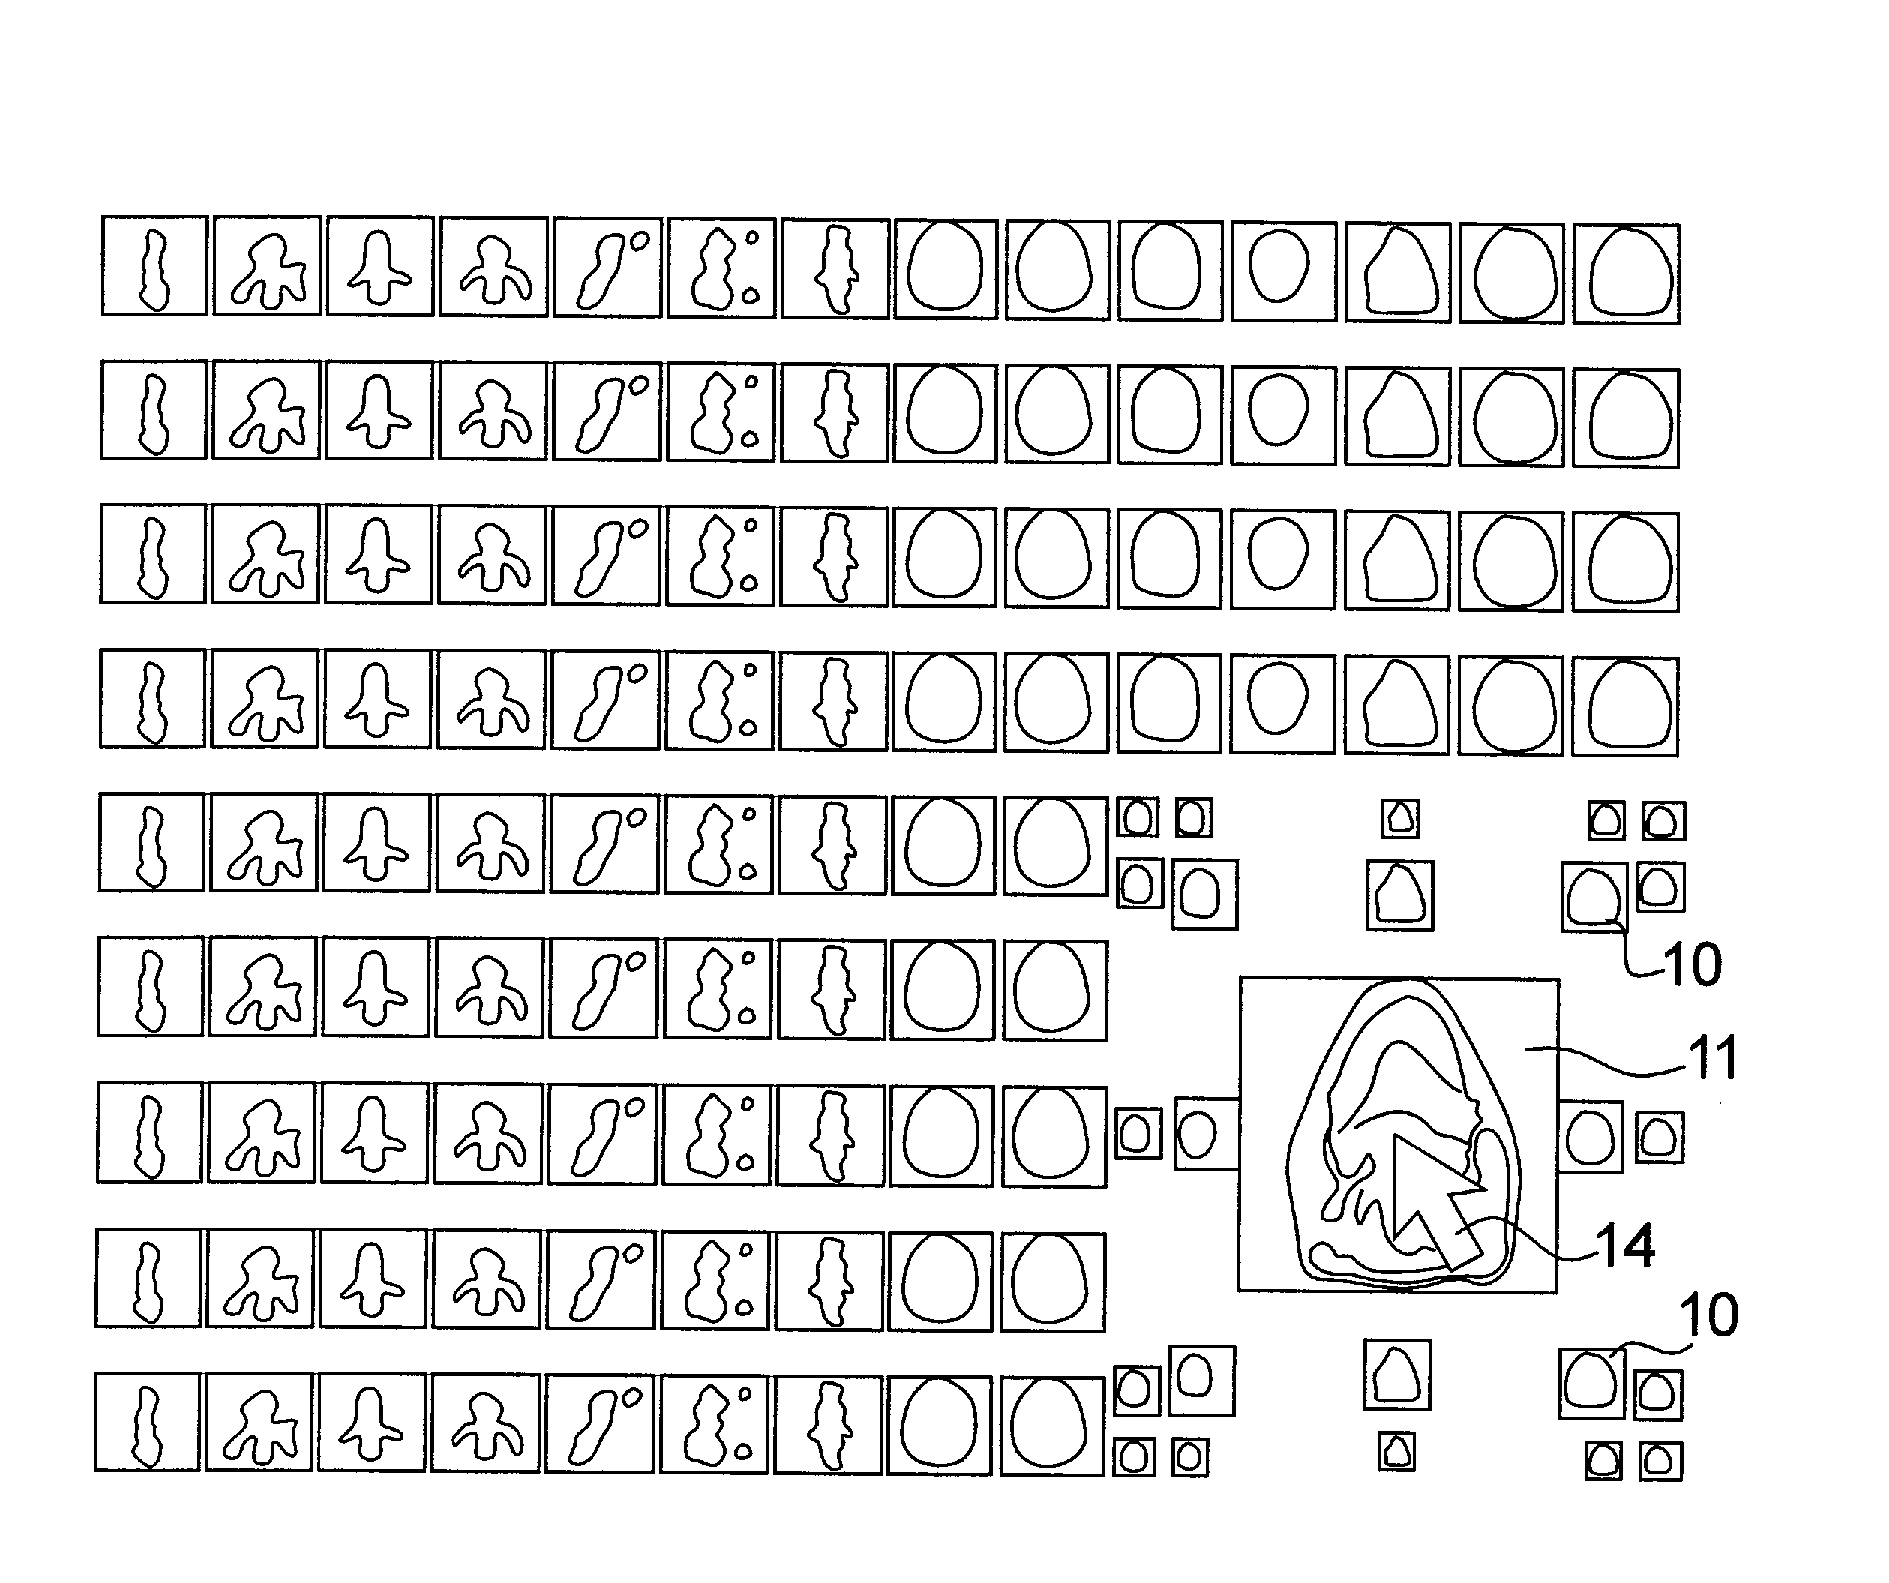
[0029]The user interface according to the invention utilizes the possibilities of a simultaneous presentation of focused data objects and context information without additional levels or explicit user interactions (such as zoom or pan).

[0030]The following terms are used in connection with the Figure description: in the selected presentation, each data object possesses an assumed importance. This assumed importance can be expressed in a value. Given a model of non-equivalent data objects, differences in the importance in this basic value can be shown.

[0031]A data object (that is focused on or selected) is designated as a focal point. Moreover, there is an interest value for each object. The interest value defines whether and in what size a data object is visible; the interest value is increased by the assumed importance of the ob...


PUM


Abstract

In a method and a device for the implementation of a medical examination via a user interface of at least one imaging device determination and input of a group of measurement parameters take place via an input device of the user interface. Spatially resolved image information are generated with the at least one imaging device depending on the group of measurement parameters. The image information is stored on a storage medium. The image information is presented as data symbols on a screen of the user interface. Multiple data symbols are presented in a predetermined arrangement on the screen for a medical assessment. An interest value is generated for each of the multiple data symbols with enlarged or reduced presentation of data symbols with higher interest value occurring relative to adjacent data symbols with lower interest value, such that the arrangement of the data symbols with lower interest value in n columns and m rows and at their respective size is maintained.

Description

BACKGROUND OF THE INVENTION[0001]1. Field of the Invention[0002]The present invention concerns the graphical presentation of medical examination results that were acquired with imaging methods, and in particular a method and a user interface for the implementation of a medical examination.[0003]2. Description of the Prior Art[0004]In the implementation of imaging methods in medical technology (for example magnetic resonance tomography, computed tomography, etc.), large sets (quantities) of data (respectively radiological data sets or data objects) are regularly acquired. Various methods (known as browsers) are known for the necessary consideration, processing and assessment of these acquired data. These browsers for radiological data sets allow the user (radiologist, MRTA) to view the representation of the data sets in detail views or context views.[0005]In known browsers, data objects are presented one-dimensionally in a list or two-dimensionally in a grid, wherein the data objects...

Claims


Application Information

Patent Timeline
Patent Type & Authority Patents(United States)
IPC IPC(8): G06F3/048G06F3/0482G16Z99/00
CPCG06F3/0482G06F19/321G06F19/3406G16H40/63G16H30/20G16H30/40G16Z99/00
Inventor GLASER-SEIDNITZER, KARLHEINZKLING, JOHANNES
Owner SIEMENS HEALTHCARE GMBH
Why Eureka
Try Eureka