
Transfer path analysis

a technology of transfer path and vibrational data, applied in the direction of engine components, non-denominational number representation computation, engine components, etc., can solve the problems of small effort, high measurement effort and time, etc., and achieve the effect of obtaining vibrational and/or acoustic data in a fast but yet accurate way

Active Publication Date: 2014-05-20
SIEMENS IND SOFTWARE NV
View PDF19 Cites 1 Cited by
  • Summary
  • Abstract
  • Description
  • Claims
  • Application Information

AI Technical Summary

Benefits of technology

[0021]It is an object of embodiments of the present invention to provide good apparatus or methods for obtaining vibrational and / or acoustical data. It is an advantage of embodiments according to the present invention that systems and methods are provided that allow obtaining vibrational and / or acoustical data in a fast but yet accurate way.
[0022]It is an advantage of embodiments according to the present invention that these allow balancing between speed of execution (e.g. measurement time, etc.) and accuracy (e.g. accuracy of path contribution results, accuracy of estimated loads, etc.). The more indicators that are measured and used in the analysis, the more robust the estimations can be and the better the accuracy will become, but the higher the measurement effort and time will be.
[0023]It is an advantage of embodiments according to the present invention that the measurement efforts for having appropriate input data can be small in comparison to the existing inverse load identification technique. Next to the operational in-situ measurements of path inputs and target response(s), methods and systems according to the present invention minimally require only one reciprocal SRF measurement per target point. Adding additional indicators for improving robustness may require additional SRF measurements, but this is still a small effort compared to the huge measurement efforts to build the full SRF matrix for inverse load identification.

Problems solved by technology

The more indicators that are measured and used in the analysis, the more robust the estimations can be and the better the accuracy will become, but the higher the measurement effort and time will be.
Adding additional indicators for improving robustness may require additional SRF measurements, but this is still a small effort compared to the huge measurement efforts to build the full SRF matrix for inverse load identification.

Method used


Image

  • Transfer path analysis
  • Transfer path analysis
  • Transfer path analysis

Examples


Embodiment Construction

[0063]The present invention will be described with respect to particular embodiments and with reference to certain drawings but the invention is not limited thereto but only by the claims. The drawings described are only schematic and are non-limiting. In the drawings, the size of some of the elements may be exaggerated and not drawn on scale for illustrative purposes. The dimensions and the relative dimensions do not correspond to actual reductions to practice of the invention.

[0064]Furthermore, the terms first, second, third and the like in the description and in the claims, are used for distinguishing between similar elements and not necessarily for describing a sequence, either temporally, spatially, in ranking or in any other manner. It is to be understood that the terms so used are interchangeable under appropriate circumstances and that the embodiments of the invention described herein are capable of operation in other sequences than described or illustrated herein.

[0065]It i...


PUM


Abstract

A method (200) for the characterization of vibrational and / or acoustic transfer path related data of a physical system (100) where vibration or acoustics may play a role. The method (200) has a step of receiving (210) input data for at least one input point of the physical system and / or response data for at least one response point of the physical system (100). The method (200) further has a step of receiving (220) at least one system response function between the at least one input point and the at least one response point indicative of the transfer of vibration and / or acoustic signals. The method (200) also has a step of applying (230) at least one parametric model characterising at least one load on the physical system as a function of the input data, where the parametric models are identified from the input data and / or response data and the physical system response functions.

Description

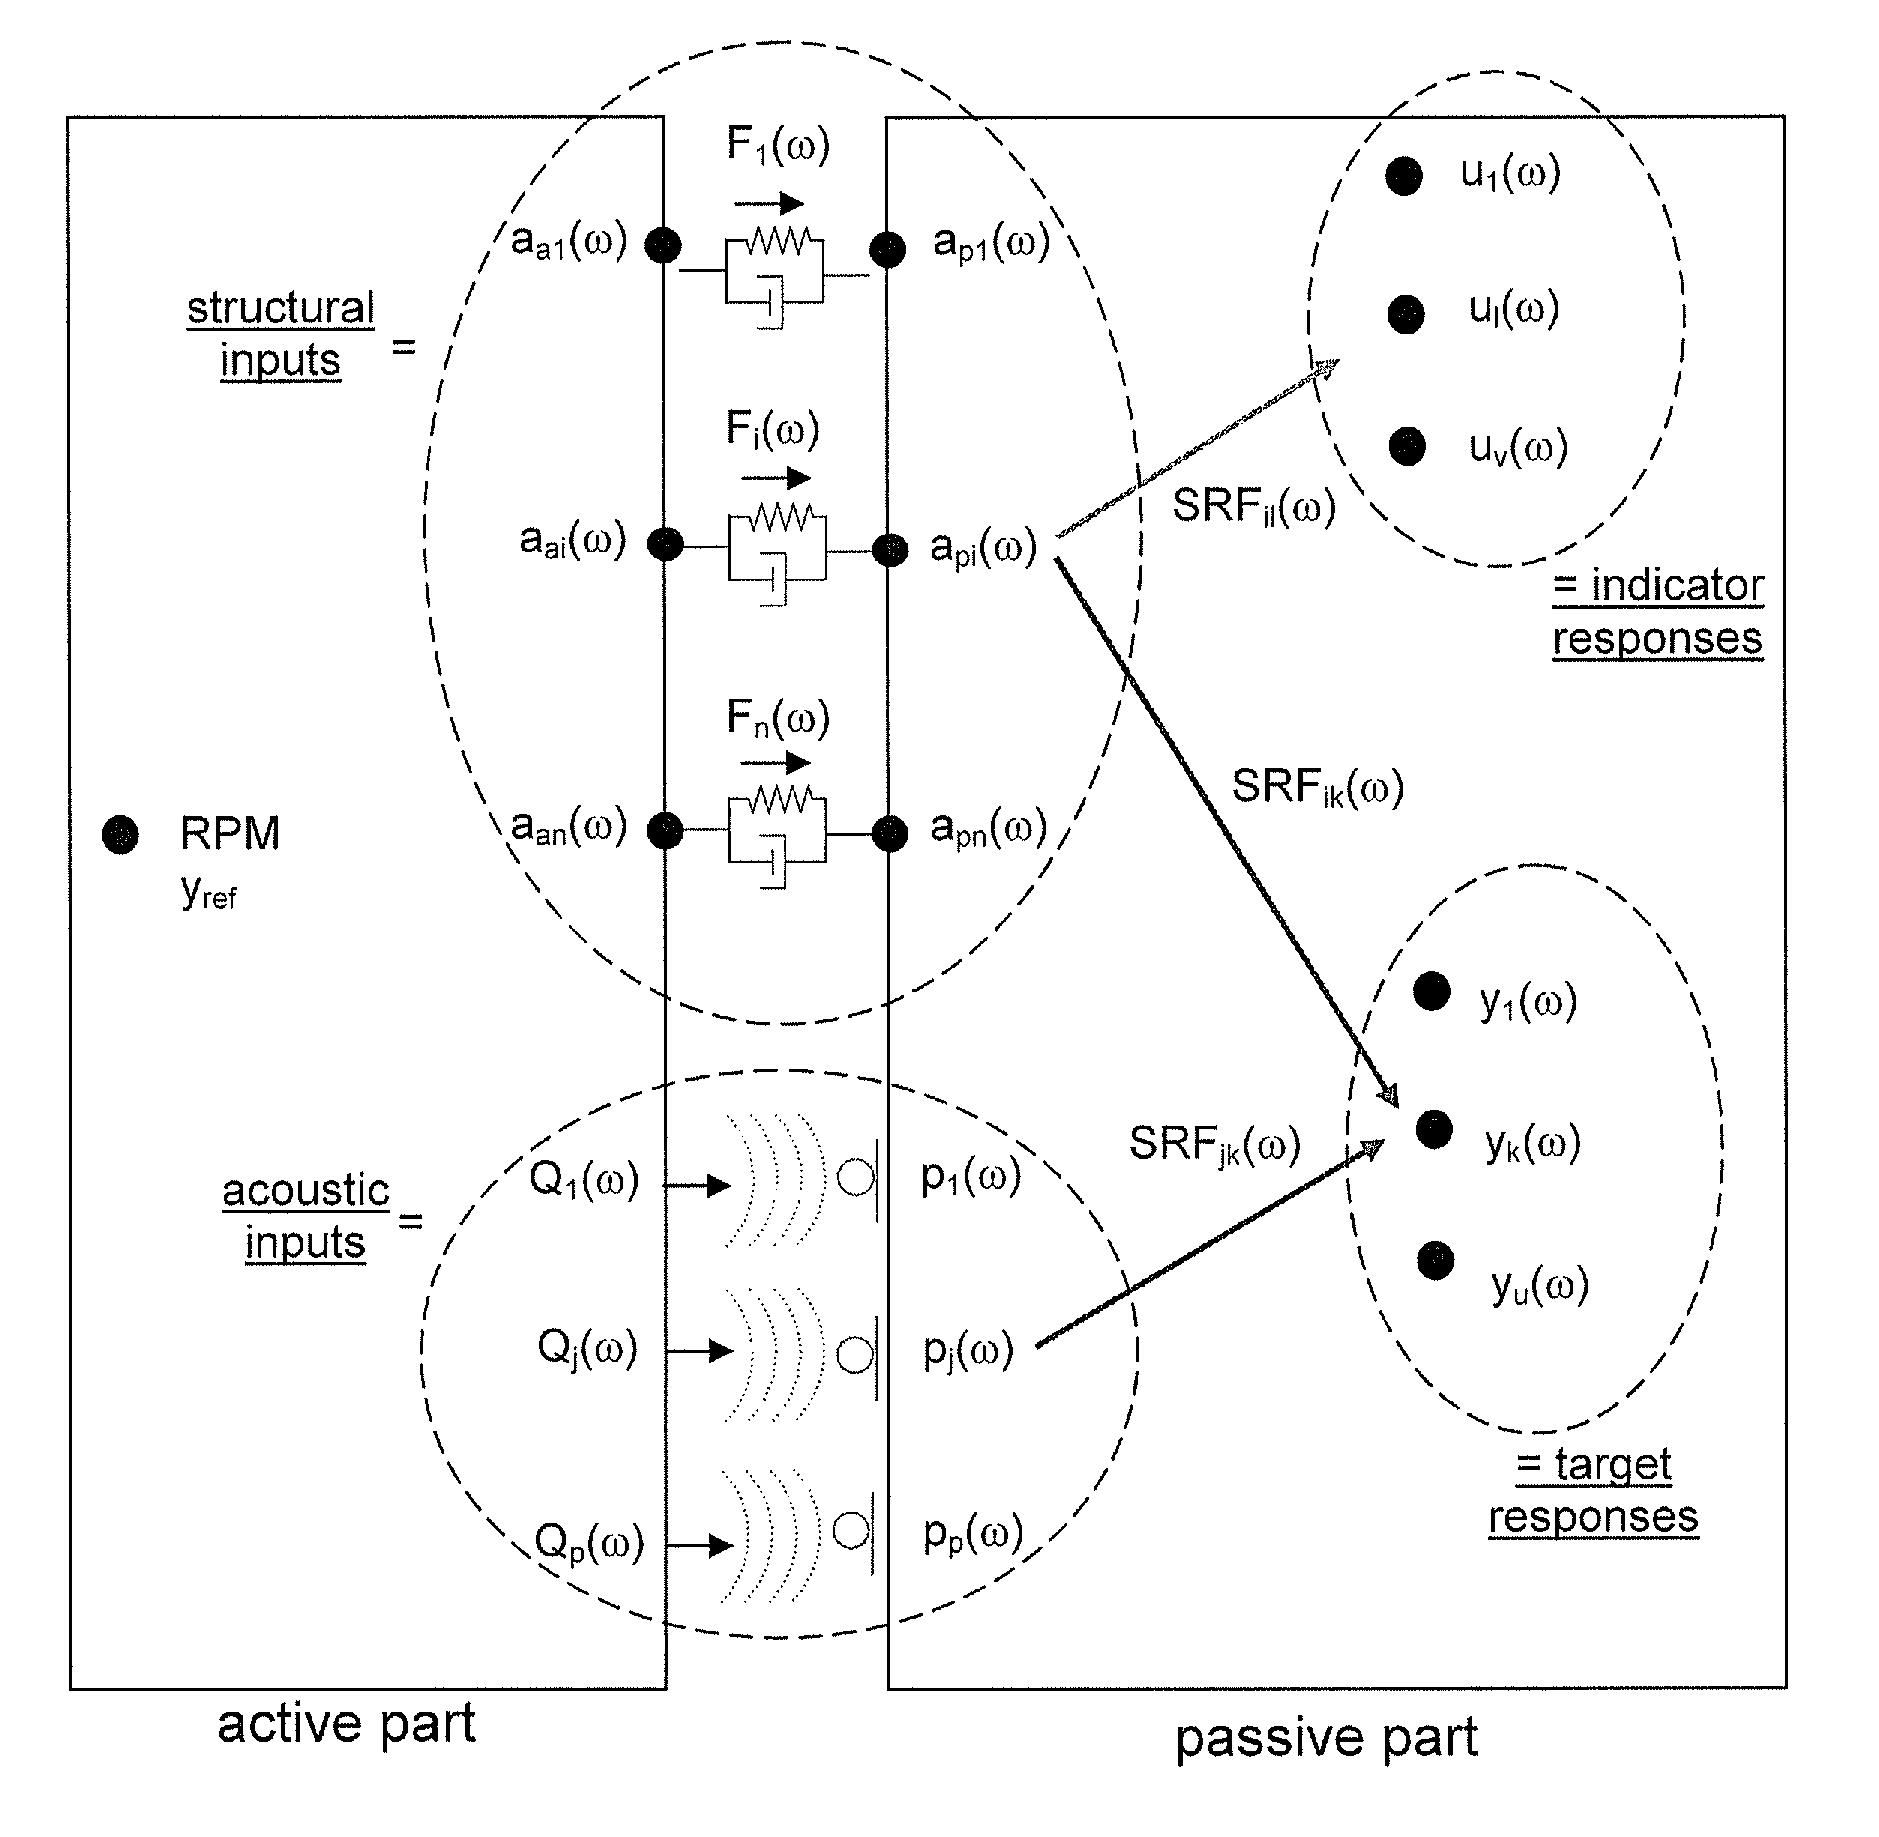
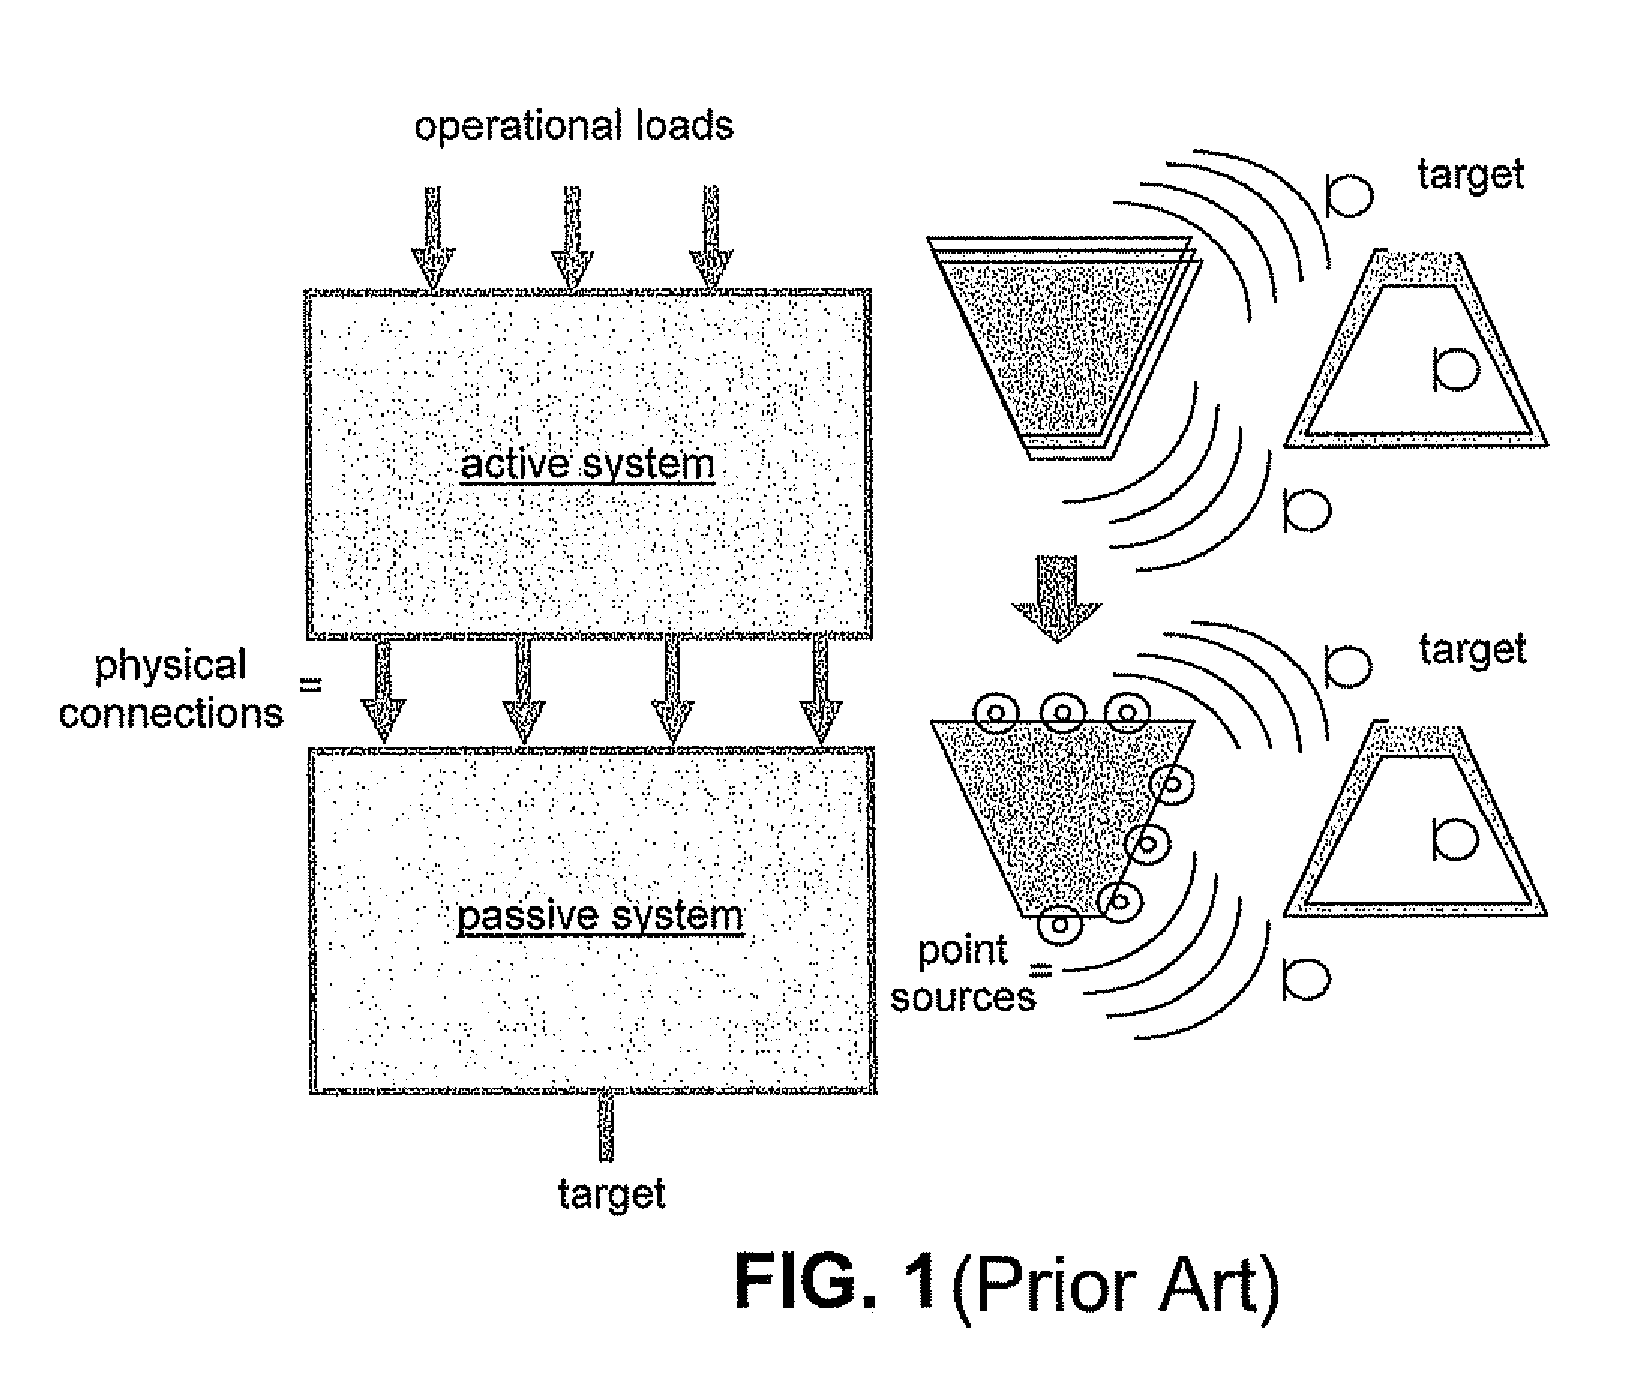
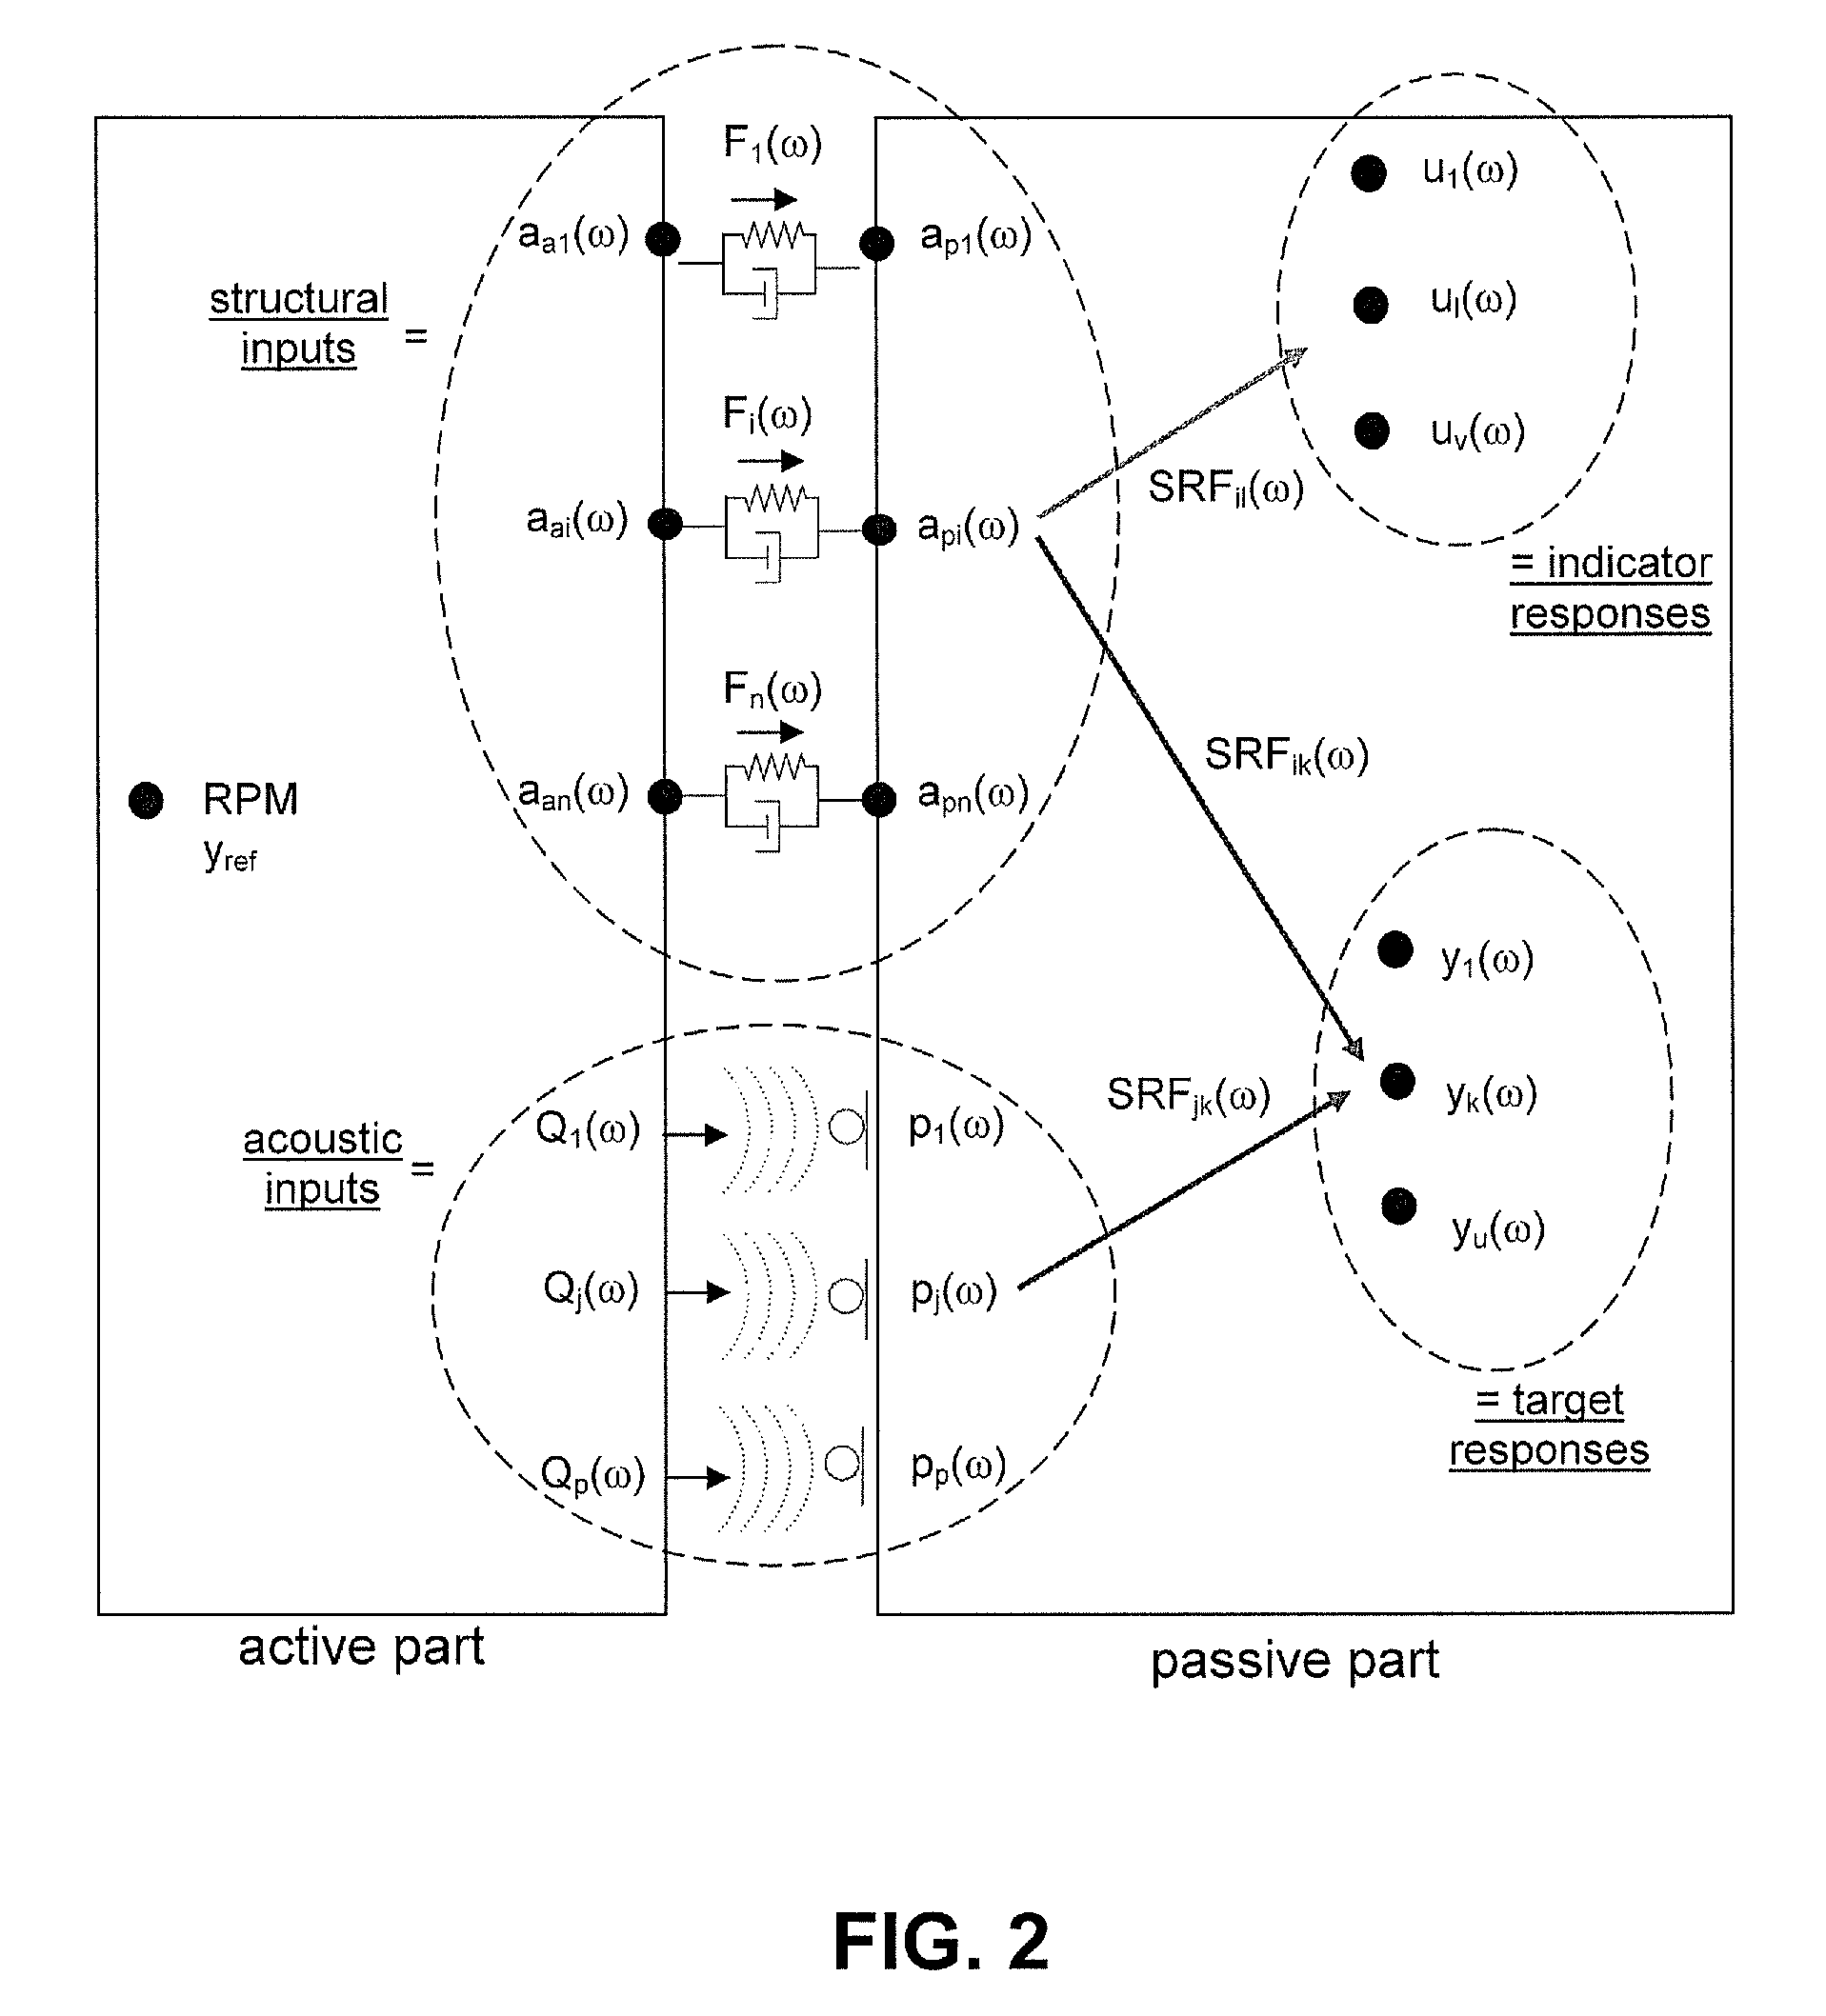
TECHNICAL FIELD OF THE INVENTION[0001]The present invention relates to the field of vibrational and / or acoustic study or analysis of physical systems. More particular, the present invention relates to methods and systems for identifying vibrational and / or acoustic data in an object.BACKGROUND OF THE INVENTION[0002]Transfer Path Analysis (TPA), also referred to as Noise Path Analysis (NPA), is an experimental technique for identifying the vibro-acoustic transfer paths in a system, from the active system component(s), generating the structural and acoustic loads, through the physical connections and along airborne pathways, to the target point(s) at the passive system component(s) responding to these loads. The acoustic and vibration responses at the target point(s) are expressed as a sum of path contributions, each associated with an individual path and load. For example, for a pressure response p(ω) expressed in the frequency domain, this can be formulated as follows:[0003]p⁡(ω)=∑i=...

Claims


Application Information

Patent Timeline
Patent Type & Authority Patents(United States)
IPC IPC(8): G01F17/00G06F17/50G06G7/70B60K17/24G06G7/48G06F19/00
CPCG01H17/00
Inventor JANSSENS, KARL HANS BERTMAS, PETER PAUL GERMAINGAJDATSY, PETER AKOSVAN DER AUWERAER, HERMANGIELEN, LUDO JEAN PIERRE
Owner SIEMENS IND SOFTWARE NV
Learn More