
Remaining life prediction for individual components from sparse data

a life prediction and sparse data technology, applied in the field of life cycle management, can solve the problems of difficult to predict damage evolution behavior, difficult and insufficient time-consuming calculation of uncertainties in sufficient time to support interactive decisions of owners

Active Publication Date: 2014-07-01
JENTEK SENSORS
View PDF68 Cites 7 Cited by
  • Summary
  • Abstract
  • Description
  • Claims
  • Application Information

AI Technical Summary

Benefits of technology

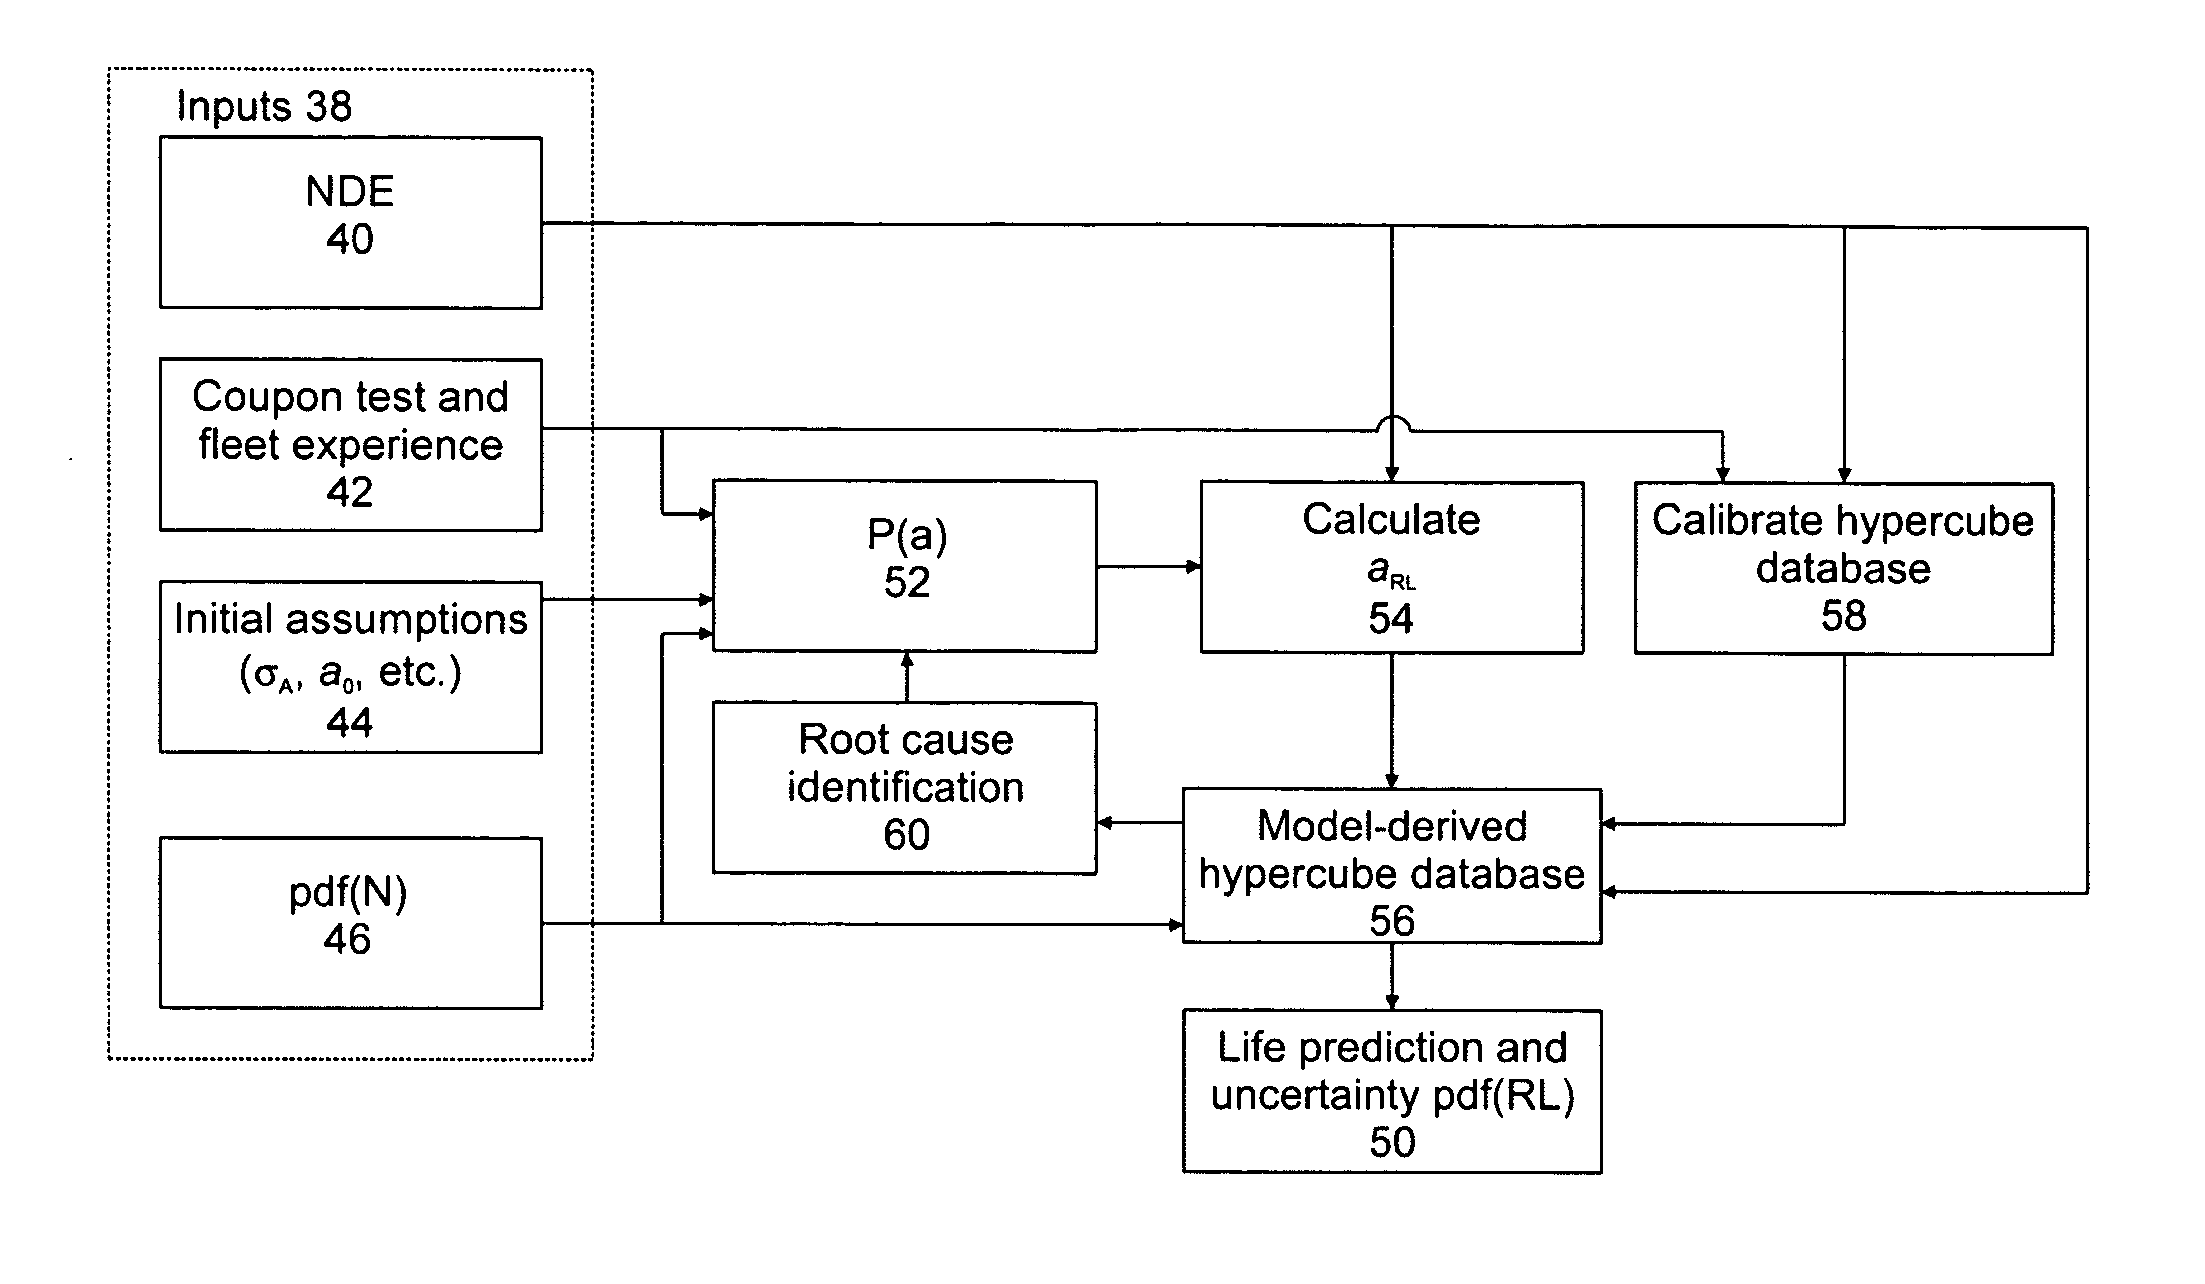
[0010]In another embodiment, the multivariate inverse method is used to obtain addition information about the system. This can include identification of root cause variables, such as residual stress, applied load amplitude, or shot peen levels, and estimating a value for this unknown input. It can also include determining an uncertainty for the system response value by using a distribution in values for an input variable. In embodiments, the input variable distribution can be assumed or measured. In specific embodiments, the system is a shot peened material or the system response is an image of effective material properties. Furthermore, tracking of the system response value for multiple input values allows refinement or upgrades for one or more of the model inputs or calibration.
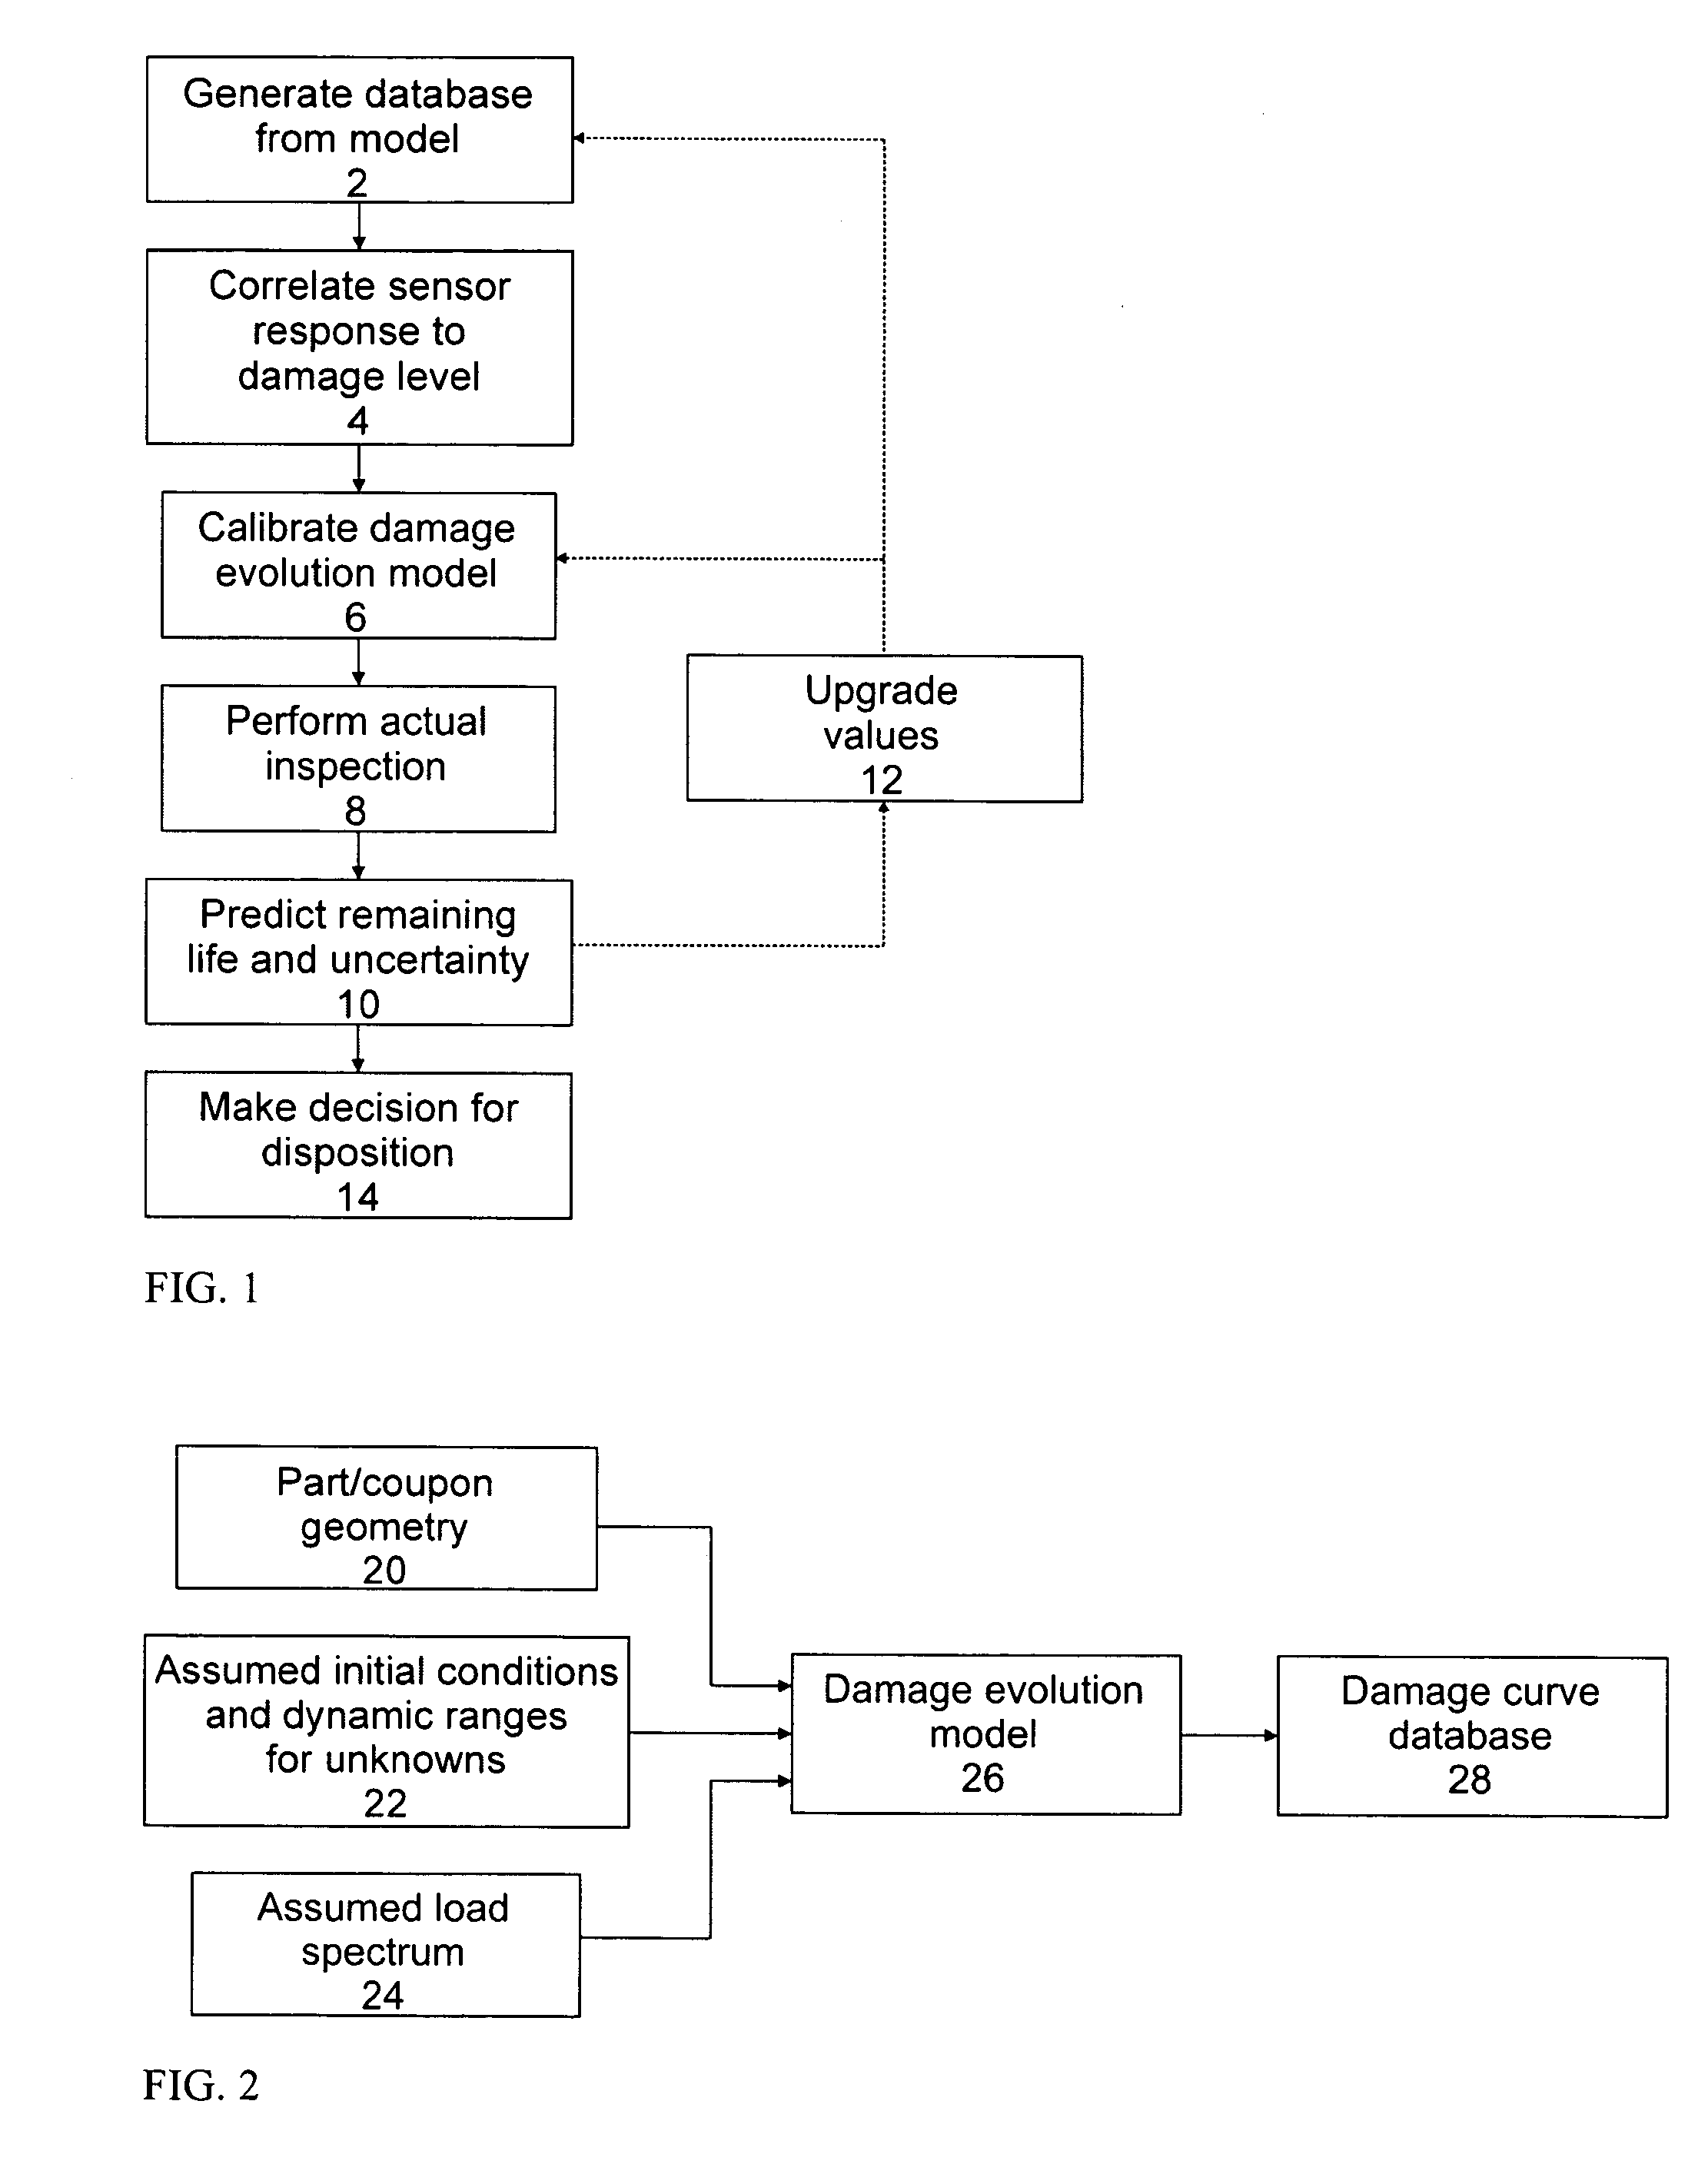
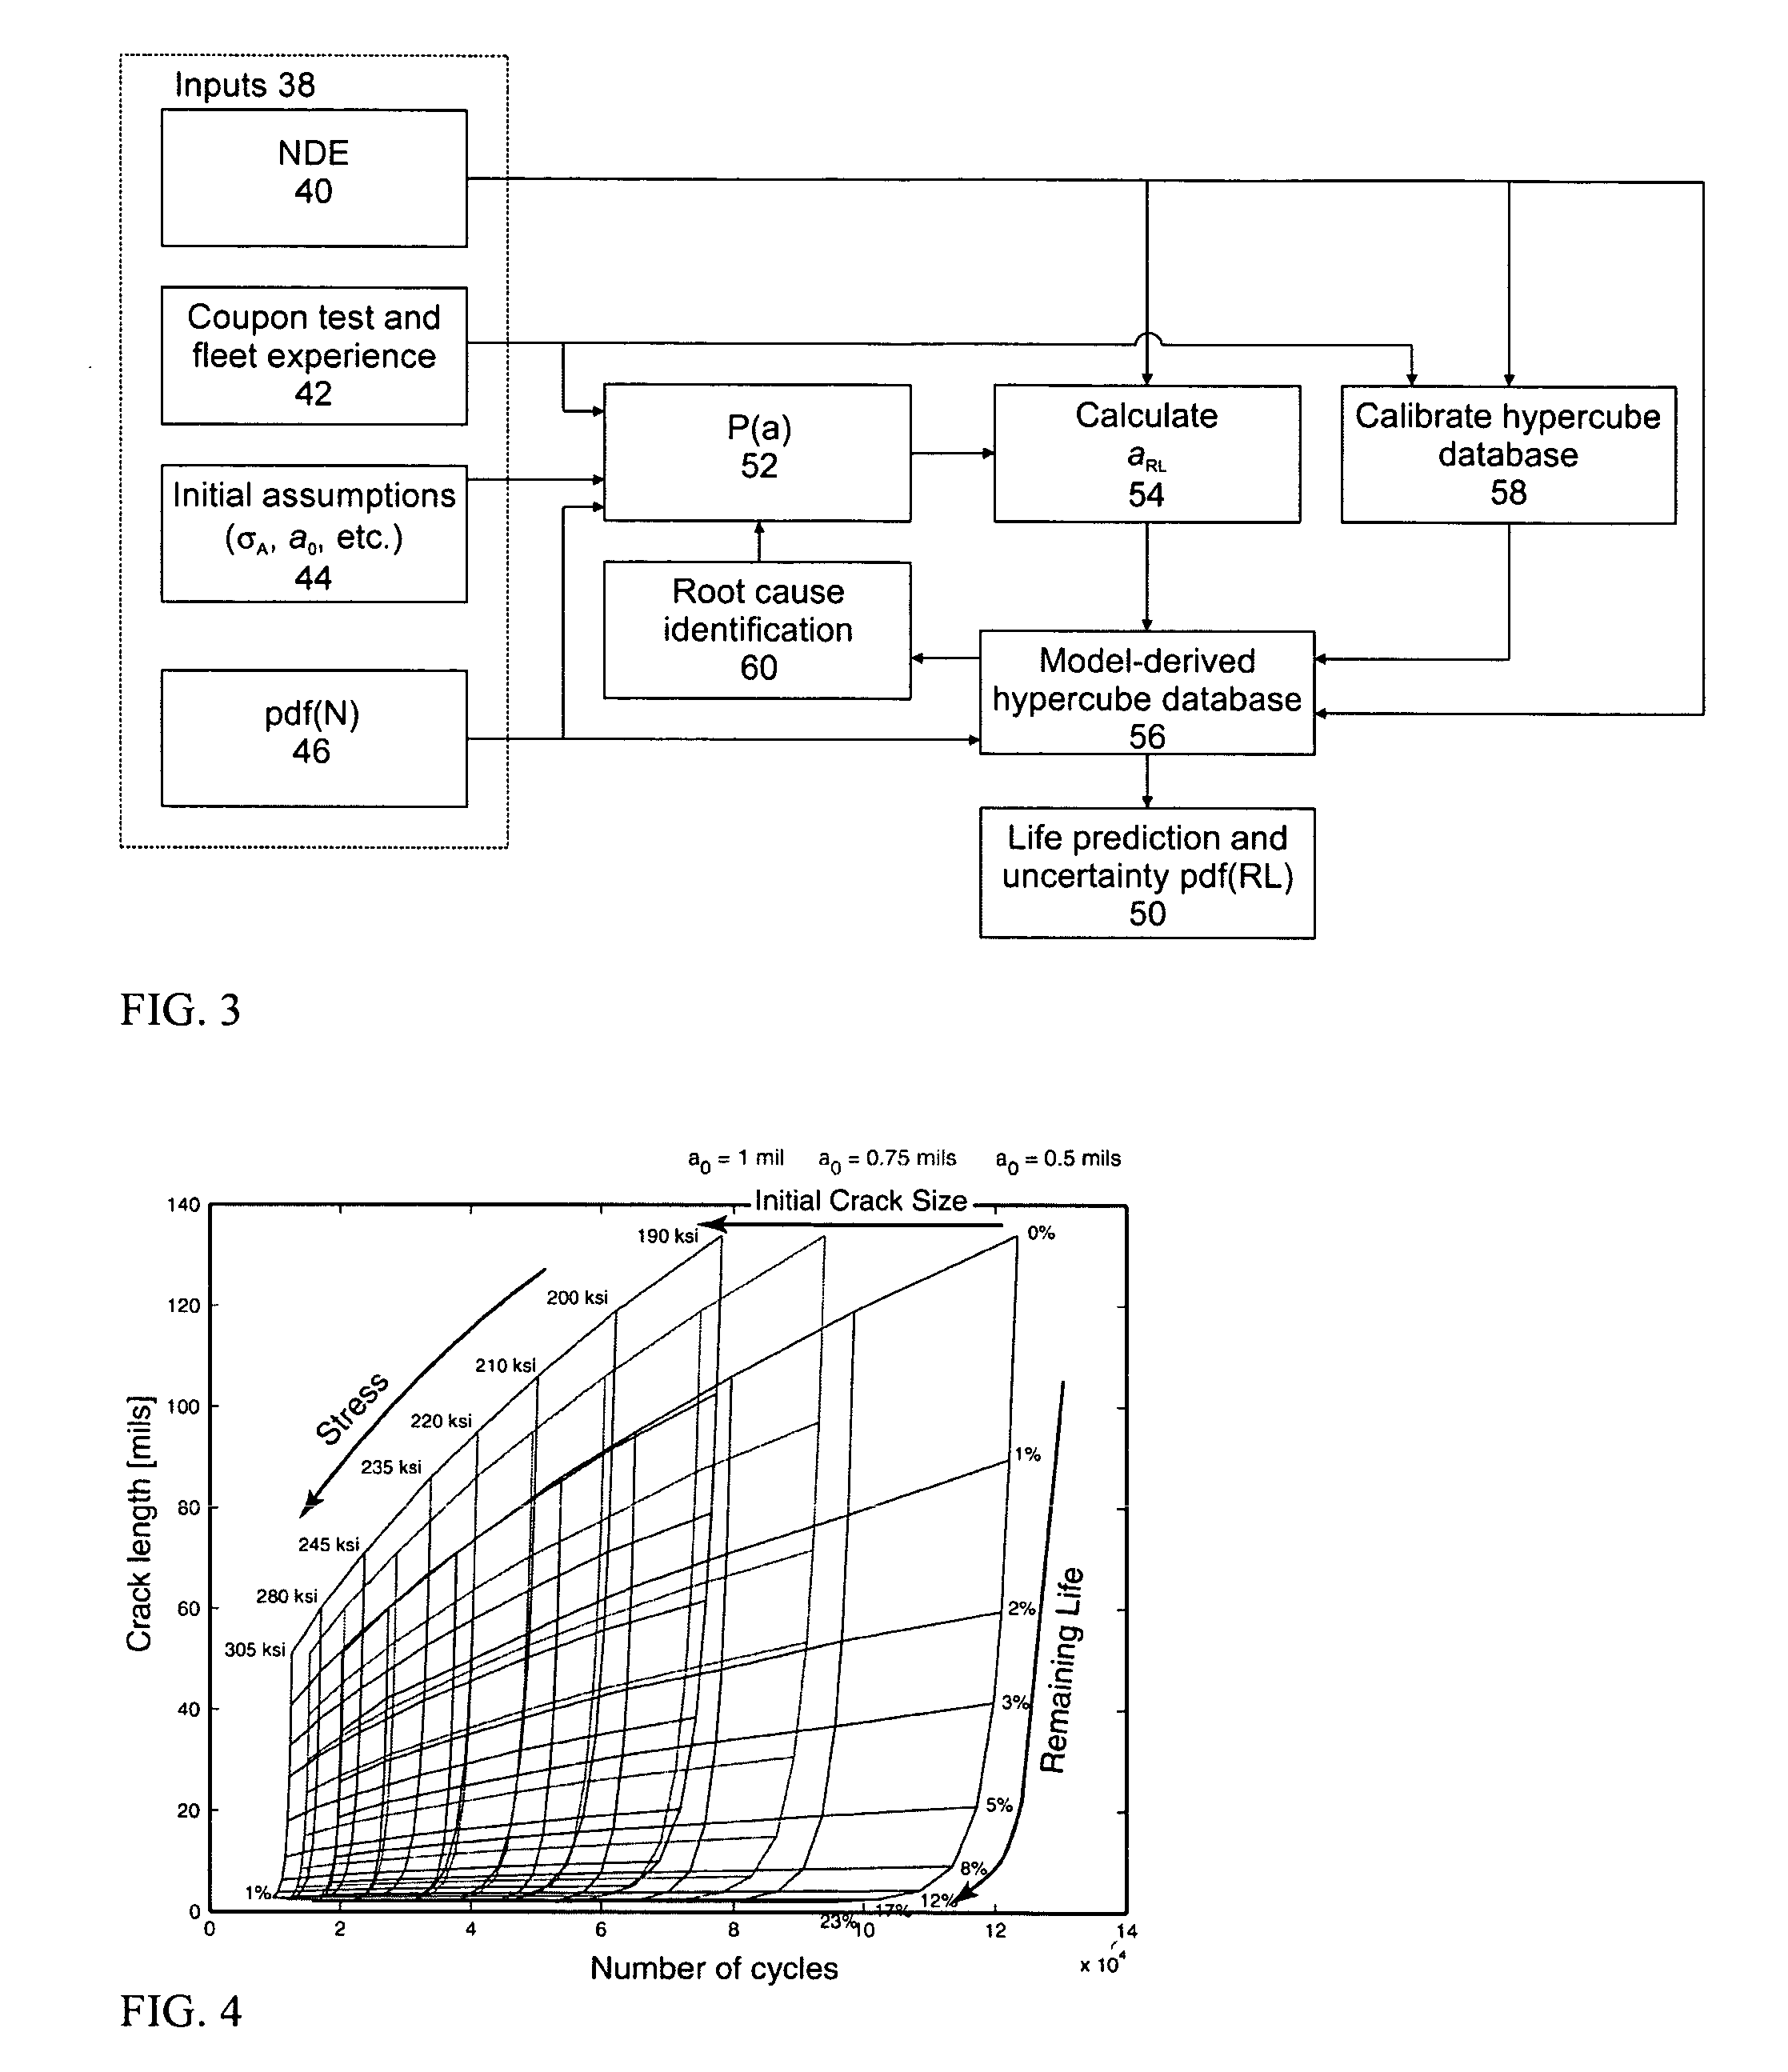
[0011]In yet another embodiment, a database of responses is used to estimate an output value distribution for a system. The database is in the form of a hypercube that relates at least two input variables to at least one output value. A distribution, or an uncertainty distribution, is also provided for at least one of the input variables. The distribution is compartmentalized or divided into multiple portions and a weighting value is determined for each portion based on the distribution. This information is then used in combination with the databases to calculate a mean output value and the output value distribution. Preferably, the database is generated from a model for the system behavior prior to the use of the database in determining the output value distribution. In embodiments, the input distribution is in terms of a quantitative distribution function or a probability density function. In an embodiment, this calculation is performed efficiently using a portion of the input variables and distribution value, preferably using a Latin hypercube methodology.

Problems solved by technology

When mission requirements change during service, uncertainties in model inputs are substantial, or damage behavior mechanisms are not well understood, for example for advanced materials such as composites, it is difficult to predict damage evolution behavior.
These traditional methods for life cycle management provide limited value.
Furthermore, even when such models capture a substantial portion of the relevant behavior, calculations of uncertainties in sufficient time to support interactive decisions by owners, maintainers and operators are often extremely time consuming.
While inspections of fatigue critical locations may be performed to try to assess the damage, such as the presence of cracks, these inspections are often difficult and costly.
Even with embeddable sensors the data recording may not be continuous during flight, since it is often more practical to connect to such sensors periodically to record damage / condition data than to fly instrumentation on-board for continuous monitoring.
Thus, damage state data from such sensors is often sparse to reduce the impact on aircraft availability and costs.
There are a number of difficulties with the damage tolerance approach.
One is the typically lengthy time required to run the models for predicting cracks growth.
This uncertainty can limit the usefulness of the predictive models.
Since this information is needed by the damage tolerance method, it again can limit the usefulness of the predictive models.

Method used


Image

  • Remaining life prediction for individual components from sparse data
  • Remaining life prediction for individual components from sparse data
  • Remaining life prediction for individual components from sparse data

Examples


Embodiment Construction

[0036]A description of preferred embodiments of the invention follows. The disclosed invention addresses the need for remaining life prediction, root cause identification and rapid uncertainty estimation tools for individual aircraft, fleets of aircraft, aircraft components and populations and subpopulations of aircraft components. In one embodiment, this tool incorporates early stage damage detection data, which is typically relatively sparse, precomputed databases of damage evolution modeled responses, and calibration of the model based on both the sparse in-service data and laboratory data, to provide rapid predictions for damage evolution and for identification of root causes for the observed damage evolution behaviors. While the following focus is on aircraft, the approach is suitable for other systems where the behavior is nonlinear and a model can be used to predict the future behavior for the system, but only limited or sparse data is available. Furthermore, this invention c...


PUM

PropertyMeasurementUnit
stress concentrationaaaaaaaaaa
toughnessaaaaaaaaaa

Abstract

Predicting the remaining life of individual aircraft, fleets of aircraft, aircraft components and subpopulations of these components. This is accomplished through the use of precomputed databases of response that are generated from a model for the nonlinear system behavior prior to the time that decisions need to be made concerning the disposition of the system. The database is calibrated with a few data points, to account for unmodeled system variables, and then used with an input variable to predict future system behavior. These methods also permit identification of the root causes for observed system behavior. The use of the response databases also permits rapid estimations of uncertainty estimates for the system behavior, such as remaining life estimates, particularly, when subsets of an input variable distribution are passed through the database and scaled appropriately to construct the output distribution. A specific example is the prediction of remaining life for an aircraft component where the model calculates damage evolution, input variables are a crack size and the number of cycles, and the predicted parameters are the actual stress on the component and the remaining life.

Description

RELATED APPLICATIONS[0001]This application claims the benefit of U.S. Provisional Application No. U.S. Provisional Application Nos. 60 / 758,665 filed on Jan. 12, 2006 and 60 / 856,081 filed on Nov. 2, 2006. The entire teachings of the above applications are incorporated herein by reference.BACKGROUND OF THE INVENTION[0002]The technical field of this invention is life cycle management. Current practice of life cycle management of critical components for high value assets such as aircraft and rotorcraft fall into three categories: damage tolerance, safe-life and fail-safe. Each of these methods requires reliable predictions of damage evolution behavior to enable practical application. When mission requirements change during service, uncertainties in model inputs are substantial, or damage behavior mechanisms are not well understood, for example for advanced materials such as composites, it is difficult to predict damage evolution behavior. These traditional methods for life cycle managem...

Claims


Application Information

Patent Timeline
Patent Type & Authority Patents(United States)
IPC IPC(8): G06F7/60G01B7/34G01N27/82G06E1/00G06E3/00G06F15/18G06F17/10G06F19/00G06G7/00G06N7/00G21C17/00
CPCG01N27/82F05B2270/109F05B2270/404G01B7/34G06N7/00G06N7/005G06N7/01
Inventor GOLDFINE, NEIL J.ZILBERSTEIN, VLADIMIR A.WEISS, VOLKERSHEIRETOV, YANKO K.
Owner JENTEK SENSORS
Learn More