Statistical analyzing method and statistical quality indicator for reliability improvement of a capacitive touch device
a capacitive touch and statistical analysis technology, applied in the field of capacitive touch sensing apparatus and methods, to achieve the effect of improving the sensing quality of the capacitive touch devi
- Summary
- Abstract
- Description
- Claims
- Application Information
AI Technical Summary
Benefits of technology
Problems solved by technology
Method used
Image
Examples
first embodiment
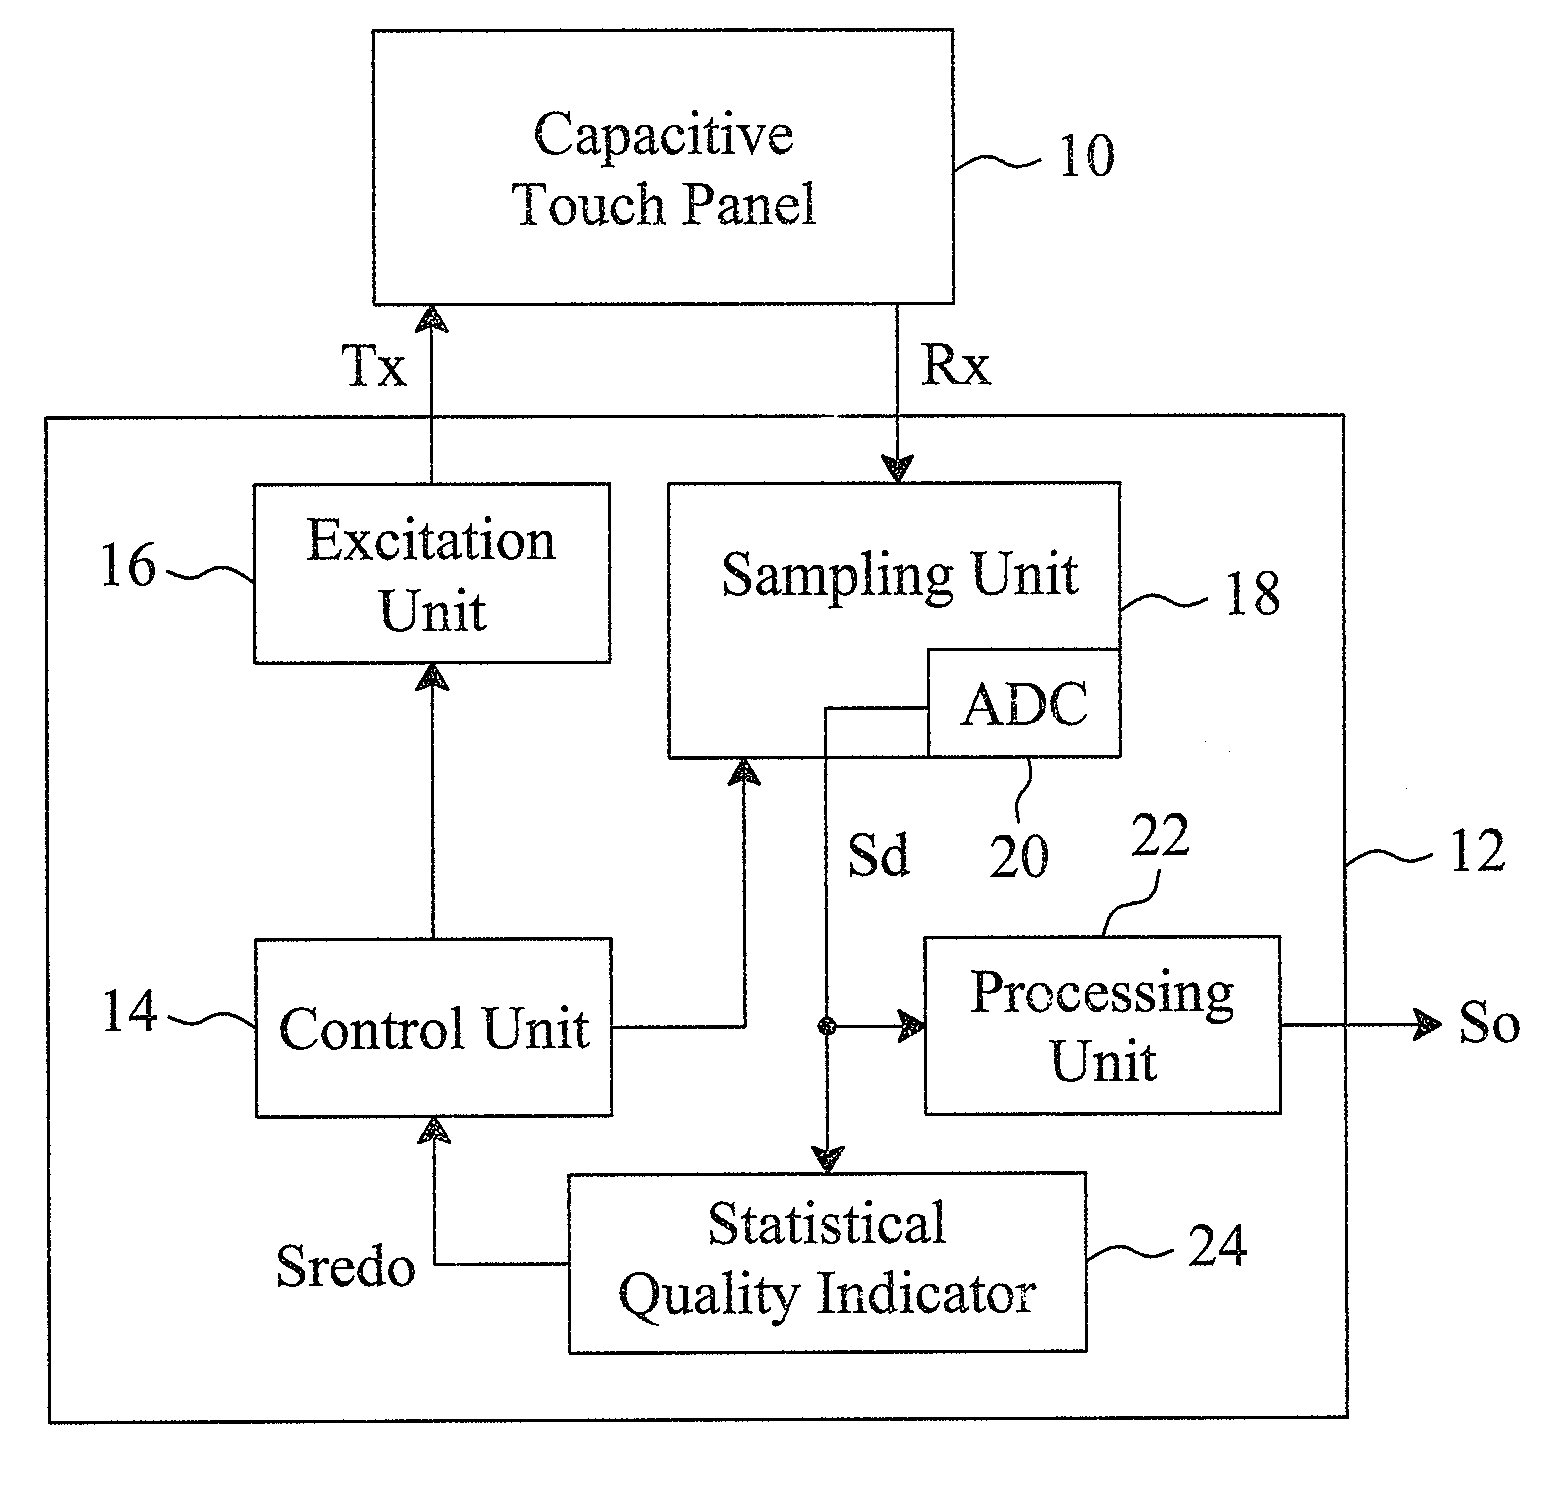
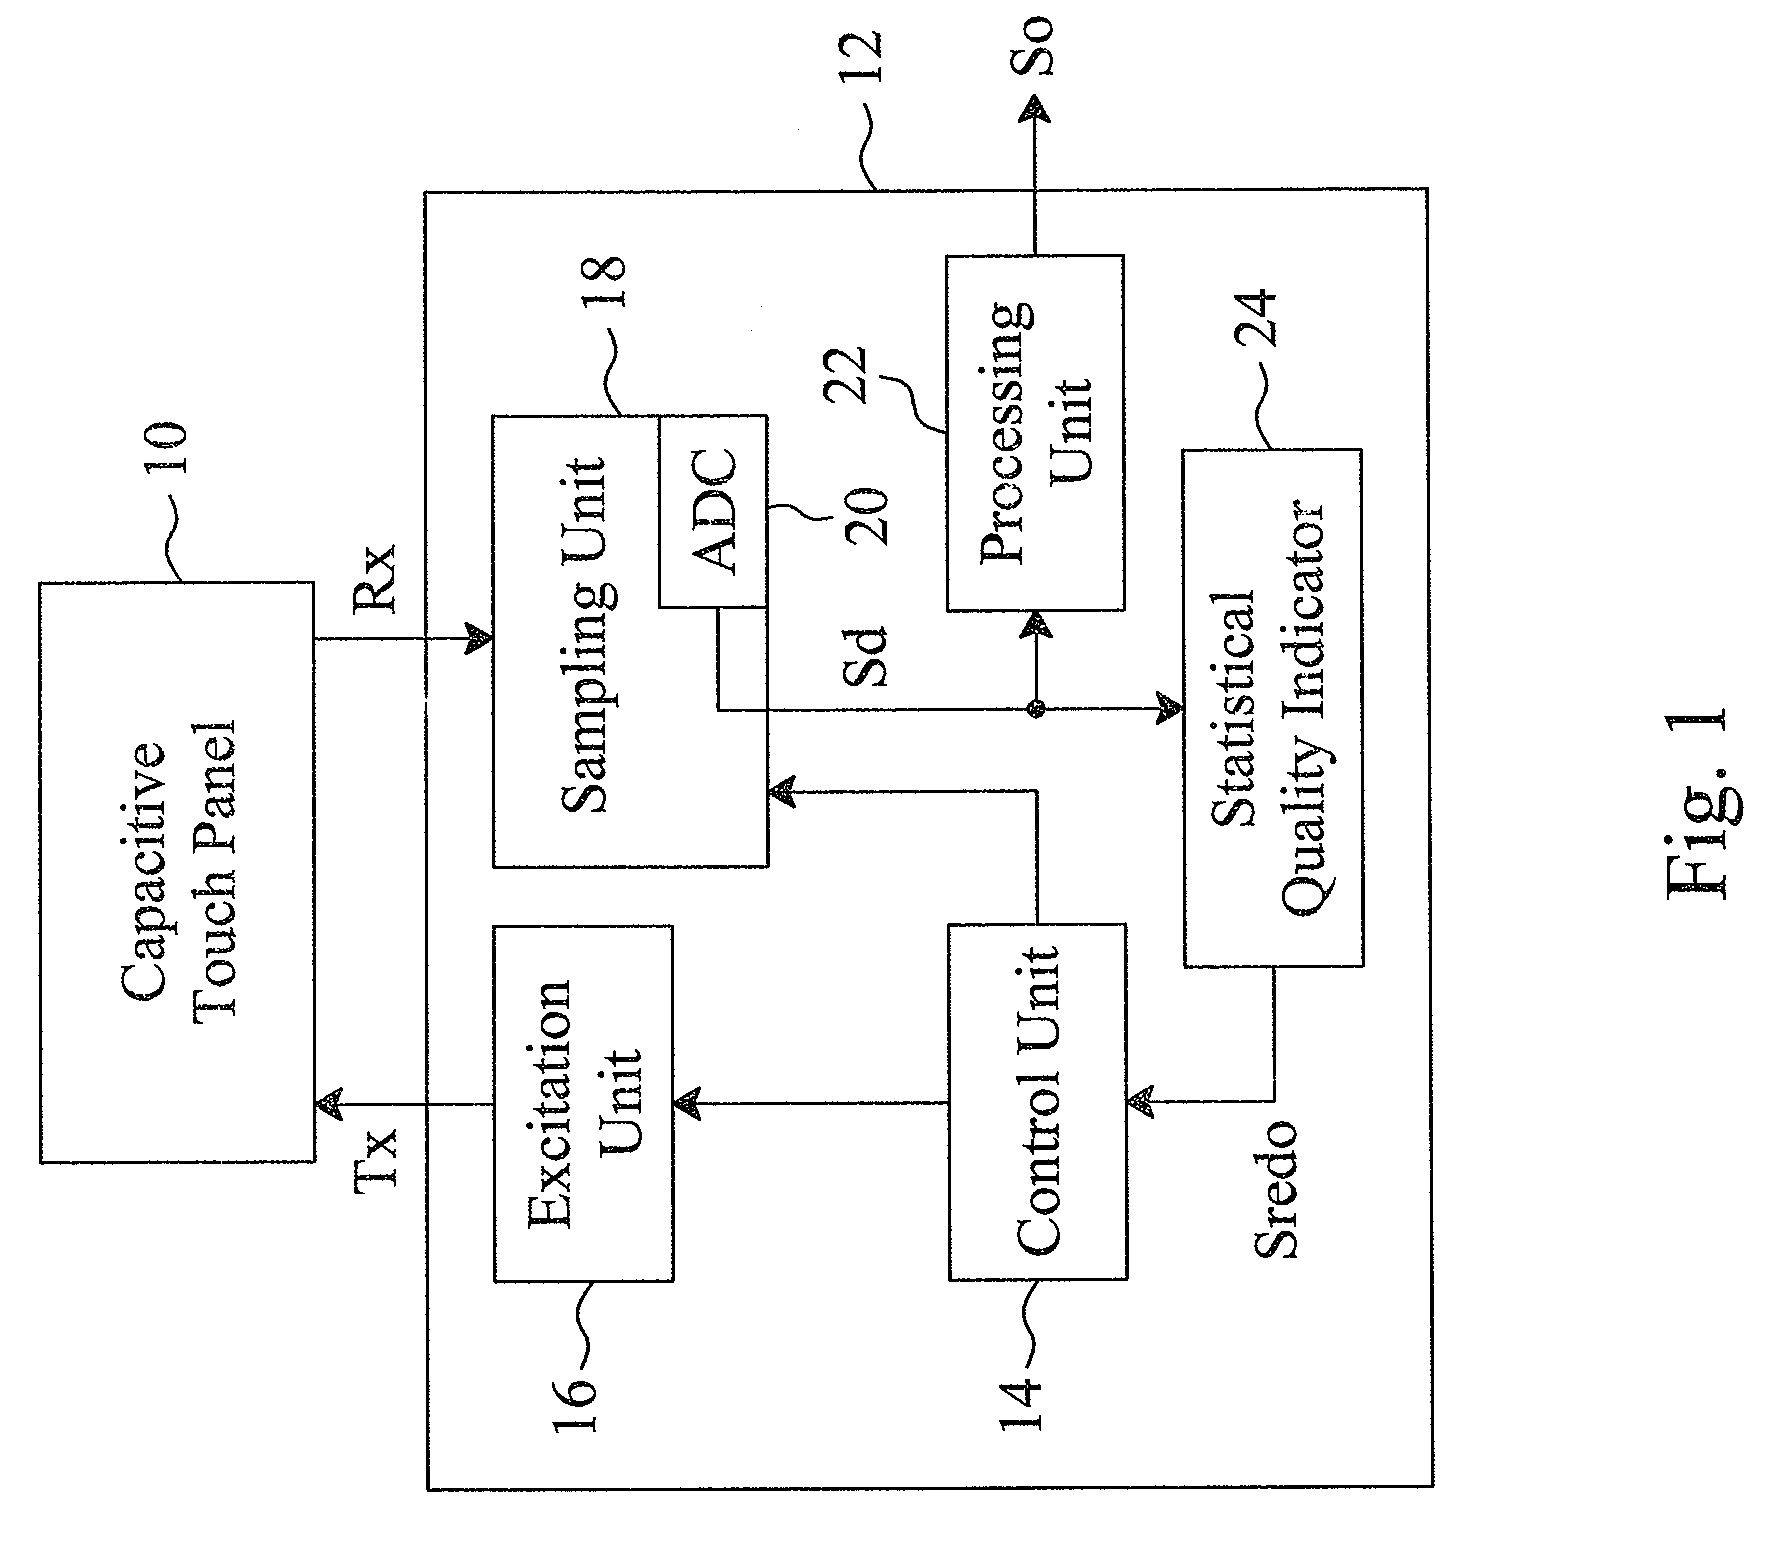
[0020]FIGS. 5 and 6 show a sensing method according to the present invention. The statistical quality indicator 24 shown in FIG. 1 has a defined reasonable range. For example, it has an upper boundary and a lower boundary set as 40 and 25, respectively. The control unit 14 controls the excitation unit 16 and the sampling unit 18 to continuously sense the capacitive touch sensor 26 to generate sensed values Sd. The sensing cycle Tsen is determined based on the sensing frequency. The statistical quality indicator 24 counts the number N of the sensed values Sd that are either larger than the upper boundary 40 (Sd>40) or smaller than the lower boundary 25 (Sd40 and the lower boundary 25. If the defined threshold is 3, then the statistical quality indicator 24 will identify the sensed values Sd in this statistic cycle Tsta as qualified, and the average
[0021]30.3(=31+32+29+30+28+326)
will be adopted. On the other hand, as shown in FIG. 6, the six sensed values Sd are 51, 45, 41, 35, 30 an...
second embodiment
[0022]FIGS. 7 and 8 show a sensing method according to the present invention, by which the statistical quality indicator 24 shown in FIG. 1 calculates the standard deviation σ(Sd) of the sensed values Sd in a statistic cycle Tsta, and compares the standard deviation σ(Sd) to a defined threshold to evaluate the sensing quality. For example, as shown in FIG. 7, the standard deviation σ(Sd) obtained from the six sensed values Sd (31, 32, 29, 30, 28, 32) is 1.49, and as shown in FIG. 8, the standard deviation σ(Sd) obtained from the six sensed values Sd (51, 45, 41, 35, 30, 23) is 9.3. If the defined threshold is 5, then the statistical quality indicator 24 will identify the sensed values Sd shown in FIG. 7 as qualified, and the average 30.3 is adopted; while the statistical quality indicator 24 will identify the sensed values Sd shown in FIG. 8 as not qualified, and trigger a redo signal Sredo to signal the control unit 14 to discard these unqualified sensed values Sd and re-sense the ...
PUM
 Abstract
Description
Claims
Application Information
 - R&D
- Intellectual Property
- Life Sciences
- Materials
- Tech Scout
- Unparalleled Data Quality
- Higher Quality Content
- 60% Fewer Hallucinations
Browse by: Latest US Patents, China's latest patents, Technical Efficacy Thesaurus, Application Domain, Technology Topic, Popular Technical Reports.
© 2025 PatSnap. All rights reserved.Legal|Privacy policy|Modern Slavery Act Transparency Statement|Sitemap|About US| Contact US: help@patsnap.com


