Method and system to unify and display simulation and real-time plant data for problem-solving

a technology of applied in the field of method and system to unify and display simulation and real-time plant data for problem solving, can solve problems such as inability to intuitively integrate existing systems, achieve high intuitive and effective, enhance workflow, and remove uncertainty and ambiguity

Active Publication Date: 2016-09-13
ASPENTECH CORP
View PDF65 Cites 11 Cited by
  • Summary
  • Abstract
  • Description
  • Claims
  • Application Information

AI Technical Summary

Benefits of technology

[0009]An advantage of the present invention is that it provides a highly intuitive and effective system that brings disparate systems together. The present invention brings together, in a collated manner, real-time plant data with process simulation data which is a preferred way to compare planned and actual estimates for the plant data. In one embodiment of the present invention, the present invention uses aspenONE (Trademark of Assignee) and Aspen Search (Trademark of Assignee) which bring together real-time data and simulation data together in Aspen PLUS (Trademark of Assignee), Aspen HYSYS (Trademark of Assignee), and Aspen Simulation Workbook (ASW) (Trademark of Assignee). However, the present invention may include other such simulation tools.
[0010]A further advantage of the present invention is that the system includes an enhanced workflow to help remove uncertainty and ambiguity because the workflow presents facts by interacting with data sources directly. One advantage of the present invention is that it includes a “Progressive Visual Collaboration” (PVC) technique that enables a dynamic media where engineers from respective domains are enabled to socialize and troubleshoot a problem by sourcing critical, context-relevant information. PVC removes ambiguity and uncertainty by considering factual data, and provides progressive workflow to enable problem-solving.
[0011]The present invention includes a computer-implemented method of managing data for at least one user comprising: sensing actual real-time processing plant operation status data for at least one asset from a set of assets of a processing plant through at least one sensor; recording, to a computer server, the actual real-time processing plant operation status data sensed from the at least one sensor; performing a simulation, through at least one simulation model from a set of simulation models of a planned process design specification, through a computer-implemented simulation engine; recording process design specification data from the simulation, through the computer-implemented simulation engine; correlating the actual real-time processing plant operation status data and the process design specification data through a computer-implemented correlation engine, into a set of correlated data; displaying the set of correlated data, to the at least one user through a computer display, such that the actual real-time processing plant operation status data and the process design specification data are streaming, and visually presented, concurrently, to the at least one user at the same time; and displaying at least one set of further details of the set of correlated data, based upon interaction from the at least one user through a user interface.
[0012]The present invention further includes a method wherein the actual real-time processing plant operation status data is used as feedback and provided to the at least one simulation model, thereby improving accuracy of the at least one simulation model. The present invention further includes a method wherein a plurality of scenarios may be simulated by adjusting model parameters of the at least one simulation model and further performing the simulation. The present invention includes a further step of: applying a scenario, from a plurality of scenarios, to the set of assets, to resolve an issue. The present invention includes the further steps of: locating at least one plant identifier, within the actual real-time processing plant operation status data, when presented with a search command by the at least one user; associating the at least one plant identifier to at least one simulation model variable of the at least one simulation model; displaying the at least one plant identifier together with the at least one simulation model variable and together with the at least one set of further details of the set of correlated data that include one of, based on user selection, and over a user-specified time range, at least one of the following: live data, real-time data, time-averaged data, historical averaged data, trend data, or historical performance trend data.
[0013]The present invention further includes a method wherein the at least one set of further details of correlated data includes, based on user selection, and over a user-specified time range, at least one of the following: a graph, a pictograph, a bar graph, a scatter plot, a pie graph, a histogram, a bar chart, a pie chart, a Gantt chart, a line cart, a candlestick chart, or a table. The present invention further includes a method wherein the actual real-time processing plant operation status data and the process design specification data are displayed together in a manner in which they share the same timeline, the same time scale, the same current time, and the same previous start time, and are displayed within a user-specified time range.
[0014]The present invention further includes a method wherein the at least one set of further details of the correlated data include one of, based on user selection, live data, real-time data, time-averaged data, historical averaged data, trend data, or historical performance trend data. The present invention further includes a method wherein the set of correlated data forms a plurality of sets of correlated data which are displayed concurrently with each other. The present invention further includes a method wherein the computer-implemented simulation engine and the at least one sensor are at different geographic locations, and the actual real-time processing plant operation status data and the process design specification data are linked through a computer network.

Problems solved by technology

Additionally, it is not intuitive for existing systems to come up with such a solution because many challenges are faced by all web applications, such as latent communication, a weak presentation layer, devices, and a lack of standards.

Method used


Image

  • Method and system to unify and display simulation and real-time plant data for problem-solving
  • Method and system to unify and display simulation and real-time plant data for problem-solving
  • Method and system to unify and display simulation and real-time plant data for problem-solving

Examples


Embodiment Construction

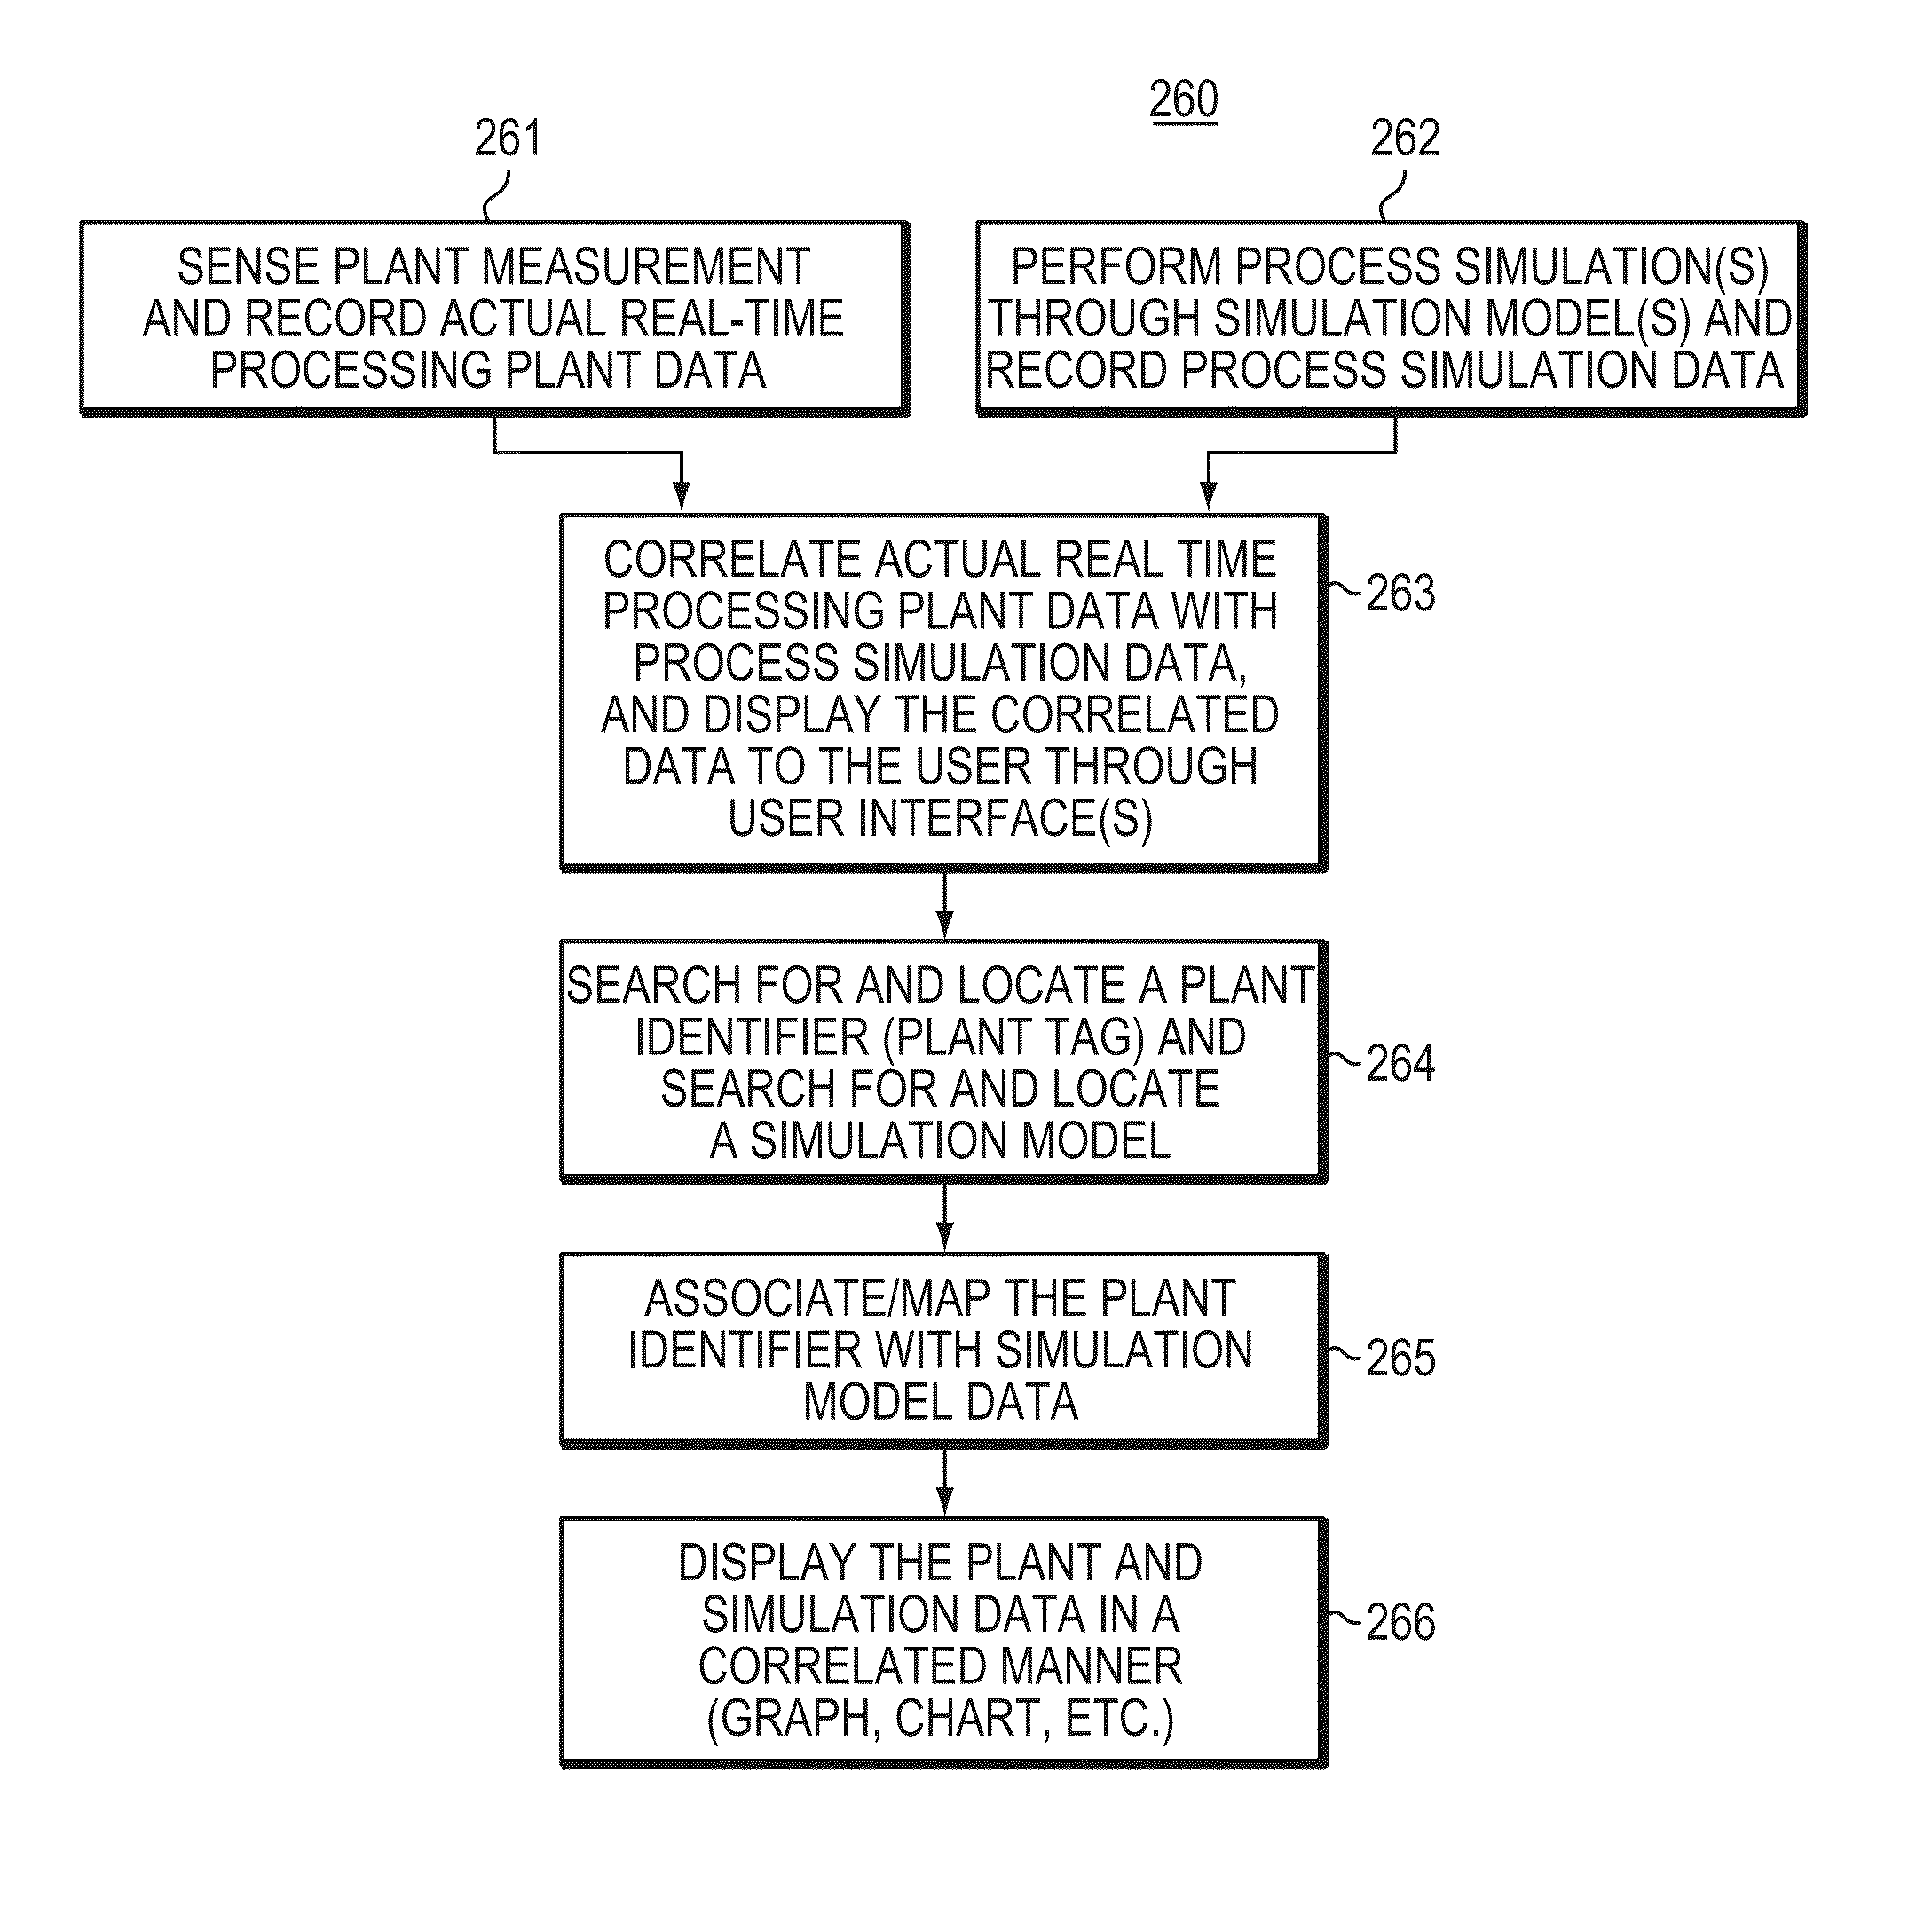
[0038]A description of example embodiments of the invention follows.

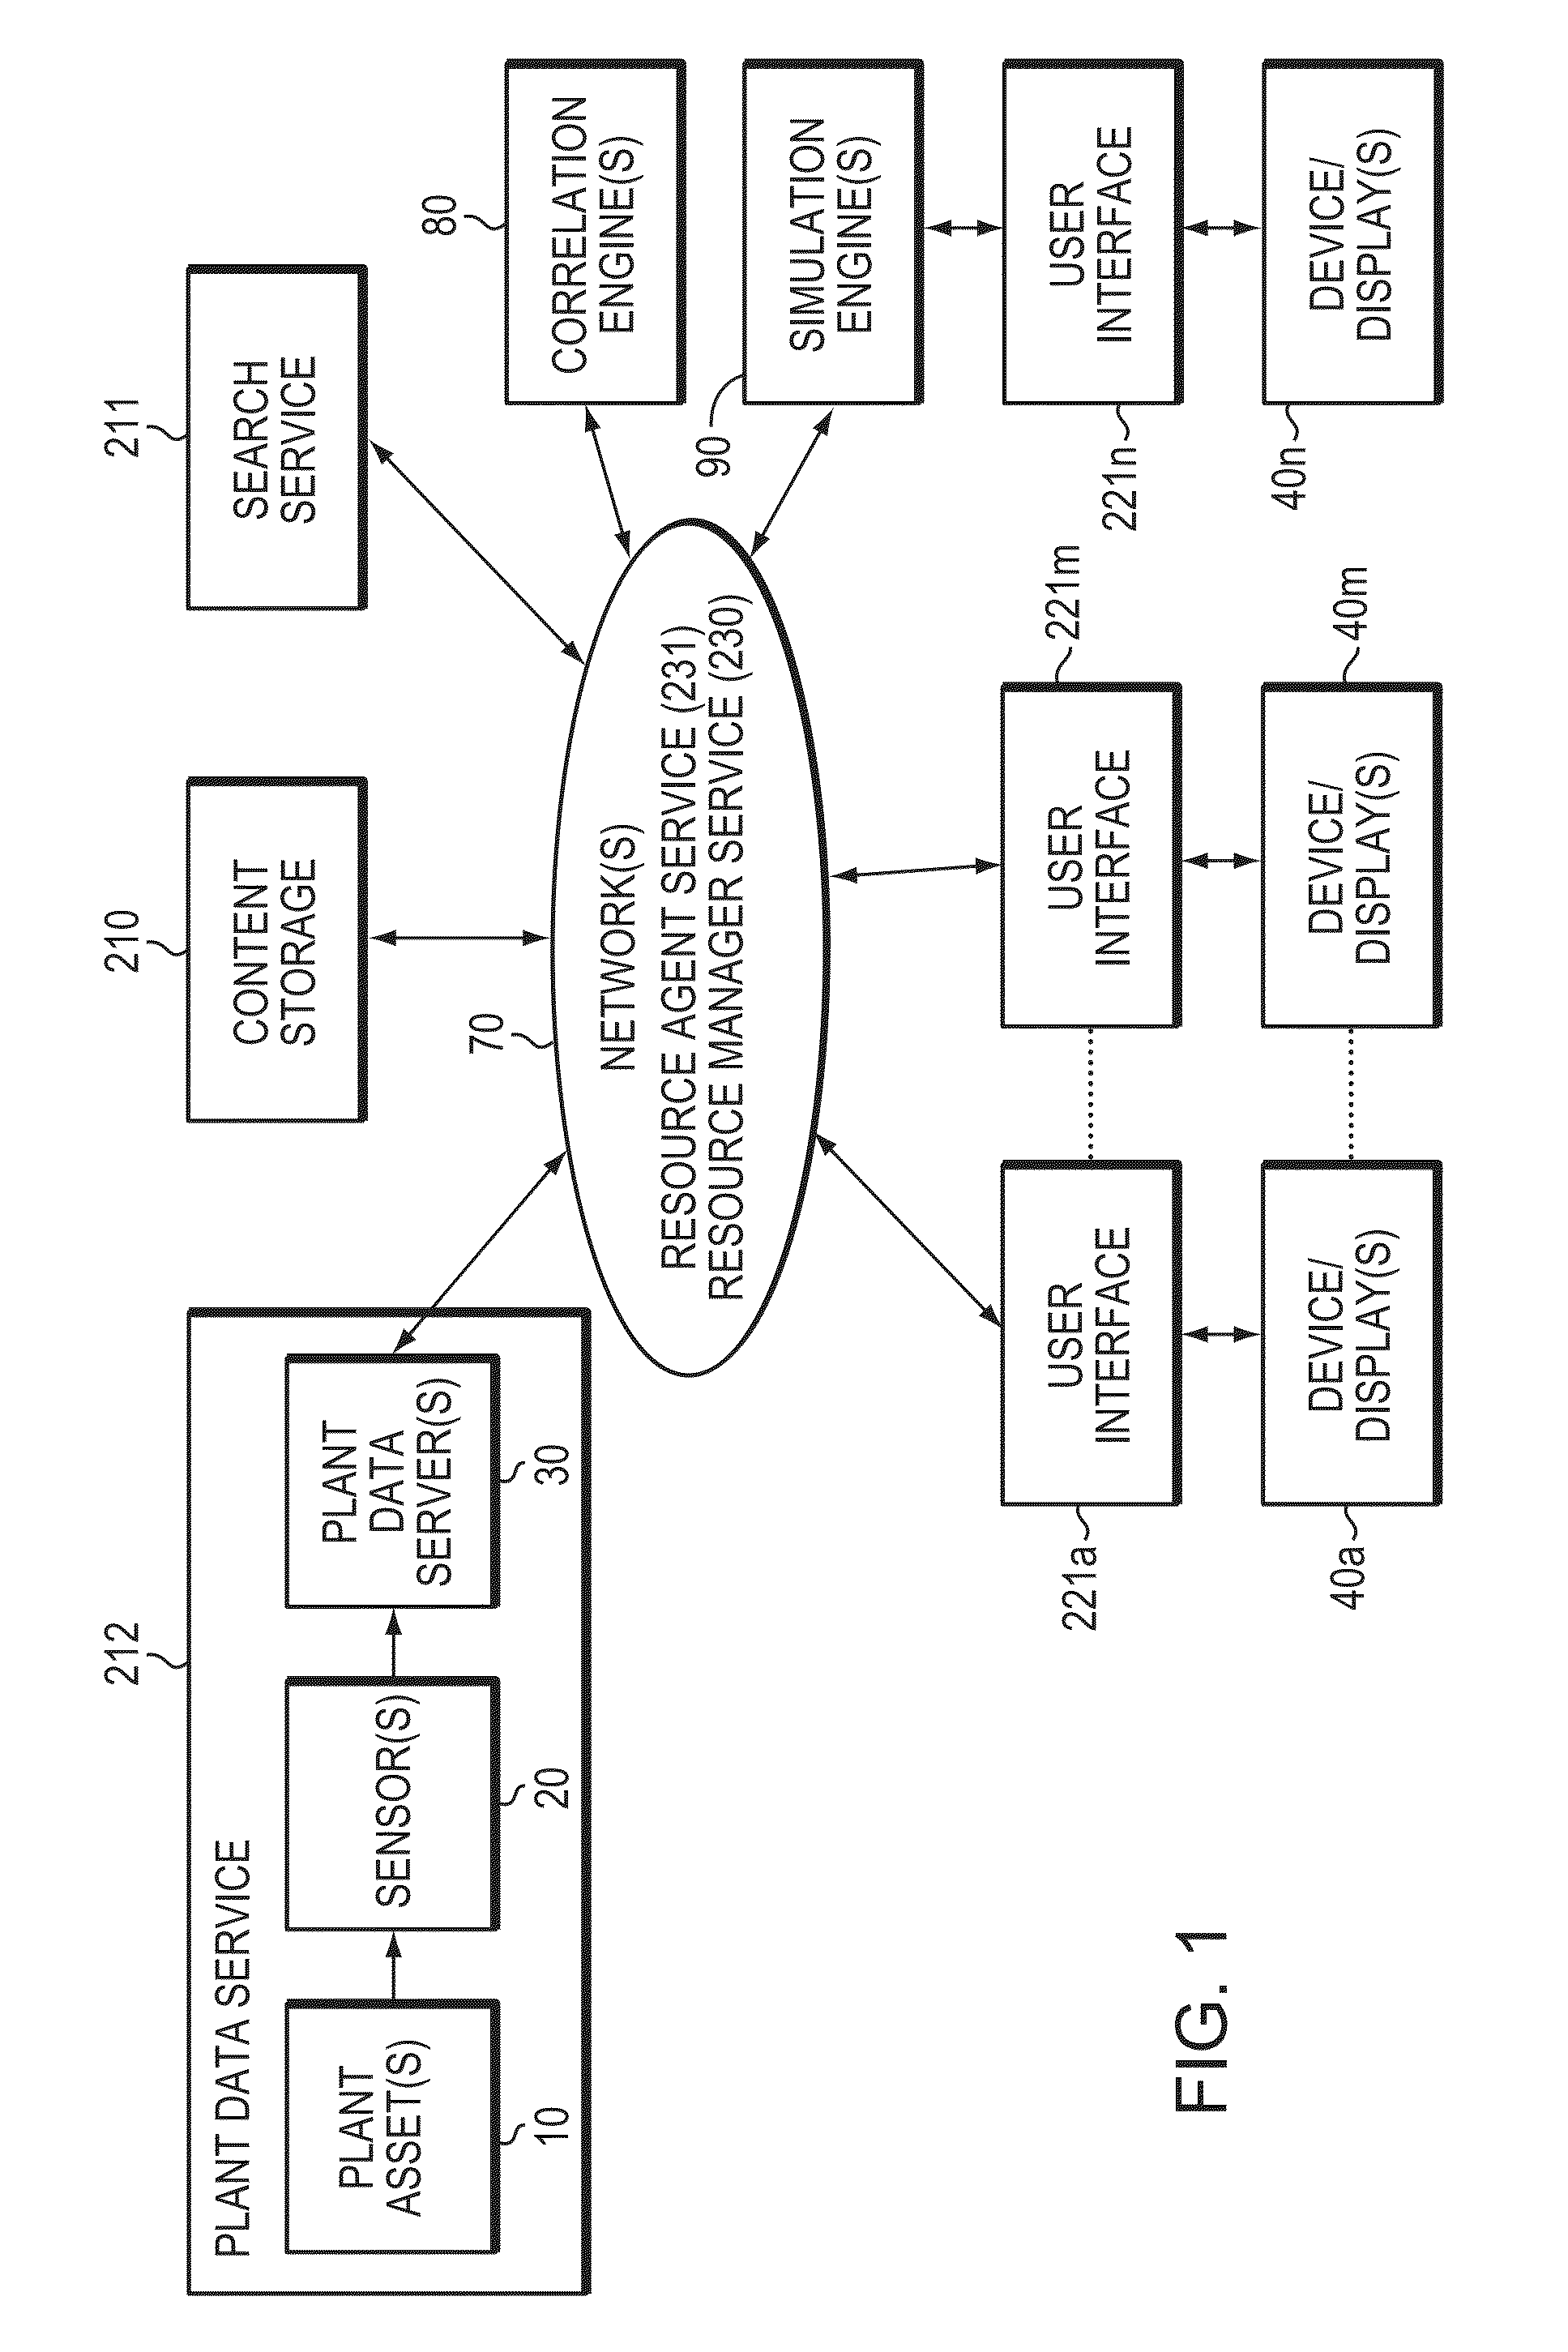
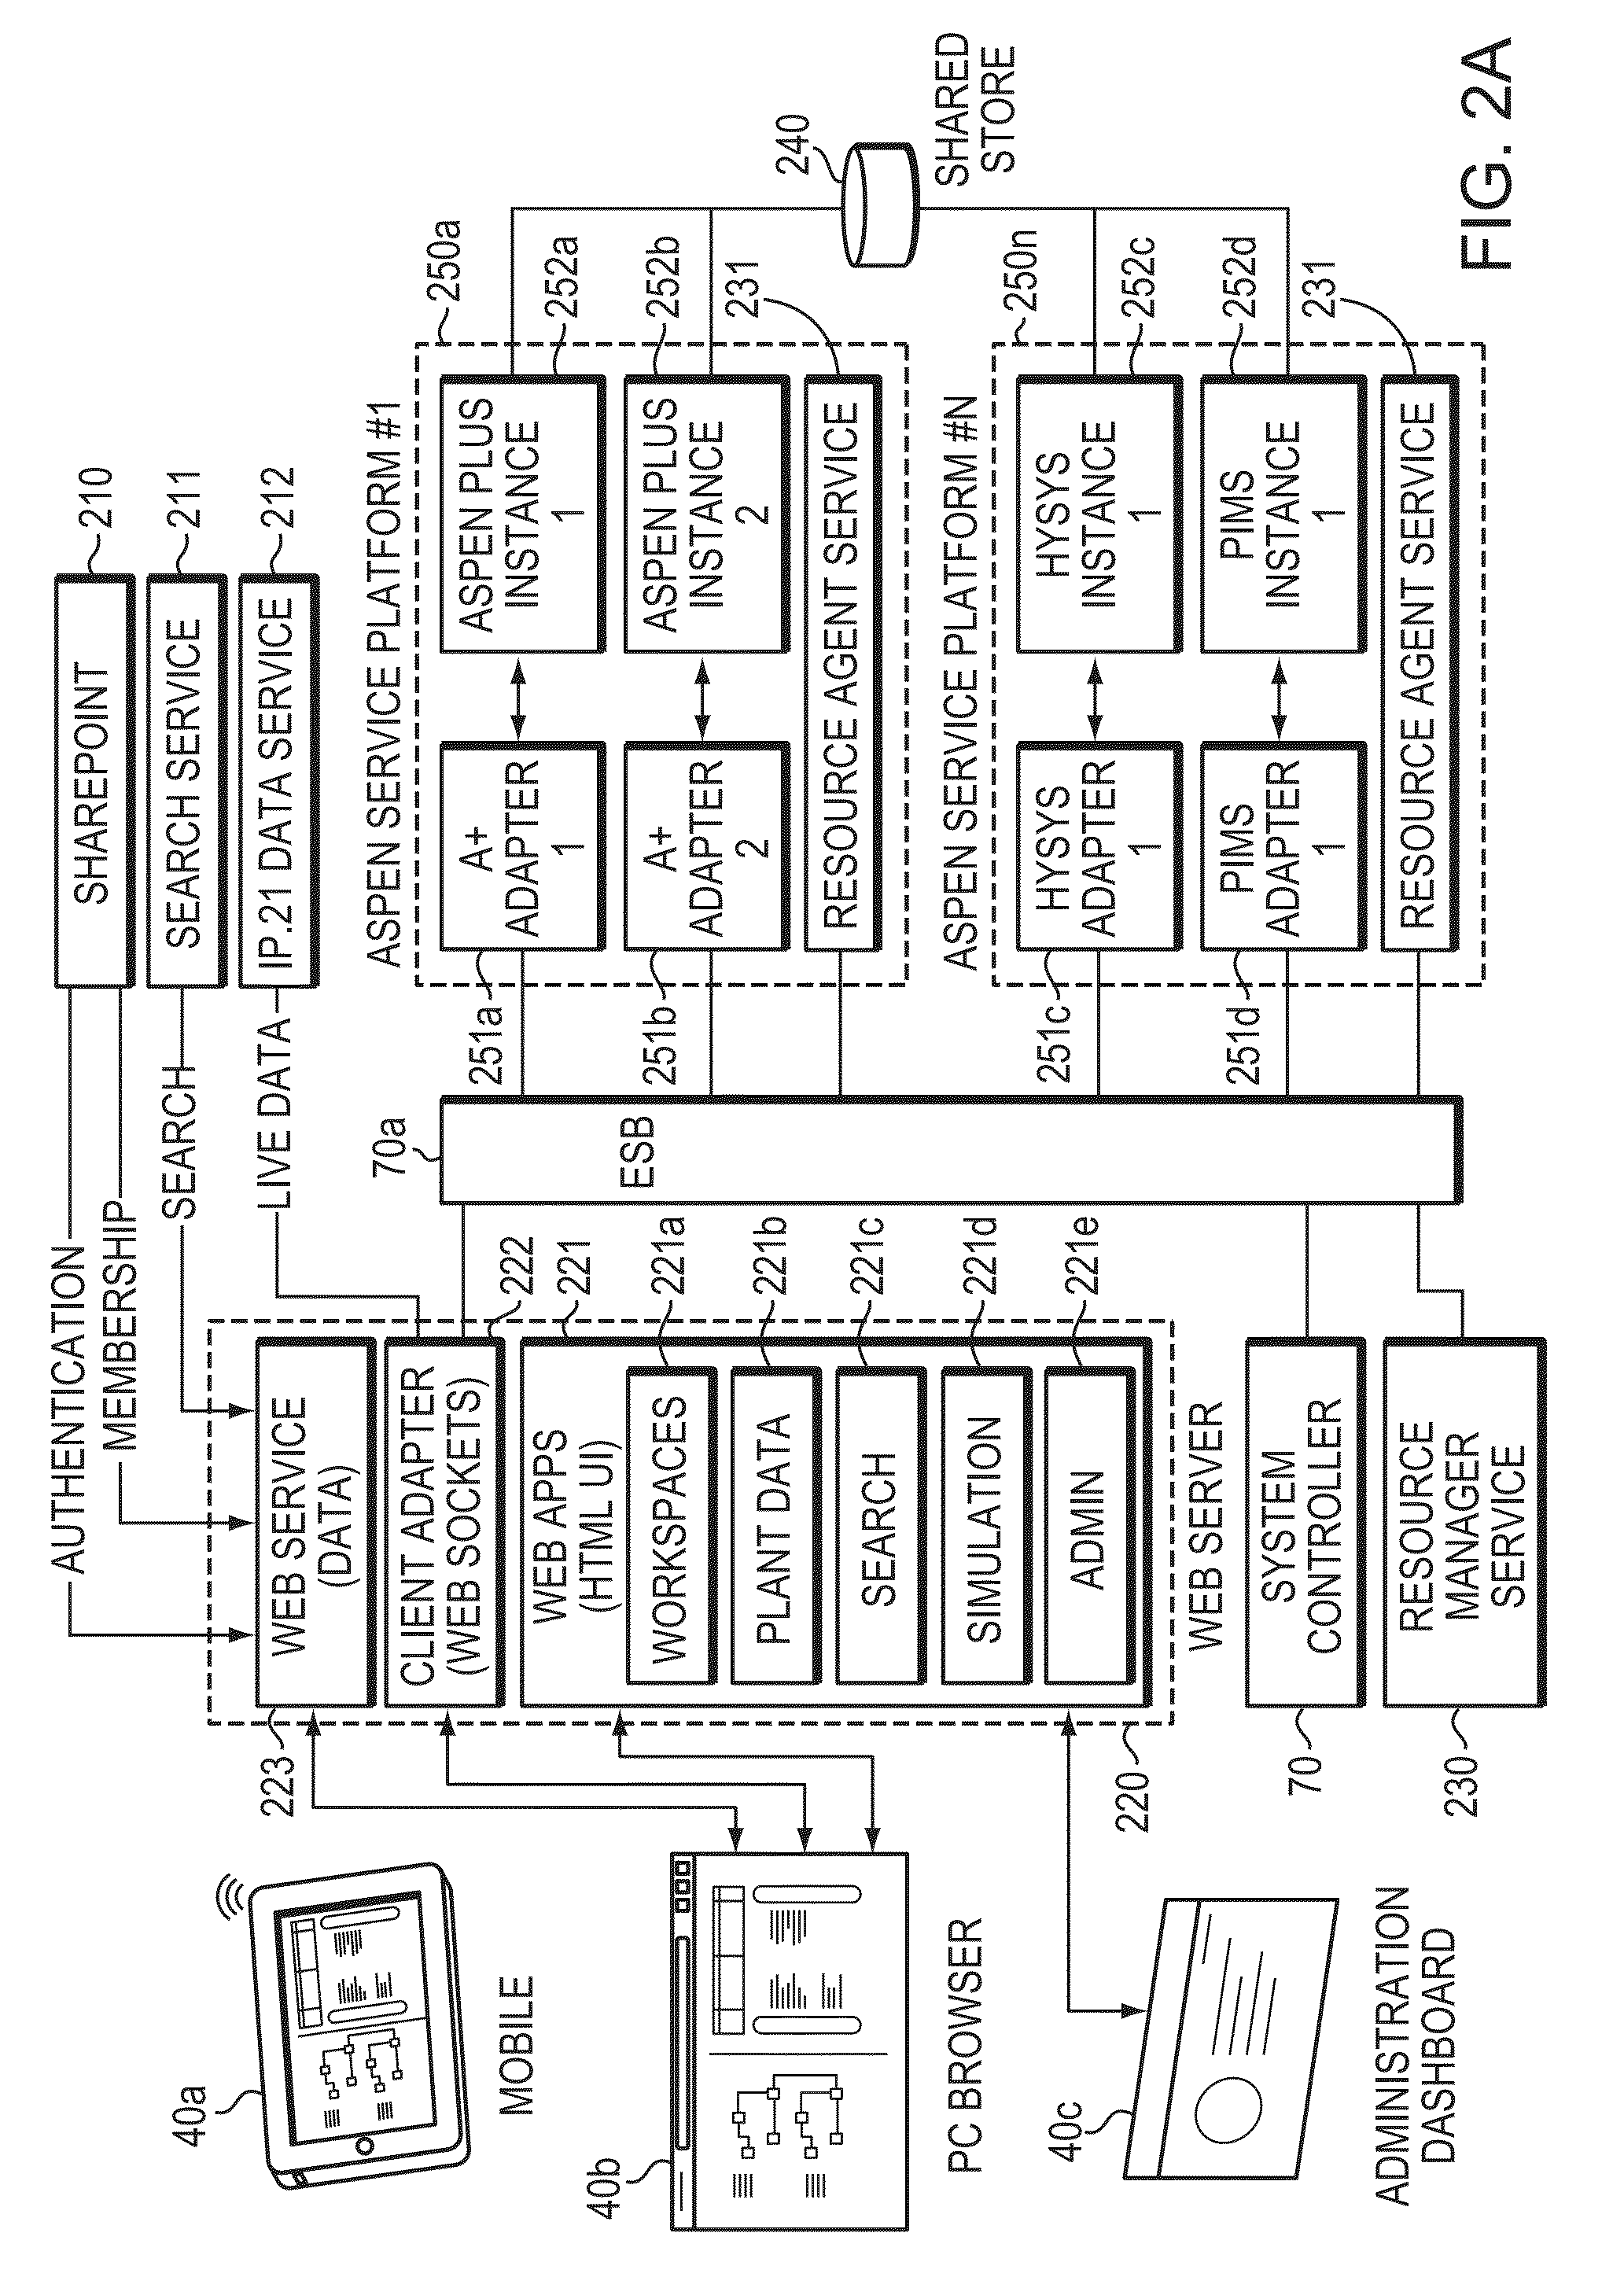
[0039]FIG. 1 is a schematic view of the computer processing system embodying the present invention. In a preferred embodiment, each element in FIG. 1 may be implemented in software, hardware, or both, where each element is executed through a computer processing means. Each FIG. 1 element may either be in the same geographic location, or in a different geographic location, compared with other elements. In FIG. 1, each element may be either plural or singular.

[0040]FIG. 1 illustrates a plant data service 212 that includes a plant asset 10 being monitored by a sensor 20, and a sensor recording a plant measurement of plant data to a plant data server 30. For example, the assets 10 of a processing plant may include, but are not limited to, distillation columns, pumps, valves, heat exchangers, evaporators, boilers, and other assets.

[0041]A simulation engine 90 performs a simulation on a simulation model from a set of simu...


PUM


Abstract

A computer-based method and system brings together data from two business domains: real-time actual plant status operation data and predictive process simulation data based upon a design specification. This method and system correlates the plant data and the simulation data, and displays the results side-by-side for the user. The results assist the user, to determine whether the plant is operating properly, and to make further improvements to both the plant assets and to the simulation models. The invention assists with monitoring, maintaining, trouble shooting, and problem solving of plant operation. The invention facilitates a progressive visual collaborative environment between plant operation and process engineering teams, where engineers from respective domains may socialize and trouble shoot problems. The Progressive Visual Collaboration helps professionals with searching, sharing, mapping, analyzing, framing problems, removing ambiguity and uncertainty by considering facts and figures, and providing a progressive workflow that solves plant problems.

Description

BACKGROUND OF THE INVENTION[0001]The process industry goes through rigorous planning, designing, construction, and operating procedures. Plant conditions fluctuate all the time, but the plant also has multiple modes of operation, e.g. summer mode, winter mode; normal throughput, reduced or increased throughput; also different grades of product or a different feedstock require the plant to operate in a different mode.[0002]The existing method of comparing a model to plant data is time consuming. Process engineers typically do not have direct access to tools to access live plant data, requiring collaboration with operations personnel. Large volumes of plant data are exported to spreadsheets and events are analyzed using spreadsheet plotting tools. Having identified an event, values are copied from the spreadsheet to modeling tools. Some existing techniques for plant data measurements also include manual plant measurements from data historians, which do not provide real-time data. Some...

Claims


Application Information

Patent Timeline
Patent Type & Authority Patents(United States)
IPC IPC(8): G06G7/48G05B17/02G06F17/50
CPCG05B17/02G06F17/5009G05B2219/23445G06F30/20
Inventor SUBRAMANIAN, ASHOK R.LINGARD, SIMONYAMASHITA, YOSHIO
Owner ASPENTECH CORP
Why Eureka
Try Eureka