
Detection of R-peak point in an electrocardiogram signal

a technology of electrocardiogram signal and r-peak point, which is applied in the field of electrocardiogram signal detection, can solve the problems of reducing accuracy and faulty detection of qrs-complex, failing to provide accurate, and several detections of r-peak points have been faulty

Active Publication Date: 2017-01-31
PIXART IMAGING INC
View PDF1 Cites 1 Cited by
  • Summary
  • Abstract
  • Description
  • Claims
  • Application Information

AI Technical Summary

Benefits of technology

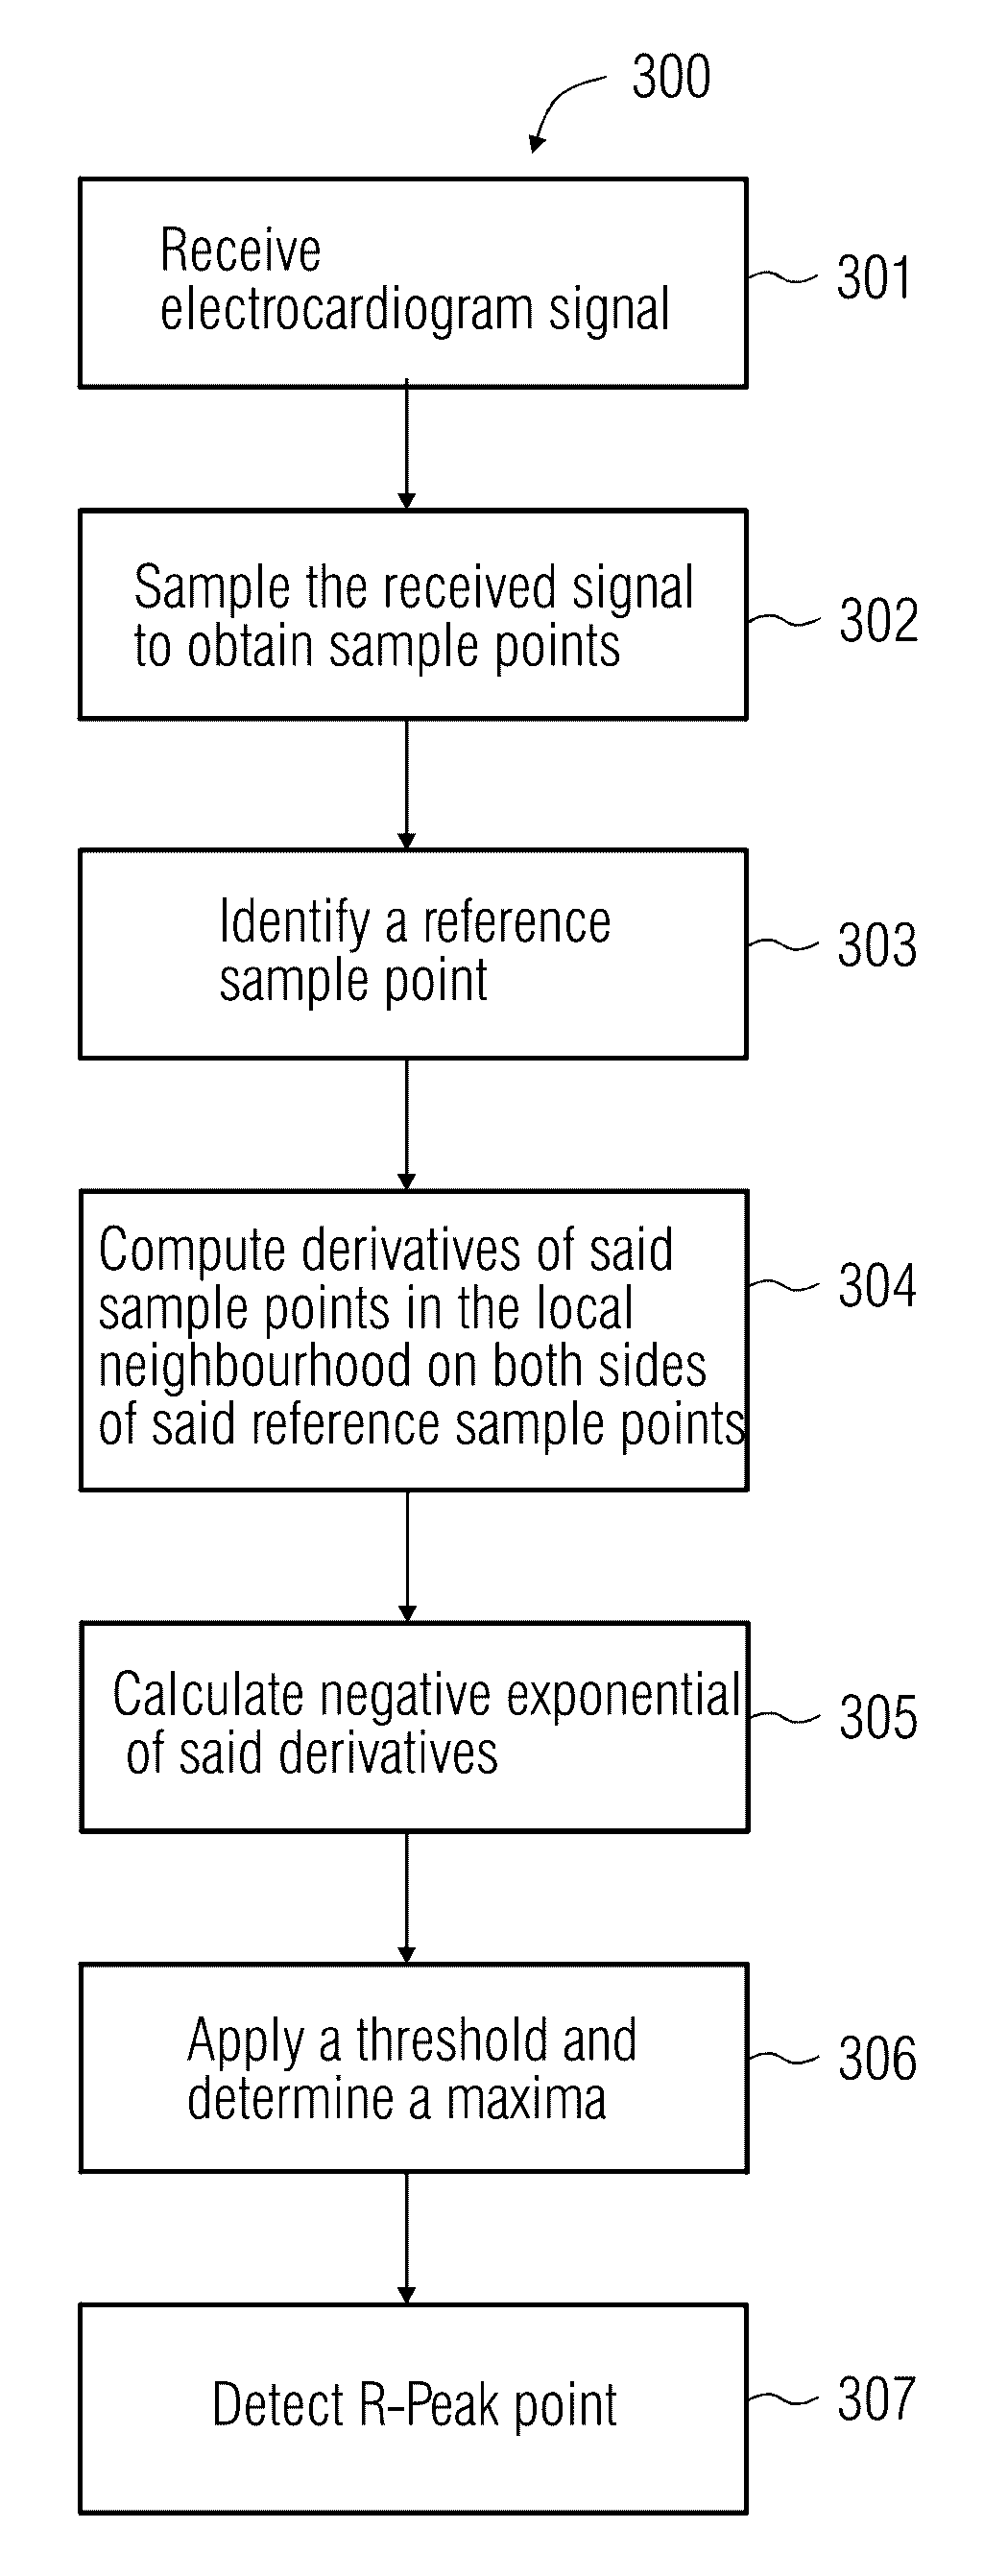
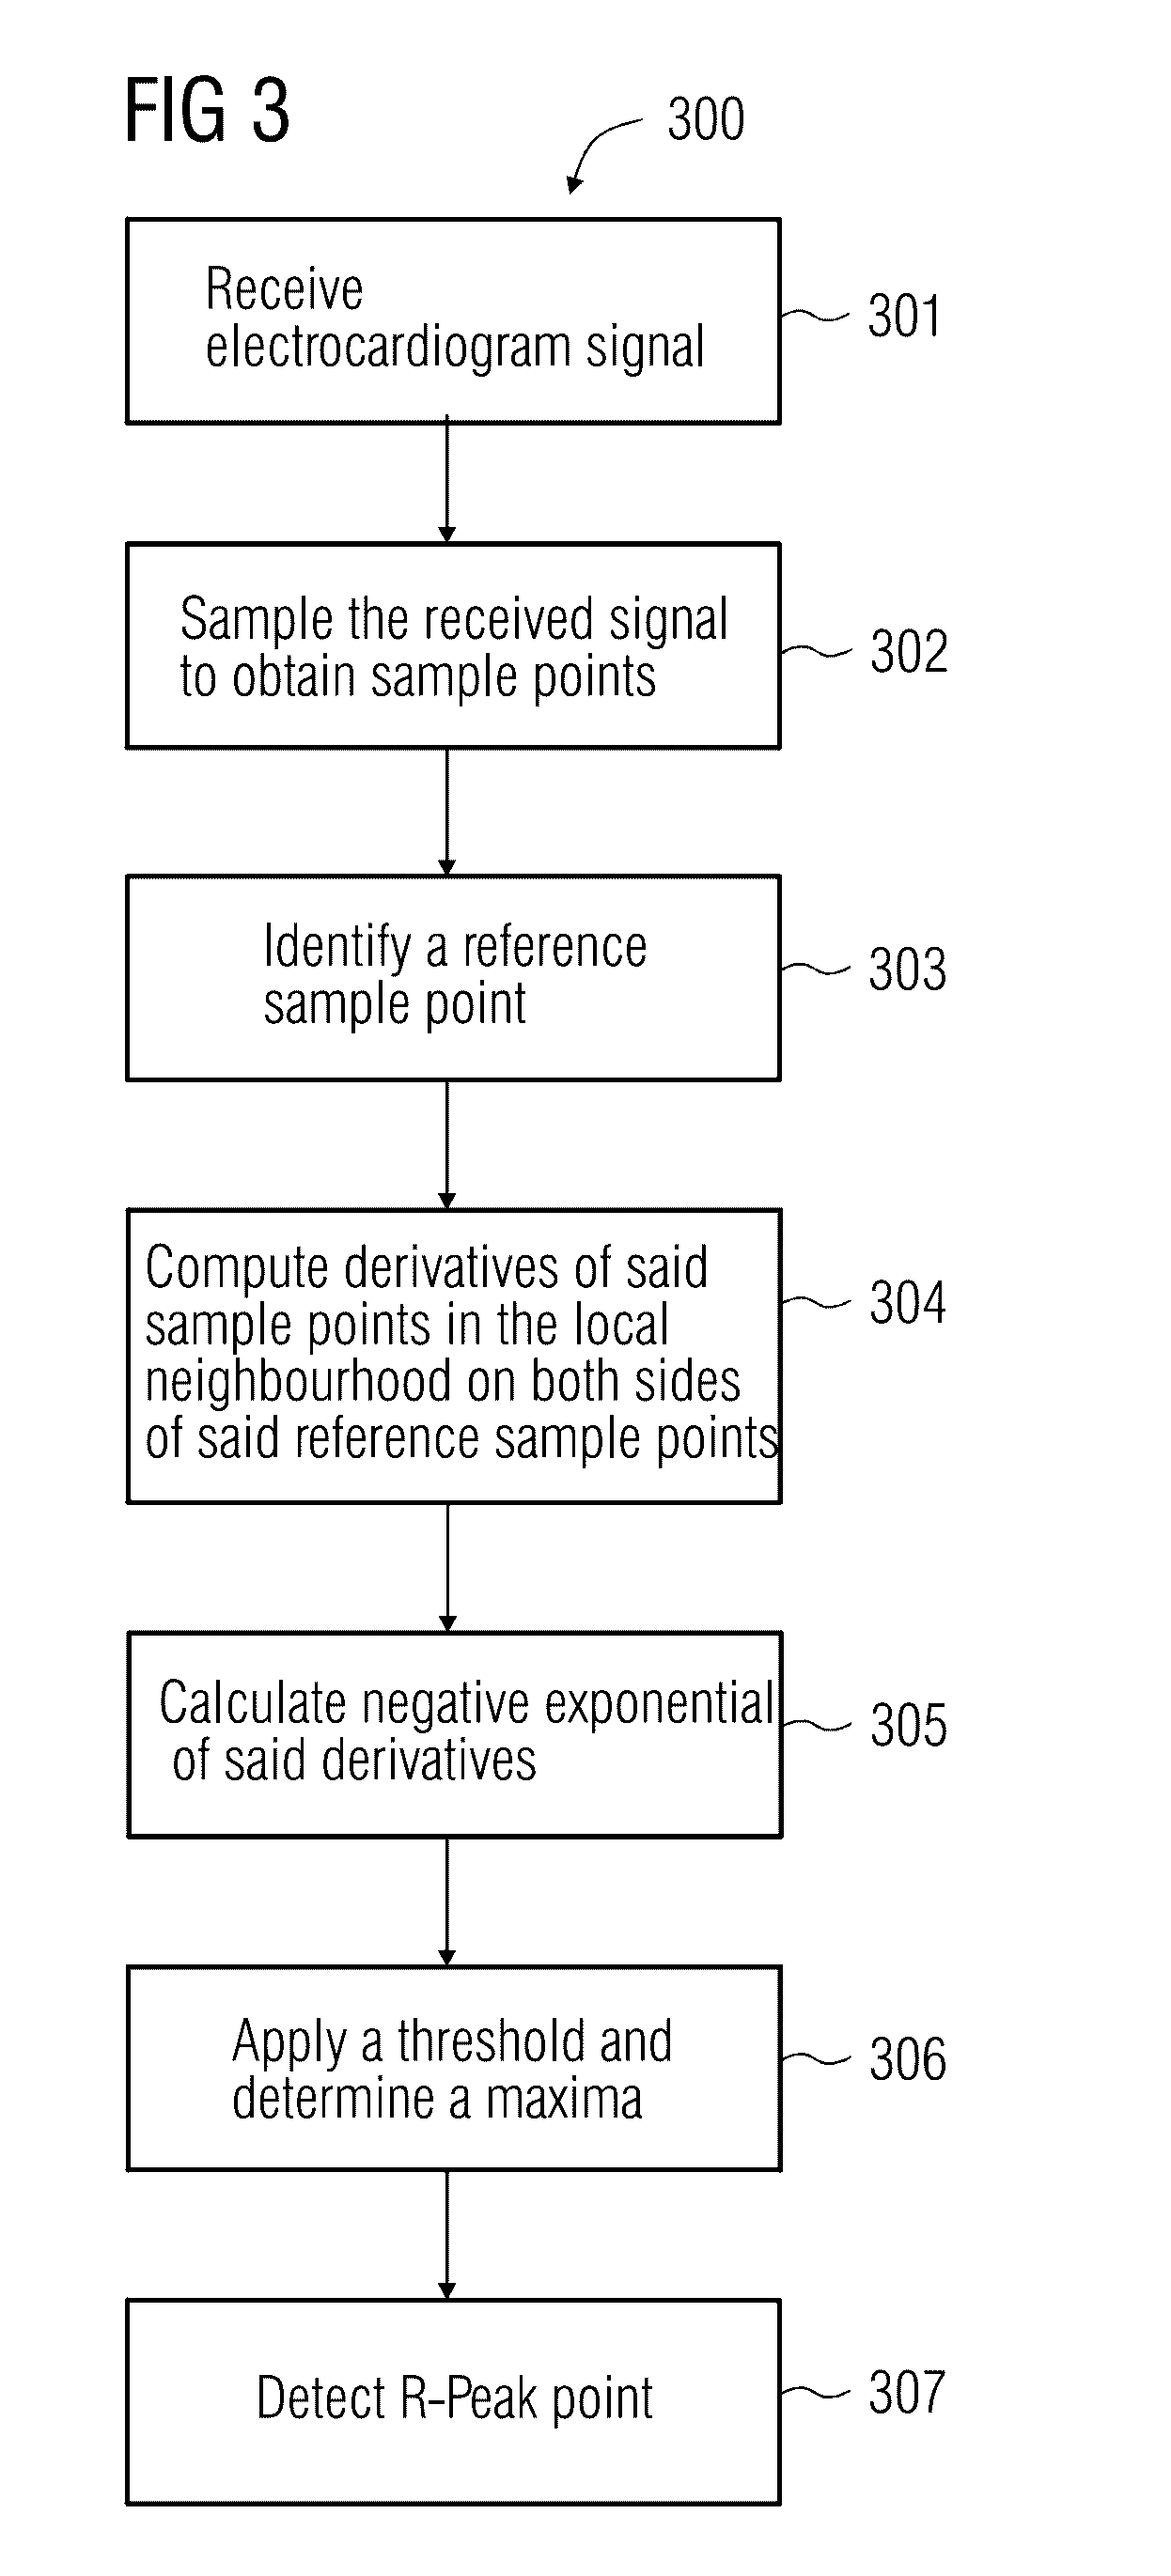
The patent is about a method for analyzing electrocardiogram signals. The method involves identifying a reference sample point and computing the derivatives of the sample point in its local neighborhood. This helps in capturing sharp changes in the signal. The method also includes calculating the negative exponential of the derivatives to get a probabilistic response value that is invariant to certain factors. This makes it easier to determine the R-peak points on the signal. The method can improve the accuracy and reliability of detecting the R-peak points and has potential applications in the field of medical diagnosis.

Problems solved by technology

Although detection of the QRS-complex is not a problem, noise, pathological signals and variations in amplitudes may result in significantly reduced accuracy and faulty detection of the QRS-complex.
Contrarily, this method fails to provide accurate results where variations in the ECG signal are more than MIT / BIH dataset.
Several detections of R-peak points have been faulty, and many R-peak points have been missed.
Setting a single threshold for the computed responses is difficult due to the instability.

Method used


Image

  • Detection of R-peak point in an electrocardiogram signal
  • Detection of R-peak point in an electrocardiogram signal
  • Detection of R-peak point in an electrocardiogram signal

Examples


Embodiment Construction

[0037]The various embodiments are described with reference to the drawings, where like reference numerals are used to refer to like elements throughout. In the following description, for purpose of explanation, numerous specific details are set forth in order to provide a thorough understanding of one or more embodiments. Such embodiments may be practiced without these specific details.

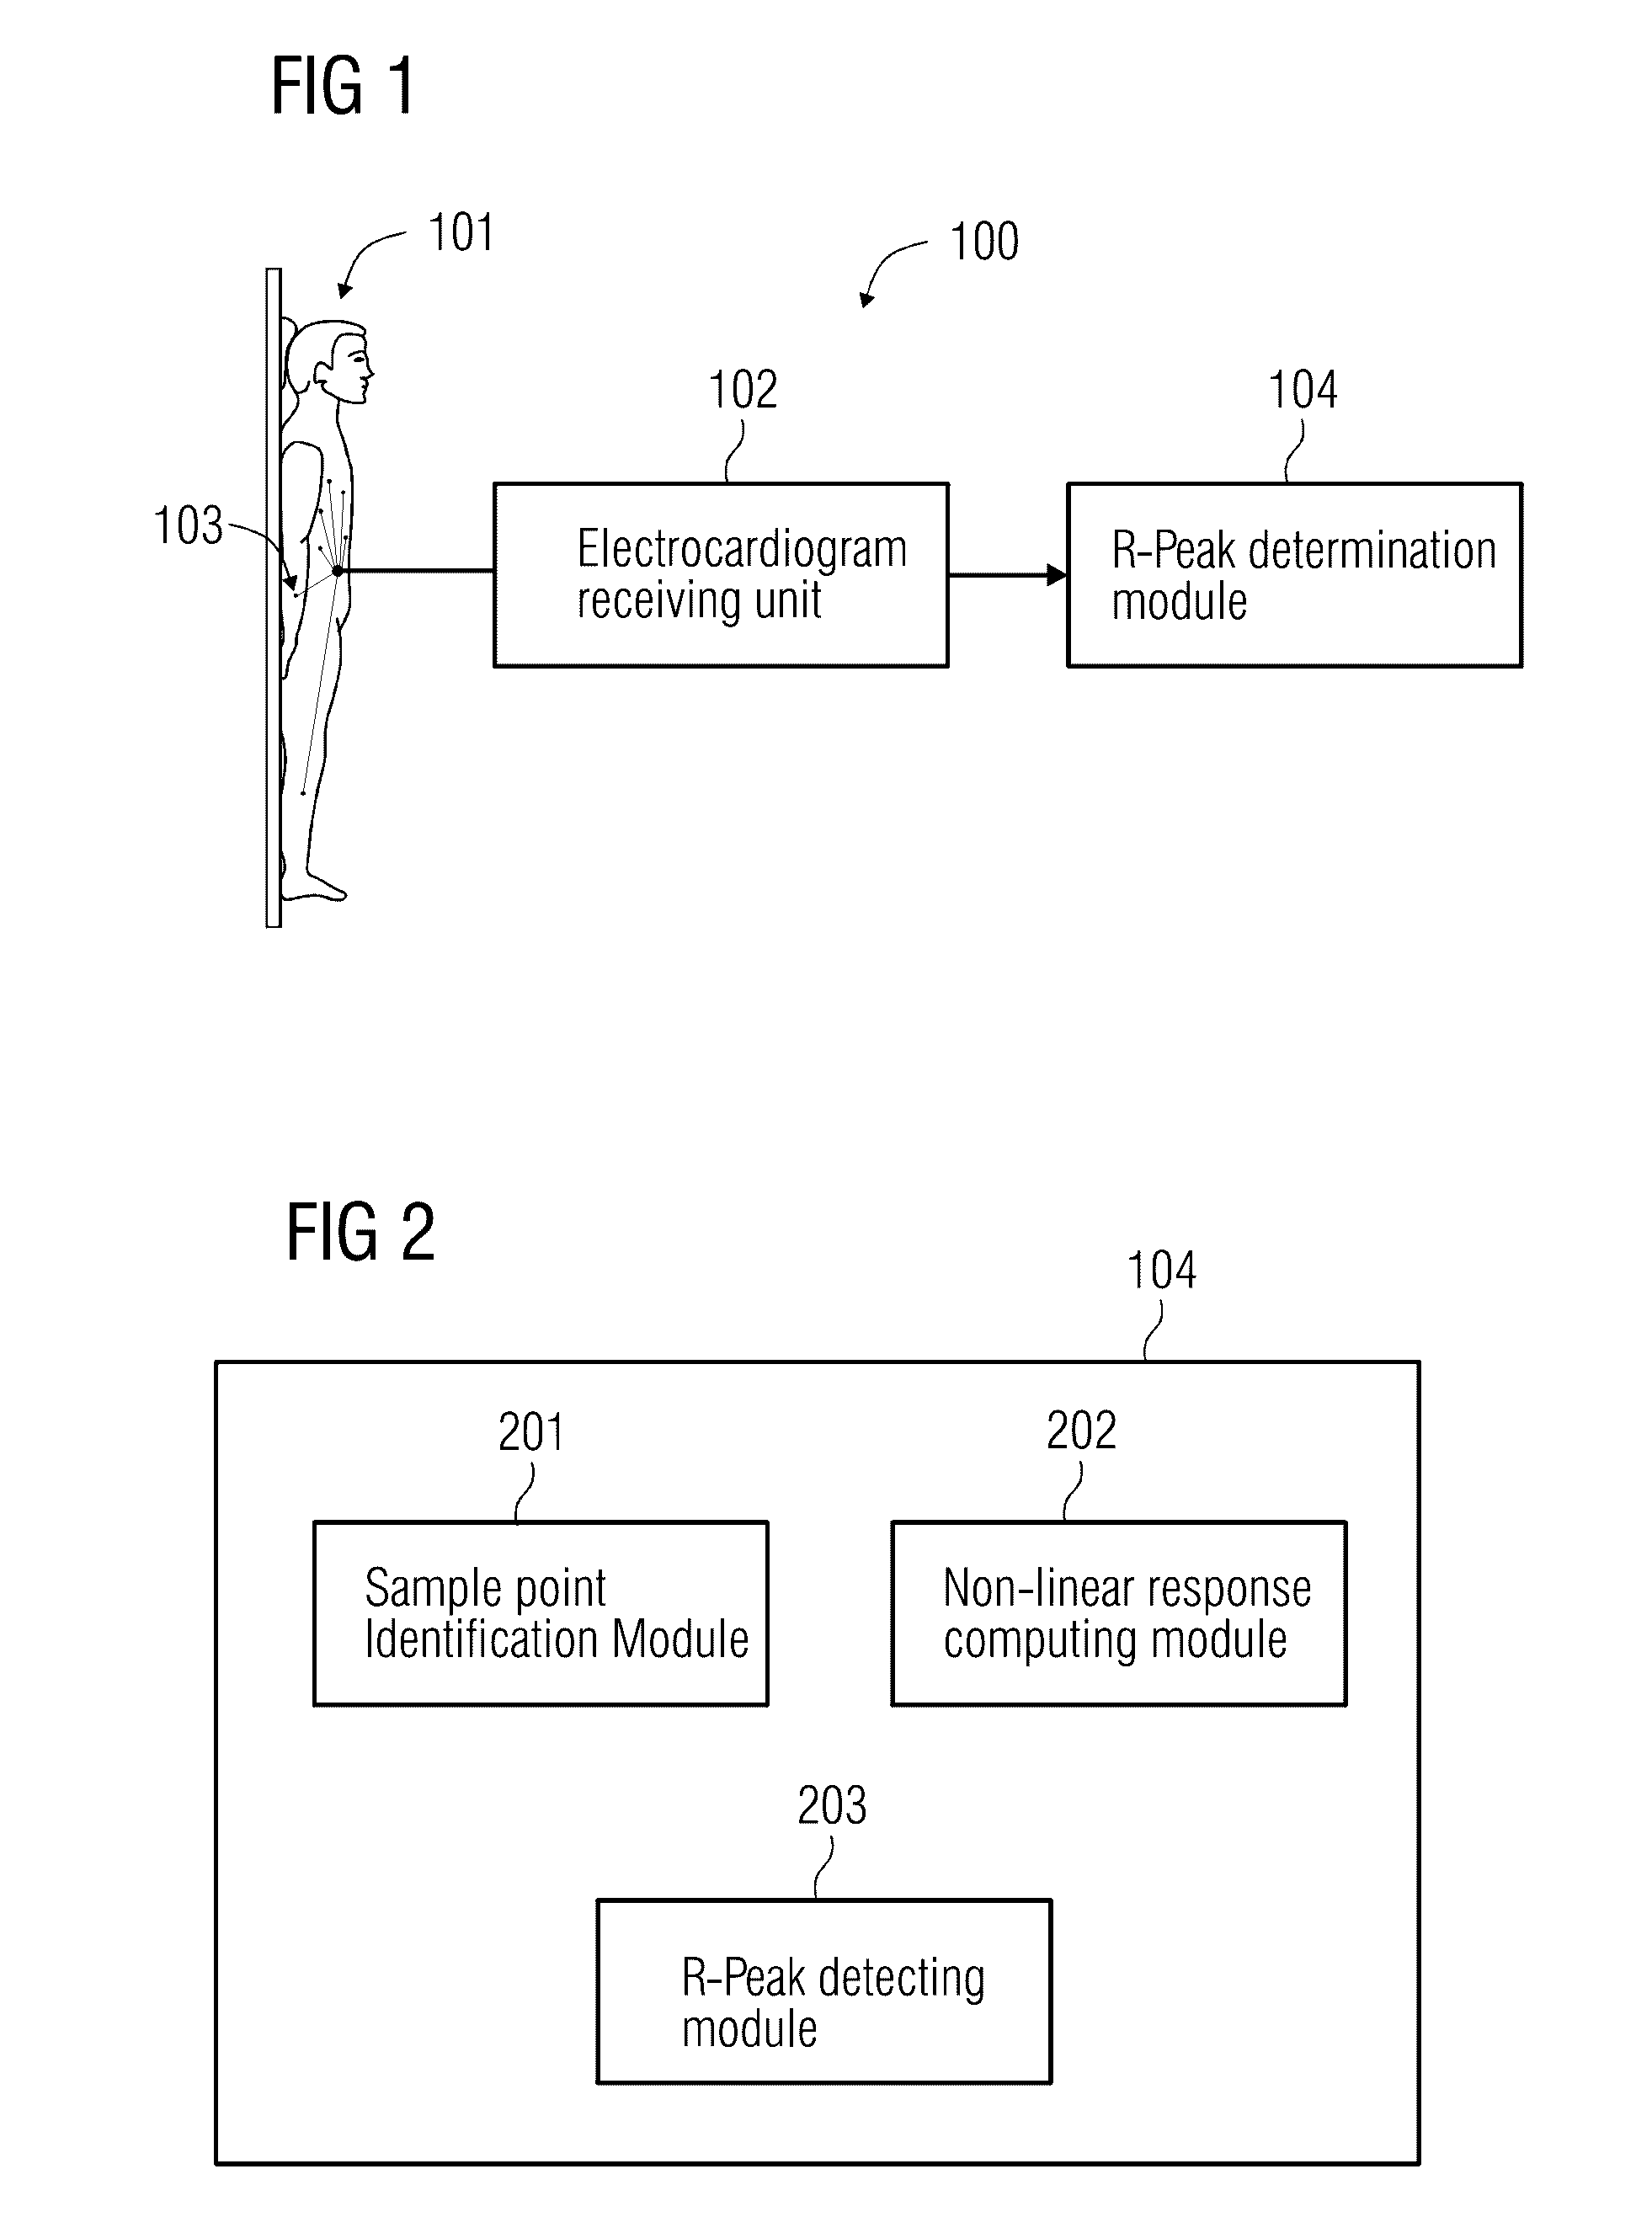
[0038]FIG. 1 shows a block diagram of one embodiment of an electrocardiogram monitoring environment 100. In the environment 100, an electrocardiogram signal of an individual 101 is recorded and is monitored. The electrocardiogram signal depicts the electrical activity of the heart. The electrical activity is measured over a period of time to compute electrocardiogram signals. A typical electrocardiogram signal includes a P wave, a QRS complex, a T wave and a U wave. These waveforms are generated as a result of polarization and depolarization of cardiac tissues. The waveform is then used to measure the...


PUM


Abstract

Detection of R-peak signal in an electrocardiogram signal is provided. An electrocardiogram signal representing heart activity of an individual is received. The electrocardiogram signal is sampled to obtain a plurality of sample points, and a bounded non-linear response value is computed for each sample point of the received signal by calculating a negative exponential of derivatives of the sample points.

Description

FIELD OF TECHNOLOGY[0001]The present embodiments relate to the field of detection of an electrocardiogram signal.BACKGROUND[0002]The electrocardiogram (ECG) is a representation of electrical activity of the heart. An ECG signal may be represented by multiple key points of clinical relevance such as QRS, P wave and T wave. The QRS-complex is considered to be the most important waveform in an ECG signal. The QRS-complex includes three characteristic points within one cardiac cycle denoted as Q, R and S. R-peak in such QRS complex is one of the most pivotal points to analyze an ECG signal. Therefore, detection of the QRS-complex is fundamental to the analysis of an ECG signal. Although detection of the QRS-complex is not a problem, noise, pathological signals and variations in amplitudes may result in significantly reduced accuracy and faulty detection of the QRS-complex.[0003]Currently, R-peak in an ECG signal may be detected by several methods. These methods make use of derivative fe...

Claims


Application Information

Patent Timeline
Patent Type & Authority Patents(United States)
IPC IPC(8): A61B5/0456A61B5/044A61B5/352
CPCA61B5/0456A61B5/044A61B5/339A61B5/352
Inventor SINGH, GURKIRT
Owner PIXART IMAGING INC
Learn More