Interactive analysis of mass spectrometry data

a mass spectrometry and data technology, applied in the field of interactive analysis of mass spectrometry data, can solve the problems of loss of safety and efficacy, biologics are prone to production problems, and the analytical challenge is much more demanding

Active Publication Date: 2017-05-02
PROTEIN METRICS LLC
View PDF50 Cites 18 Cited by
  • Summary
  • Abstract
  • Description
  • Claims
  • Application Information

AI Technical Summary

Benefits of technology

[0022]Yet another aspect of the invention provides non-transitory machine-readable media that store instructions, which, when performed by a machine, cause the machine to perform operations comprising: (a) receiving a data file comprising mass spectrometry (MS) data for a sample comprising a mixture a reference molecule and one or more variant molecules, wherein each variant molecule has a chemical modification relative to the reference molecule, and wherein the MS data comprises a plurality of spectral representations; (b) providing an assembly of molecular identifications, wherein each molecular identification correlates a plurality of spectral representations with the reference molecule and a modification state, wherein the plurality of spectral representations comprise an extracted ion chromatogram (XIC), an MS1 spectrum and an MS2 spectrum, and wherein the modification state describes the chemical modification for a variant molecule relative to the reference molecule and wherein the modification state is null for the reference molecule; (c) selecting a molecular identification based on user-input; and (d) displaying an arrangement of a plurality of views in a graphical user interface. The plurality of views comprises: (1) a first XIC correlated to the selected peptide immediately adjacent to a second XIC correlated to a first molecular identification having the same reference molecule as the selected peptide but different modification state; (2) a first MS1 correlated to the selected peptide immediately adjacent to a second MS1 correlated to a first molecular identification having the same reference molecule as the selected peptide but different modification state; and (3) a first MS2 correlated to the selected peptide immediately adjacent to a second MS2 correlated to a first molecular identification having the same reference molecule as the selected peptide but different modification state.
[0023]Another aspect of the invention provides methods for displaying mass spectrometry data, the method comprising: (a) receiving a data file comprising mass spectrometry (MS) data for a sample comprising a mixture a reference molecule and one or more variant molecules, wherein each variant molecule has a chemical modification relative to the reference molecule, and wherein the MS data comprises a plurality of spectral representations; (b) providing an assembly of molecular identifications, wherein each molecular identification correlates a plurality of spectral representations with the reference molecule and a modification state, wherein the plurality of spectral representations comprise an extracted ion chromatogram (XIC), an MS1 spectrum and an MS2 spectrum, and wherein the modification state describes the chemical modification for a variant molecule relative to the reference molecule and wherein the modification state is null for the reference molecule; (c) selecting a molecular identification based on user-input; and (d) displaying an arrangement of a plurality of views in a graphical user interface. The plurality of views comprises: (1) a first XIC correlated to the selected peptide immediately adjacent to a second XIC correla...

Problems solved by technology

Due to the complexity of proteins and their biological production, characterization of protein pharmaceuticals (“biologics”) poses much more demanding analytical challenges than do small molecule drugs.
Biologics are prone to production problems such as sequence variation, misfolding, variant glycosylation, and post-production degradation including aggregation and modifications such as oxidation and deamidation.
These problems can lead to loss of safety and efficacy, so the biopharmaceutical industry would like to identify and quantify variant and degraded forms of the product down...

Method used


Image

  • Interactive analysis of mass spectrometry data
  • Interactive analysis of mass spectrometry data
  • Interactive analysis of mass spectrometry data

Examples


example 1

A. Example 1

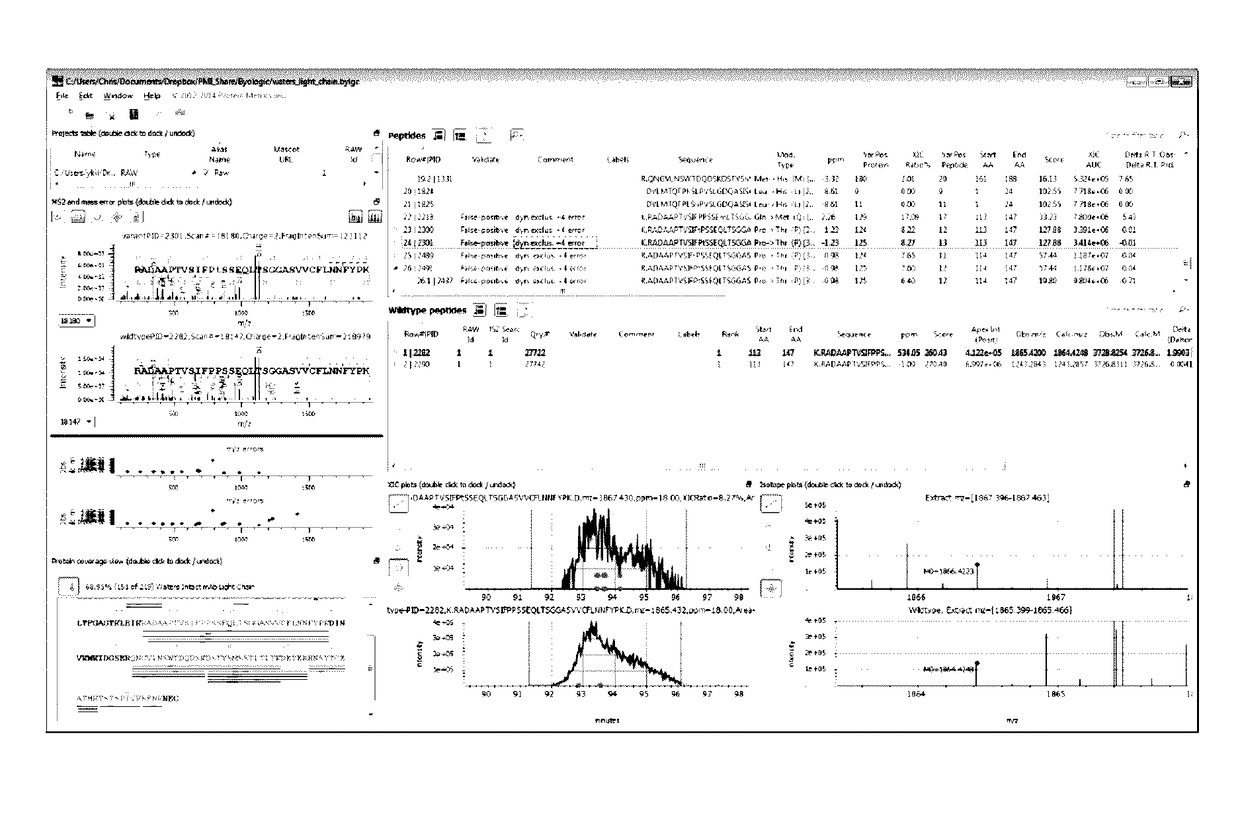
[0096]A controlled mixture of two human monoclonal antibodies (designated mAb1 and mAb2), was prepared with mAb2 at 1%. The controlled mixture was used as the sample for a 3-hour LC-MS / MS run on Thermo Orbitrap Elite to generate, Orbitrap MS1, CID fragmentation, ion-trap MS2. Several MS2 searches were performed utilizing Byonic (Protein Metrics, Belmont, Calif., USA), including searches for the most common amino acid substitutions at most one per peptide, any amino acid substitution at most one per peptide, combinations of substitutions and modifications, and a wild card search (any mass delta within + / −210 Da).

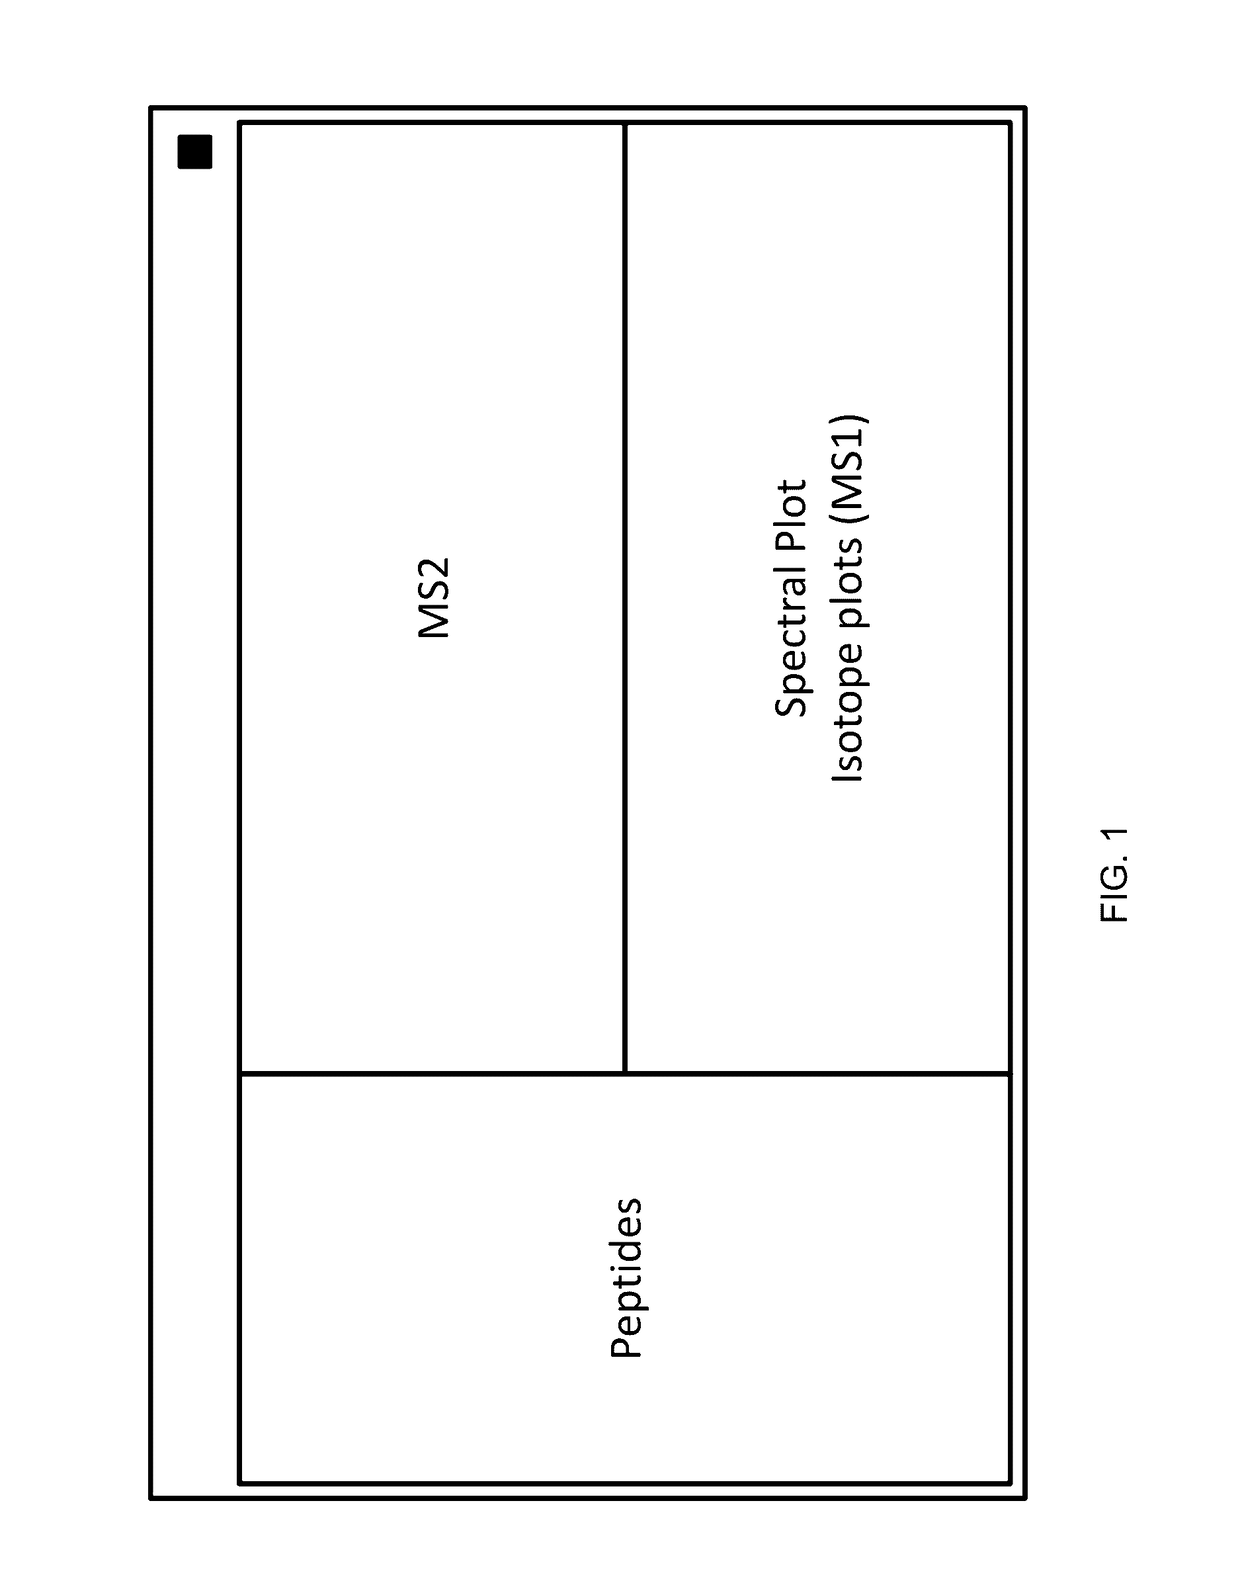
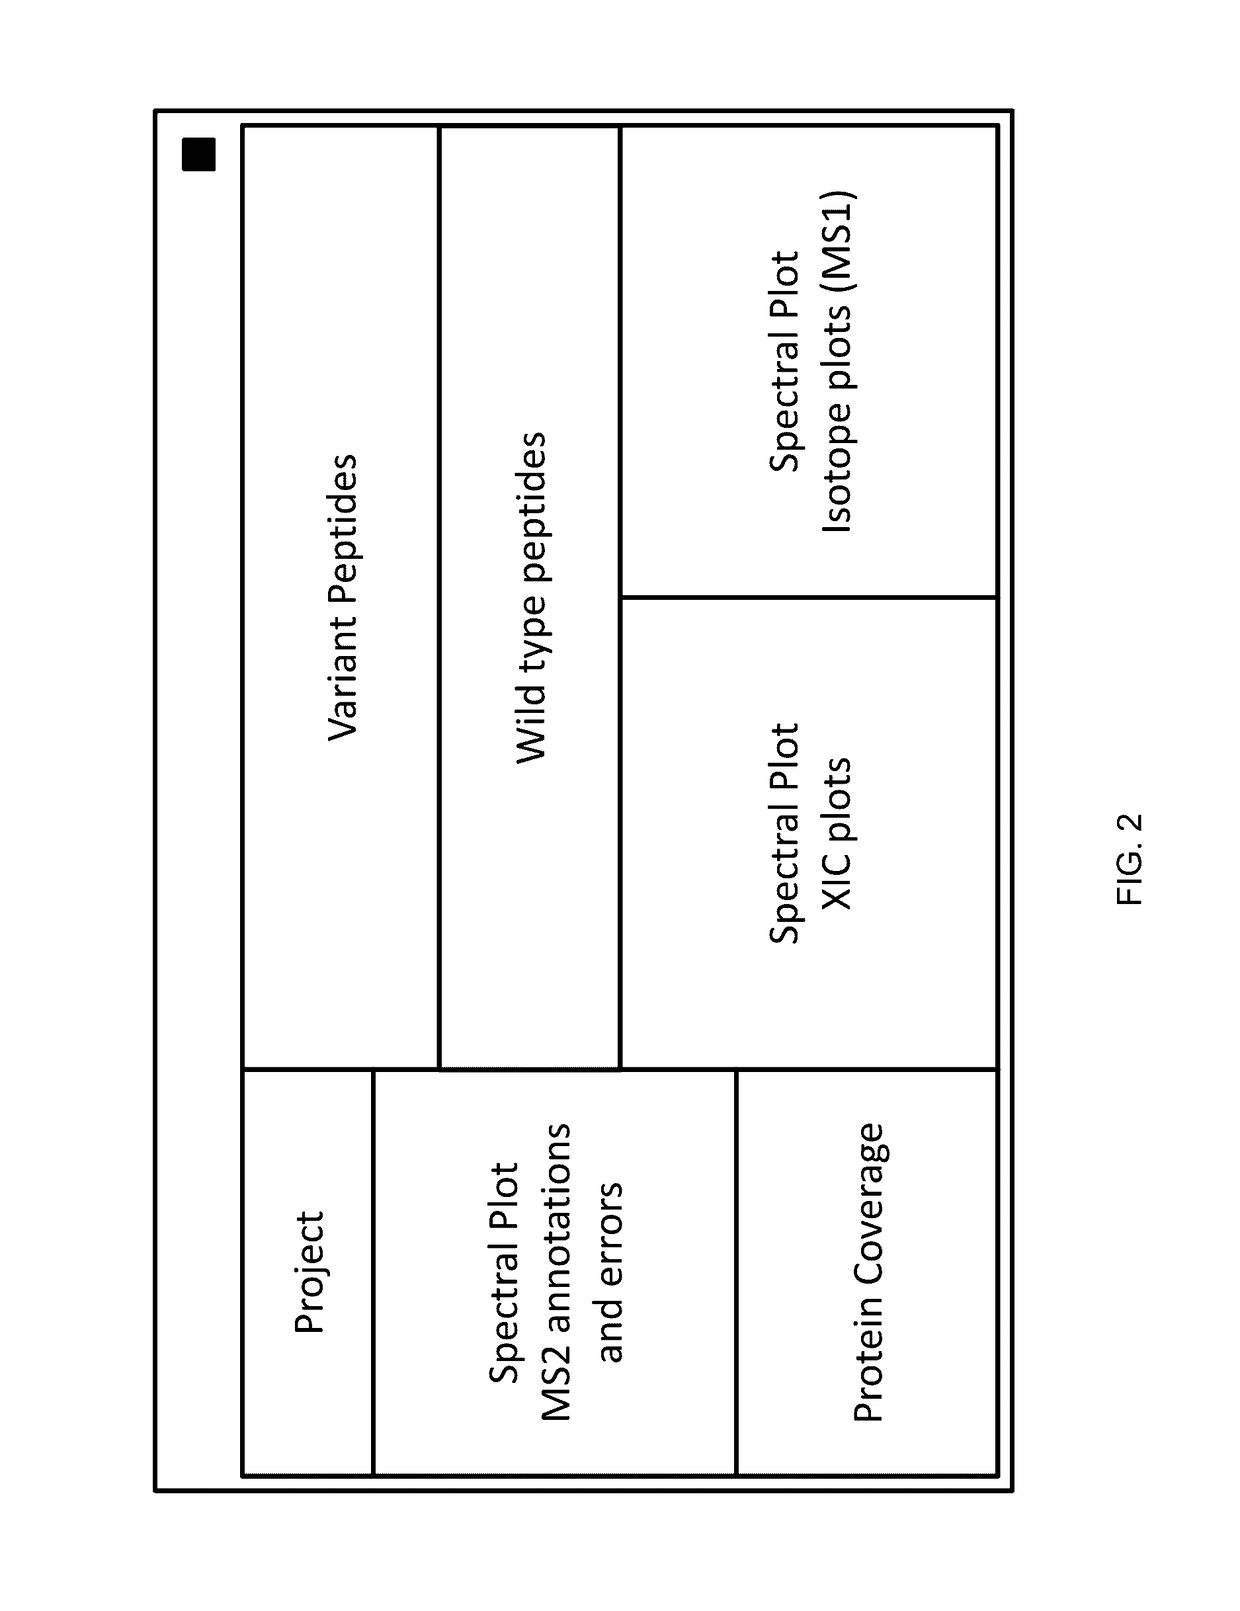
[0097]Valine to isoleucine or leucine is a common substitution. FIG. 6 illustrates the dashboard (showing MS2, MS1 and XIC spectra, and Variant Peptide View, Wildtype Peptide View), with a peptide having a putative Val substitution highlighted. FIG. 7 provides an unzoomed view of the MS2 spectra for wild type and variant. FIG. 8 zooms in on flanking peaks to local...


PUM


Abstract

This invention relates to graphical user-interactive displays for use in MS-based analysis of protein impurities, as well as methods and software for generating and using such. One aspect provides a user-interactive display comprising an extracted mass chromatogram (XIC), an MS1 spectrum and an MS2 spectrum, all simultaneously representing a user-selected peptide. Another aspect provides a user interactive display simultaneously presenting paired spectra (XIC, MS1 and/or MS2) for a variant peptide and its corresponding wildtype counterpart.

Description

I. GOVERNMENT LICENSE RIGHTS[0001]This application was made with government support under grant number R43 GM100634 awarded by the National Institutes of Health. The government has certain rights in the invention.II. FIELD[0002]This invention relates to graphical user-interactive displays for use in MS-based analysis of protein impurities, as well as methods and software for generating and using such.III. INTRODUCTION[0003]Due to the complexity of proteins and their biological production, characterization of protein pharmaceuticals (“biologics”) poses much more demanding analytical challenges than do small molecule drugs. Biologics are prone to production problems such as sequence variation, misfolding, variant glycosylation, and post-production degradation including aggregation and modifications such as oxidation and deamidation. These problems can lead to loss of safety and efficacy, so the biopharmaceutical industry would like to identify and quantify variant and degraded forms o...

Claims


Application Information

Patent Timeline
IPC IPC(8): H01J49/00G06T11/20H01J49/02
CPCH01J49/0036H01J49/02G06T11/206
Inventor BECKER, CHRISTOPHERBERN, MARSHALLKIL, YONG JOOKIM, MICHAEL TAEJONGZHANG, BOYAN
Owner PROTEIN METRICS LLC
Why Eureka
Try Eureka