Interactive, adaptive level-of-detail in 2.5D treemaps

a treemap and adaptive technology, applied in the field of interactive, adaptive level of detail in 2.5d treemaps, can solve the problems of reducing the pre-attentive perception qualities of color and height, occlusion of graphical elements, and increase rendering costs, so as to reduce the geometric complexity of the treemap, facilitate efficient identification of areas of interest, and reduce the visual clutter of the visual display

Inactive Publication Date: 2018-04-24
SEERENE GMBH
View PDF0 Cites 2 Cited by
  • Summary
  • Abstract
  • Description
  • Claims
  • Application Information

AI Technical Summary

Benefits of technology

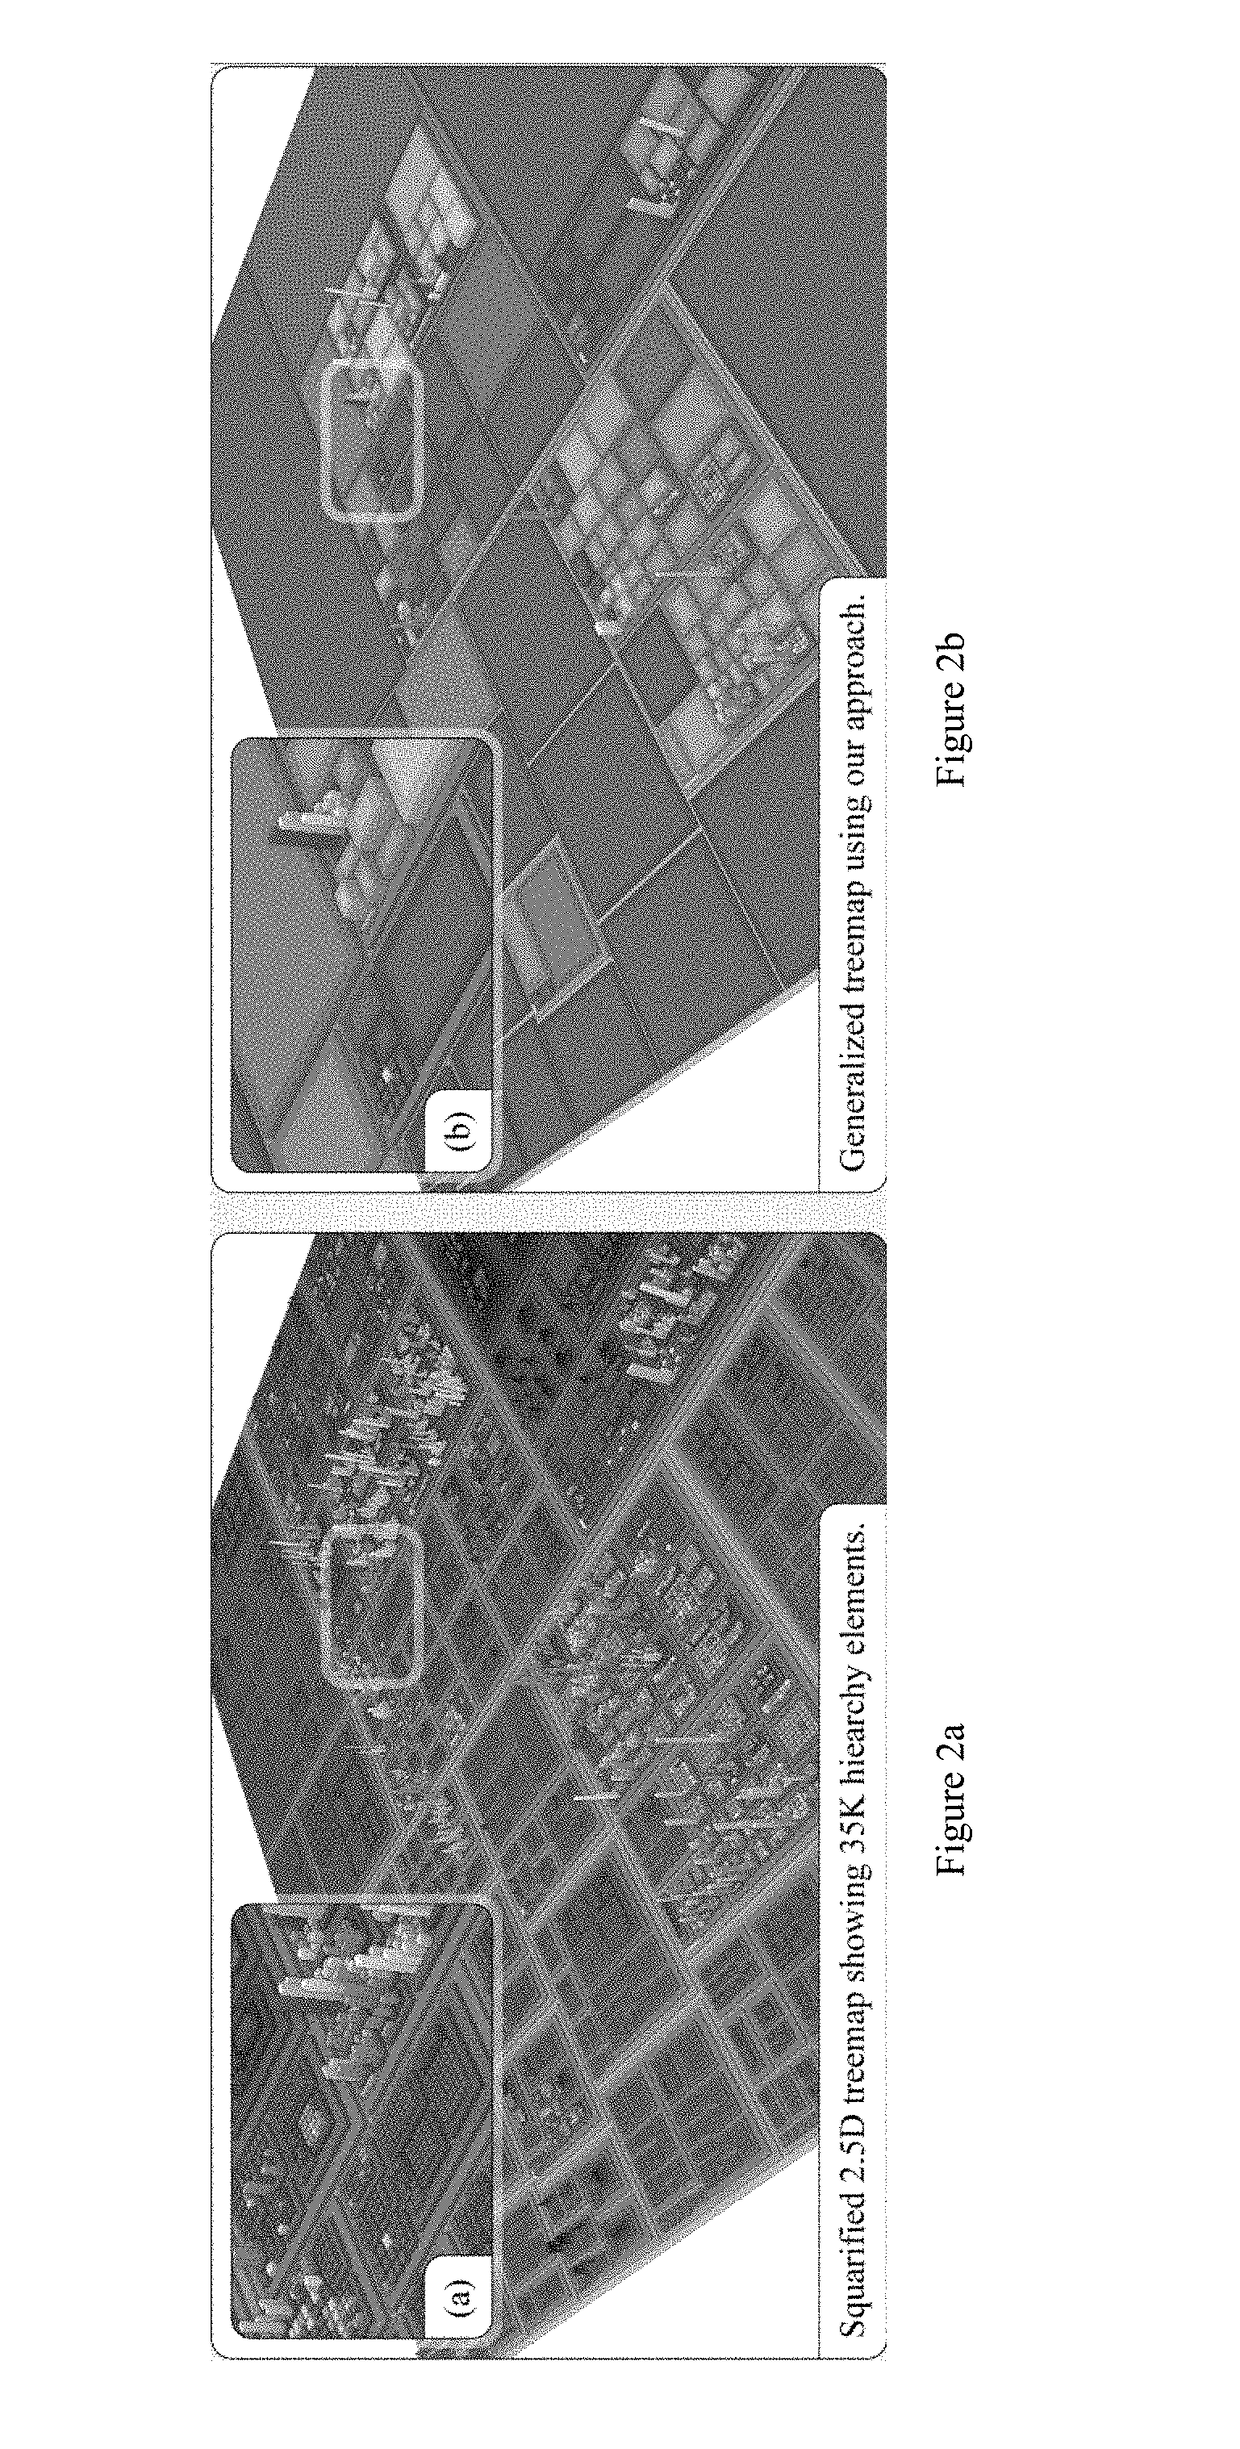
[0025]The aggregation approach described herein basically operates as follows. For an input set of important attributes, i.e., as a filtering result, the set of associated nodes is retrieved and used as baseline for bottom-up aggregation of all remaining nodes. For aggregated nodes, mapped attributes are accumulated resulting in aggregated cuboids with additional visual fidelity that allows preservation of important attributes while drastically reducing the treemap's geometric complexity.
[0026]Furthermore, the aggregation approach described herein enables the system to respond to user needs and interactions in real-time, to satisfy aggregation guidelines for hierarchical aggregation introduced by Elmqvist and Fekete, to reduce visual clutter of the visual display, and to allow for GPU-focused implementation. Most importantly, the invention facilitates efficient identification of areas-of-interest and increases processing efficiencies. For example, in addition to improving area-of-interest identification, the invention reduces cognitive load while maintaining most / all information and thus facilitates effective communication of important attributes by guiding a user's focus of attention.
[0027]In exemplary embodiments, interactive, adaptive aggregation in 2.5D treemaps facilitates informed decision making and optimizes, inter alia, the communication of quality aspects, development activity, as well as budget and resource planning for large software system projects.
[0028]The generalization approach described herein, though focusing on rectangular-based 2.5D treemaps, is applicable to treemaps that are based on inclusion. This comprises 2D, 2.5D, and 3D treemaps. The work of Schulz, Hadlak, and Schumann (SCHULZ H.-J., HADLAK S., SCHUMANN H.: The Design Space of Implicit Hierarchy Visualization: A Survey. IEEE Trans. Vis. Comput. Graph. 17, 4 (2011), pp. 393-411) enlists most existing treemap approaches and allows simple identification of visualization techniques that use inclusion and are 2D / 3D as shown in Table 1 of Schulz et al. Most of the scores suggested herein, however, are developed mainly for rectangular 2D and 2.5D treemaps. There might be other, more special, scores for non-rectangular treemaps or 3D treemaps that are not discussed herein but can be accounted for. These and other characteristics of the invention will be apparent from the following detailed description.

Problems solved by technology

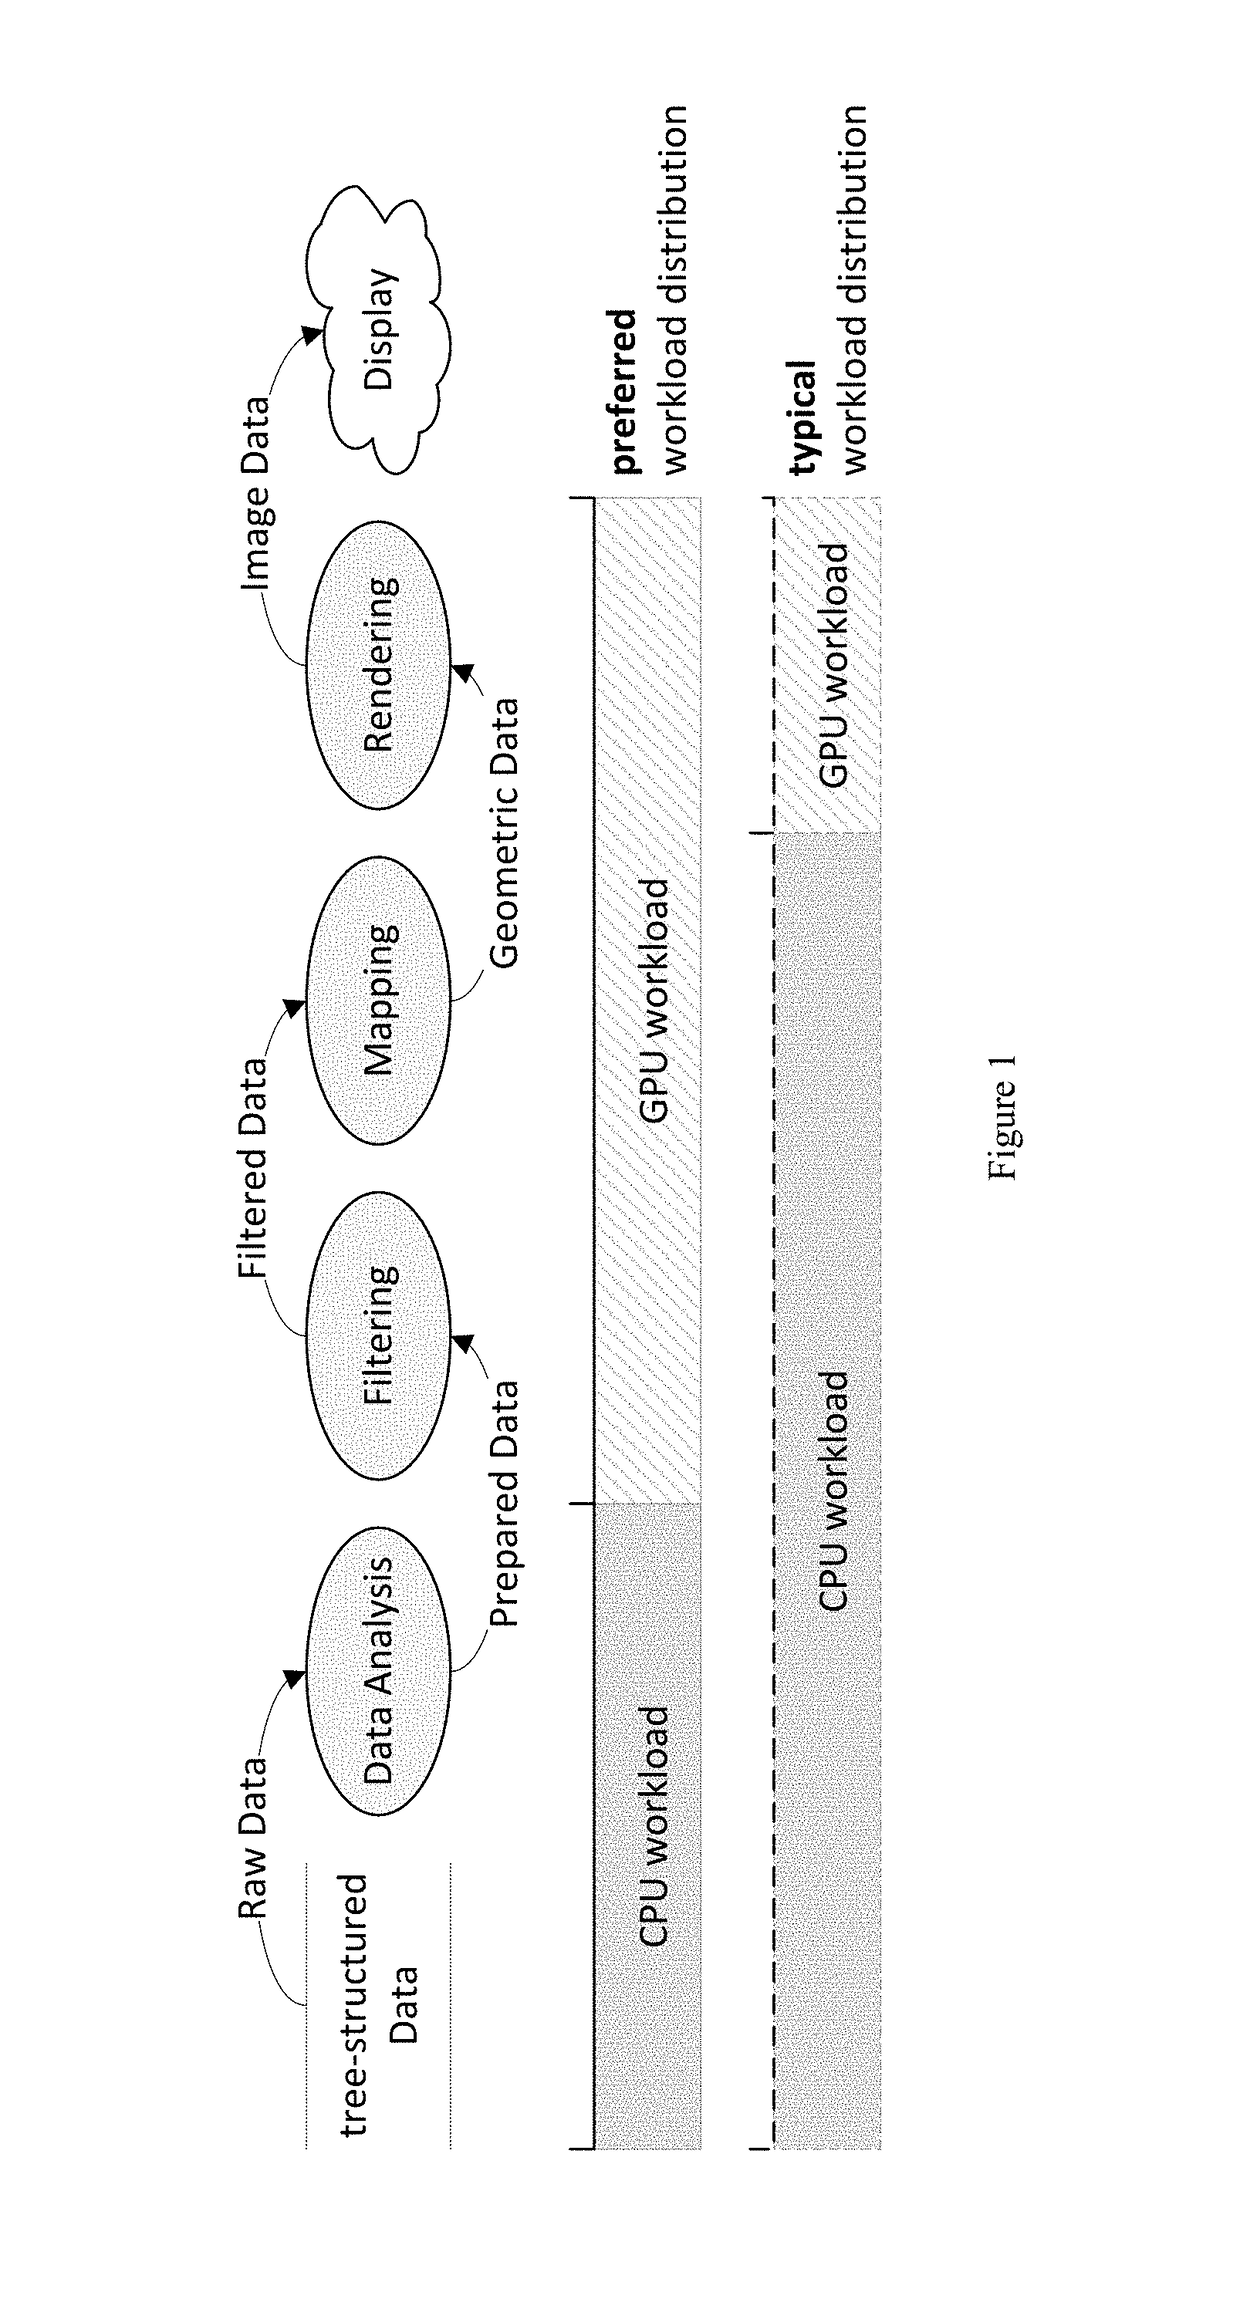
With the extension of 2D treemaps to the third dimension, several challenges that apply for the depiction of massive data sets are introduced, such as increased rendering costs, occlusion of graphical elements, supplementing margins (especially important for the distinction of parents and auxiliary for reducing occlusion), and the need for effective navigation techniques.
117-124) causes visual clutter that decreases the pre-attentive perception qualities of color and height as well as increases the cognitive load.
This approach, however, does not allow for strict dynamic aggregation (by design) since it requires computation intensive pre-processing and is focusing on geospatial data only, which, in contrast to abstract tree-structured data, has a natural gestalt.
Also, this computation intensive approach is quite slow and optimization is difficult since the geometry is quite complex.
The prior art, however, does not consider automated or adaptive level-of-detail control and is, as presented, limited to planar treemaps.
When depicting massive quantities of hierarchy elements (nodes) using treemaps, the common 1:1 mapping of nodes to blocks leads to the following mutually influential limitations: (1) high cognitive load for the user due to visual clutter; (2) insufficient visual representation of hierarchy elements and contextual information; and (3) decrease in rendering performance and responsiveness (provisioning and interactivity) due to an increasing scene complexity.
An equally complex geometry for remaining treemap areas (context) can be distracting and hindering in such tasks.
At worst, it facilitates unintentional, misguided and wrong decision making due to unsighted information.
Within the context of software engineering, for example, this can easily cause financial as well as structural damage to a company as well as its contractors and subcontractors / partners (e.g., due to missing defect prevention, improper architecture changes, or third party acquisitions).

Method used


Image

  • Interactive, adaptive level-of-detail in 2.5D treemaps
  • Interactive, adaptive level-of-detail in 2.5D treemaps
  • Interactive, adaptive level-of-detail in 2.5D treemaps

Examples


embodiments

[0104]Within all embodiments, the methods and apparatus disclosed herein allow for more effective communication of and interaction with the relevant information, due to a reduction of the image data complexity for the visual display. Since the resulting depictions enable a varying local level-of-detail and level-of-abstraction they enable to guide an observer's attention towards regions-of-interest as well as individual nodes-of-interest within any displayed context. With it, the depicted information can be interactively and dynamically emphasized as well as attenuated based on its relevance at arbitrary (available) information resolution. Furthermore, the depictions can be visually adjusted for arbitrary image resolutions (based on the intended integration, e.g., small overview / thumbnail within a dashboard vs. exclusive display at max resolution), controlled by means of various user-interactions (e.g., eye tracking), and almost always improve rendering performance due to the decrea...


PUM


Abstract

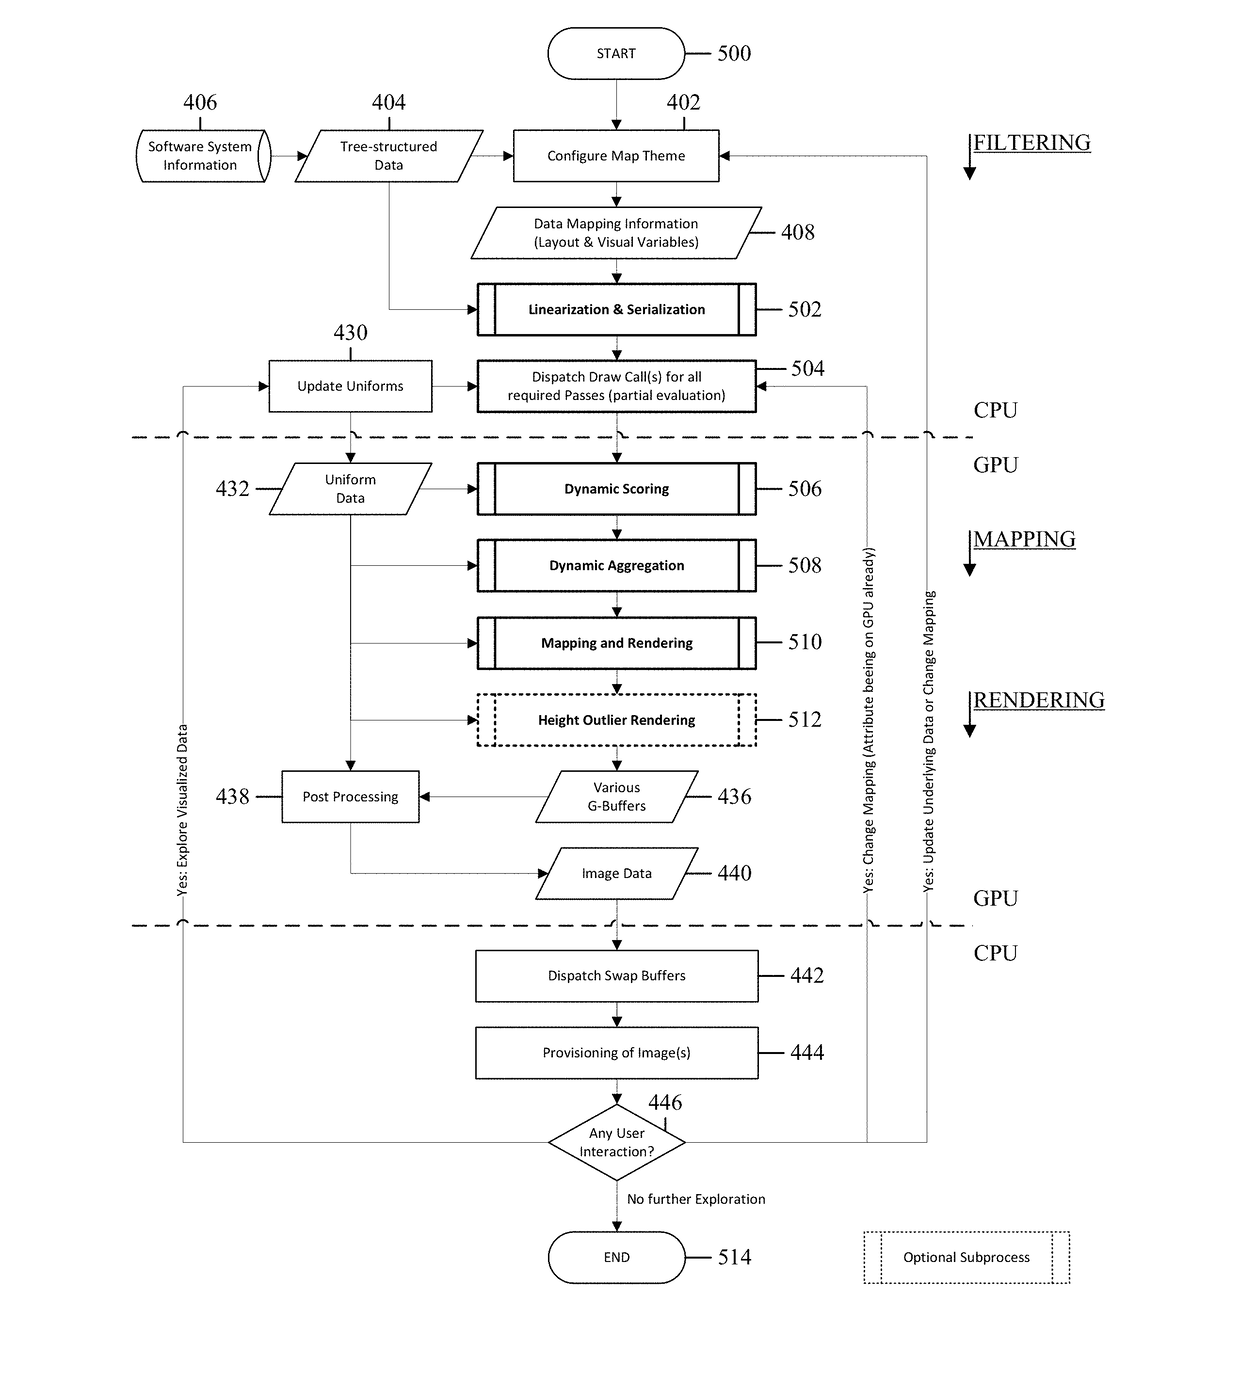
An aggregation approach allows for a dynamic, interactive, adaptive level-of-detail for 2D, 2.5D, and 3D treemaps for visualization of complex information. For example, the 2.5D treemap visualization concept is extended by providing adaptive identification of aggregates by means of an interactive node scoring approach based on contextual relevance and various other task, interaction, visibility, and / or performance specific criteria. For the resulting mapping and rendering, a per-frame aggregation of blocks and accumulation of those attributes mapped to visual variables (context) is described. Since every embodiment is also targeted for dynamic, interactive visual display of 2.5D treemaps, the rendering is designed to be capable for execution in real-time. Visual preservation of important information is conveyed by hierarchy elements and their mapped attributes (nodes-of-interest) as well as compliance to known aggregation guidelines including visualization of aggregated color and height information, visualization of aggregates that are discernible from non-aggregates, and visualization of outliers within aggregates. Applications include visualization of software maps, business intelligence data, file hierarchies for storage devices, and the like.

Description

TECHNICAL FIELD[0001]The invention described herein relates generally to processes and systems and related algorithms for providing improved information visualization on a display and, in particular, the processes and system and related algorithms for providing interactive and adaptive level-of-detail in 2.5D treemaps for presentation of non-spatial data using, for example, cartographic visualization techniques.BACKGROUND[0002]Interactive 2.5D treemaps serve as an effective tool for the visualization of attributed hierarchies, enabling exploration of non-spatial, multi-variate, hierarchical data. 2.5D treemaps derive a spatial reference from the data's hierarchy to create a reference geometry and to map the data attributes (depended variables) to visual variables of graphical elements (e.g., size, height, and color).[0003]2D and 2.5D treemaps are applied in various research and industry applications to provide a comprehensive and consistent gestalt for communication and visual analy...

Claims


Application Information

Patent Timeline
Patent Type & Authority Patents(United States)
IPC IPC(8): G06T11/20G06T15/00G06T1/20
CPCG06T11/206G06T15/005G06T1/20G06T2210/52G06T17/005G06T19/00
Inventor LIMBERGER, DANIEL
Owner SEERENE GMBH
Why Eureka
Try Eureka