Method and device for digital signal processor executing debugging and enquiry command

A technology for querying commands and digital signals, which is applied in the debugging field of embedded systems, can solve problems such as the inability to apply debugging functions, issue debugging query commands and execution functions, and fail to support network communication protocol stacks, so as to achieve effective debugging methods and means Practical, diverse debugging methods and means, and more effective debugging methods and means

Inactive Publication Date: 2008-06-04
DATANG MOBILE COMM EQUIP CO LTD
View PDF0 Cites 7 Cited by
  • Summary
  • Abstract
  • Description
  • Claims
  • Application Information

AI Technical Summary

Problems solved by technology

[0003] The above widely used debugging methods have the following disadvantages: because they cannot be connected to the network, they can only be debugged locally, and cannot be remotely debugged through the network; the emulator is expensive, and an emulator can usually only debug a piece of DSP, or the same series of DSP, it cannot debug multiple DSPs at the same time or several DSPs connected together through the JATG interface chain on one board, and cannot support one emulator to debug DSPs on multiple boards at the same time; because the DSP cannot be connected to the test line. Connect to the emulator for debugging, so it is only applicable to the offline debugging stage, not to the integration testing stage; because the existing debugging technology does not have the function of debugging agent, it cannot dynamically issue debugging query commands and execute function functions; only variables can be queried Or the value of the memory, it is impossible to realize the automatic analysis of the system running status; only to stop the DSP running at the break point to observe the value of the variable, this debugging method will interfere with the normal operation of the program
[0005] 1. Since many DSPs do not have network port peripherals, network debugging cannot be performed;
[0006] 2. It is not possible to debug multiple DSPs at the same time;
[0007] 3. Due to the limited memory resources of the DSP, it cannot support a huge network communication protocol stack, so many debugging functions cannot be applied, and the system running status cannot be automatically debugged

Method used


Image

  • Method and device for digital signal processor executing debugging and enquiry command
  • Method and device for digital signal processor executing debugging and enquiry command
  • Method and device for digital signal processor executing debugging and enquiry command

Examples


Embodiment 1

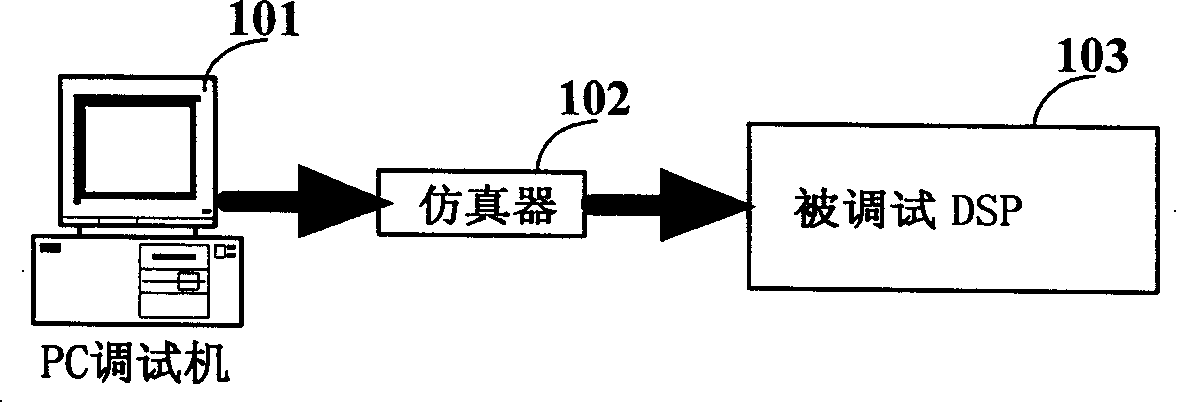
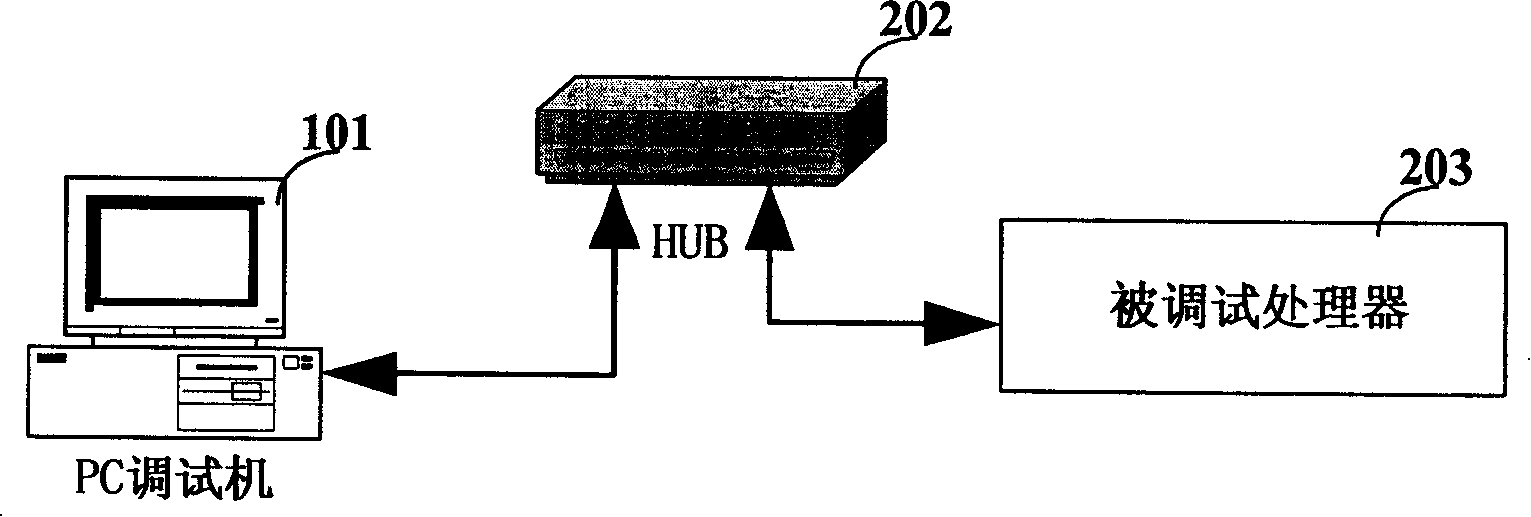
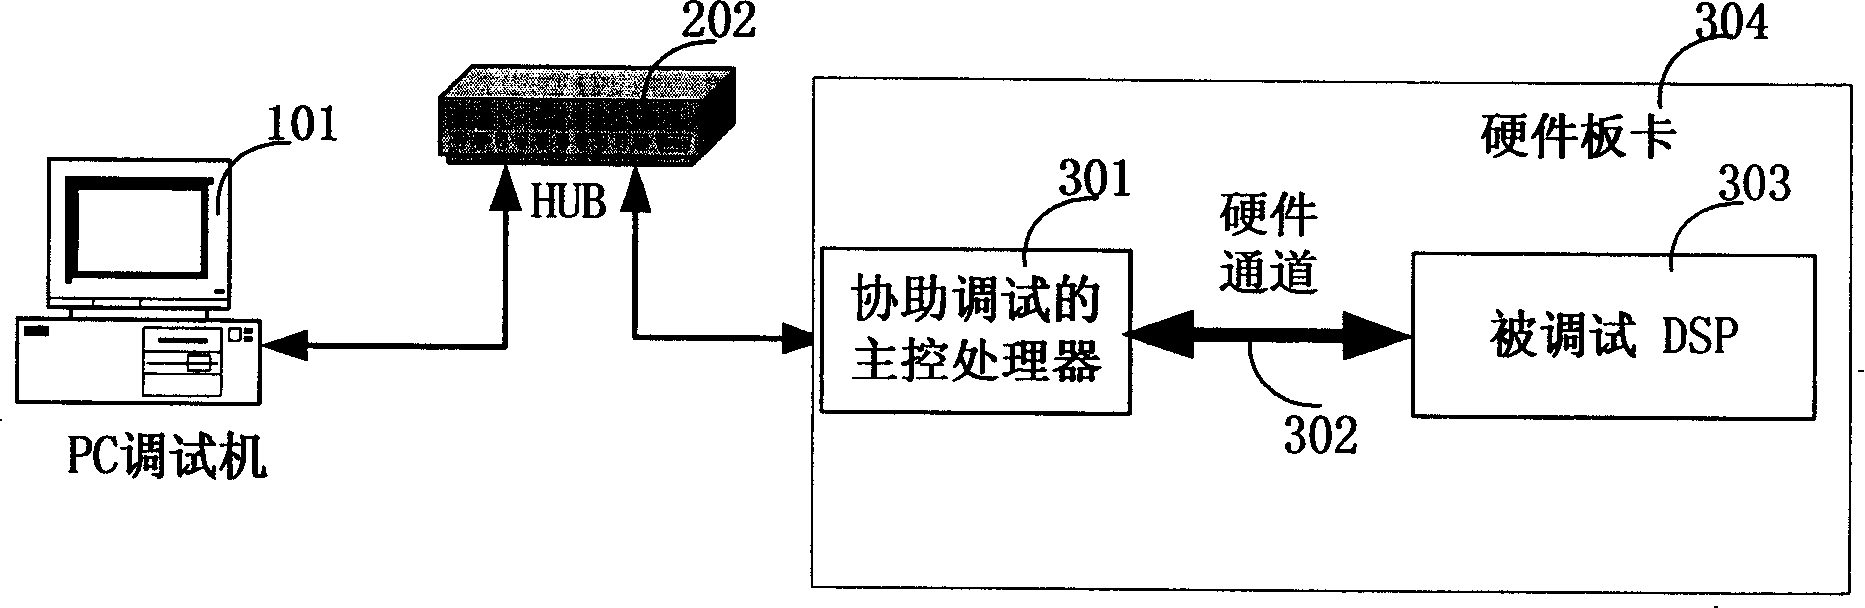
[0038] The system structure of the whole network debugging method is as follows: image 3 As shown, it can be divided into a PC debugging machine 101, a networking device 202 connected to the network, such as a HUB or other router, and a hardware board 304, wherein the hardware board 304 further includes a main control processor 301 that assists in debugging, and the hardware Channel 302 and DSP303 being debugged. The hardware channel 302 can be a data serial interface (DSI, Data Serial Interface), a host parallel interface (HPI, Host Parallel Interface) and other types of buses or other possible hardware channels; wherein, DSI is used for long-distance signal transmission, and HPI is used for Complete the data exchange between the host computer and DSP or between DSP and DSP.

[0039] A debugging agent is set on the DSP, and the debugging agent can be a software or a hardware module, which is specifically responsible for running the debugging query command to avoid interferi...

Embodiment 2

[0052] In this way, the hardware setting of the whole debugging system is the same as that of Embodiment 1, but the main control processor directly accesses the memory of the DSP, so as to know the running information of the DSP.

[0053] In step 501, the PC debugger sends a command for debugging the DSP to the main control processor through the network. The debugging query command includes specific control instructions for the DSP to run, various variables to be queried, and calculation formulas to be calculated.

[0054] Step 502, analyze the MAP file corresponding to the executable file on the DSP on the main control processor or on the PC debugging machine, obtain the address of any specified variable in the internal memory of the DSP, and the described MAP file is a mapping file, and it is in text The method records the addresses of all output variables in the executable file on the DSP memory; analyze the MAP file corresponding to the executable file on the DSP on the mai...


PUM


Abstract

A method for executing debug enquiry command of a digital signal processor (DSP) is used in a debug system comprising a debug machine and a DSP. The invention is characterized in that: the DSP side is provided with a main control processor; the debug machine transmits the debug enquiry command of the DSP to the main control processor through a network; the main control processor acquires the result of the debug enquiry command from the DSP and returns the result to the debug machine. Meanwhile, the invention also discloses a device for executing debug enquiry command of a DSP which is used in a debug system comprising a debug machine and a DSP, wherein, the device comprises a main control processor and a hardware channel; the main control processor, which is arranged at the DSP side, receives the debug enquiry command of the DSP send by the debug machine and acquires the result of the debug enquiry command from the DSP; moreover, the main control processor communicates with the debugged DSP through the hardware channel.

Description

technical field [0001] The invention relates to debugging of an embedded system, in particular to a method and a device for executing a debugging query command for a digital signal processor (DSP, Digital Signal Processor). Background technique [0002] In recent years, DSP has been more and more widely used in the development of embedded systems because of its efficient signal processing ability and computing ability. In the prior art, the software debugging that carries out on DSP usually adopts the method that connects special emulator and downloads debugging code to the DSP of target board card and debugs, as figure 1 As shown, it is a schematic diagram of the emulator debugging method in the prior art, the connection between the PC debugger 101 and the emulator 102, and the connection between the emulator 102 and the debugged processor 103 are all non-network connections, such as the PC debugger 101 and the emulator 102 The emulator 102 is connected with the debugged p...

Claims


Application Information

Patent Timeline
IPC IPC(8): G06F11/36H04L12/00
Inventor 蒋石竹文志刚
Owner DATANG MOBILE COMM EQUIP CO LTD
Why Eureka
Try Eureka