Environmental quality evaluation method based on rough set-RBF neural network
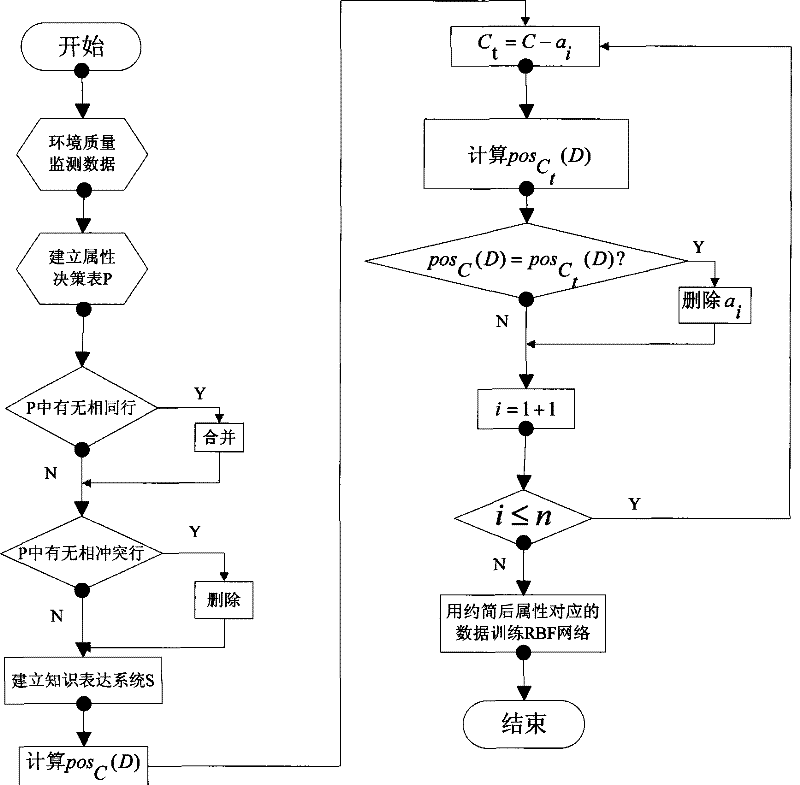
A technology of environmental quality and neural network, applied in the field of environmental quality evaluation using rough set-RBF neural network composite technology, can solve the problems of reduced network generalization ability, redundant training samples, redundant network structure, etc., to avoid falling into The effect of local minimum, good convergence and strong adaptability
- Summary
- Abstract
- Description
- Claims
- Application Information
AI Technical Summary
Problems solved by technology
Method used
Image
Examples
Embodiment 1
[0056] Example 1: Evaluation of the water environment quality of a certain water system in the Yangtze River in 2002
[0057] 1. Determine the environmental quality evaluation factors
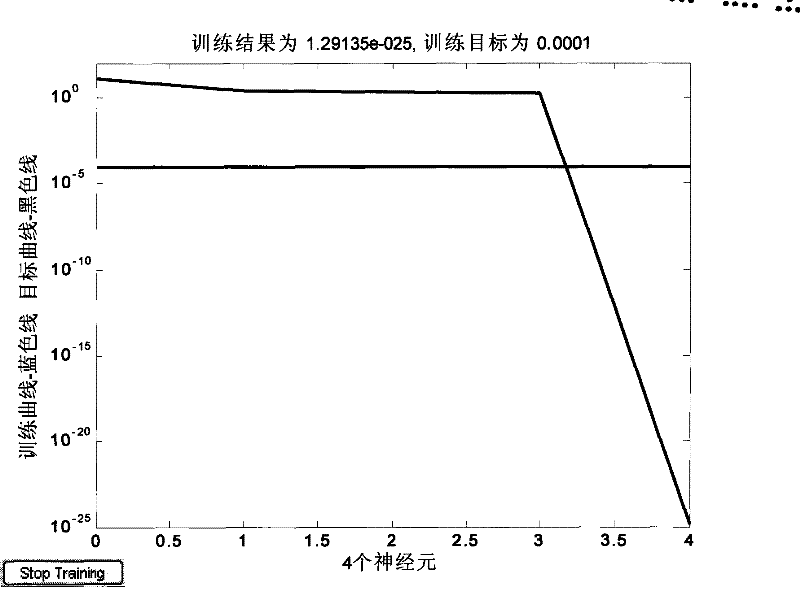
[0058] Select the monitoring data of a certain water system in the Yangtze River in 2002 as shown in Table 1, including five evaluation factors: total nitrogen (TN), ammonia nitrogen (NH 3 -N), total phosphorus (TP), permanganate index (COD Mn ) and total lead, as well as the evaluation results of the comprehensive index method of monitoring data.
[0059] Table 1: Water Environment Quality Monitoring Data
[0060] Sampling point TN NH 3 -N TP COD Mn total lead Comprehensive index method evaluation results 1 0.897 0.35 0.11 2.4 0.036 III 2 0.952 0.29 0.08 2.1 0.037 III 3 1.736 0.32 0.09 2.3 0.038 IV 4
5 0.893
0.744 0.31
0.39 0.07
0.08 2.6
2.1 0.034
0.031 III
III 6 0.787 0.42 0.08 2.4 0.031 III ...
Embodiment 2
[0098] Example 2: Evaluation of Air Environment Quality in Xi'an City, Shaanxi Province
[0099] 1. Determine the environmental quality evaluation factors
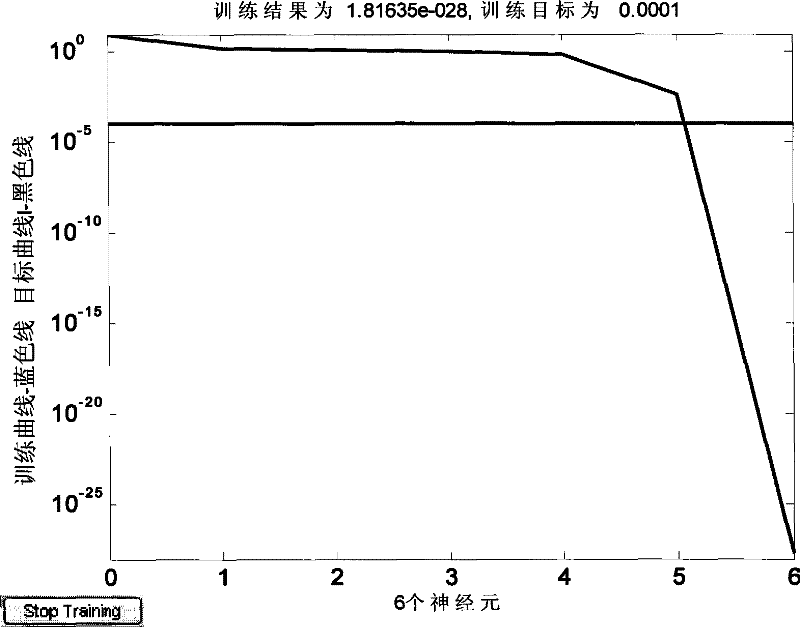
[0100] The monitoring data of the air environment in Xi’an City, Shaanxi Province in 2006 are selected as shown in Table 8, including 7 evaluation factors: total suspended particulate matter (TSP), sulfur dioxide (SO 2 ), nitrogen oxides (NO X ), nitrogen dioxide (NO 2 ), floating dust (PM 10 ), carbon monoxide (CO) and ozone (O 3 ), in addition to the comprehensive index method evaluation results of monitoring data.
[0101] Table 8: Air Environment Quality Monitoring Data
[0102] Sampling point TSP SO 2 NO X NO 2 PM 10 CO O 3 Comprehensive index method evaluation results 1 0.423 0.110 0.025 0.046 0.296 2.029 0.068 III2 2 0.409 0.126 0.026 0.049 0.286 1.961 0.065 III2 3 0.446 0.151 0.028 0.054 0.312 2.139 0.071 III2 4 0.491 0.152 0.033 0.09...
PUM
 Abstract
Description
Claims
Application Information
 - R&D
- Intellectual Property
- Life Sciences
- Materials
- Tech Scout
- Unparalleled Data Quality
- Higher Quality Content
- 60% Fewer Hallucinations
Browse by: Latest US Patents, China's latest patents, Technical Efficacy Thesaurus, Application Domain, Technology Topic, Popular Technical Reports.
© 2025 PatSnap. All rights reserved.Legal|Privacy policy|Modern Slavery Act Transparency Statement|Sitemap|About US| Contact US: help@patsnap.com


