Power distribution management information graphic system

A graphics system and production management technology, applied in the direction of digital data processing, data processing applications, special data processing applications, etc. Timely and other issues to improve immediacy and reliability, improve work efficiency and emergency capabilities, and achieve scientific results

Inactive Publication Date: 2009-08-05
杨志华
View PDF0 Cites 35 Cited by
  • Summary
  • Abstract
  • Description
  • Claims
  • Application Information

AI Technical Summary

Problems solved by technology

A change in one chart will cause other charts to change accordingly, and the existing software often cannot automatically carry out this chain reaction, and needs to be handled by people one by one, which not only increases the burden on manpower, but also is di

Method used


Image

  • Power distribution management information graphic system
  • Power distribution management information graphic system
  • Power distribution management information graphic system

Examples


Embodiment Construction

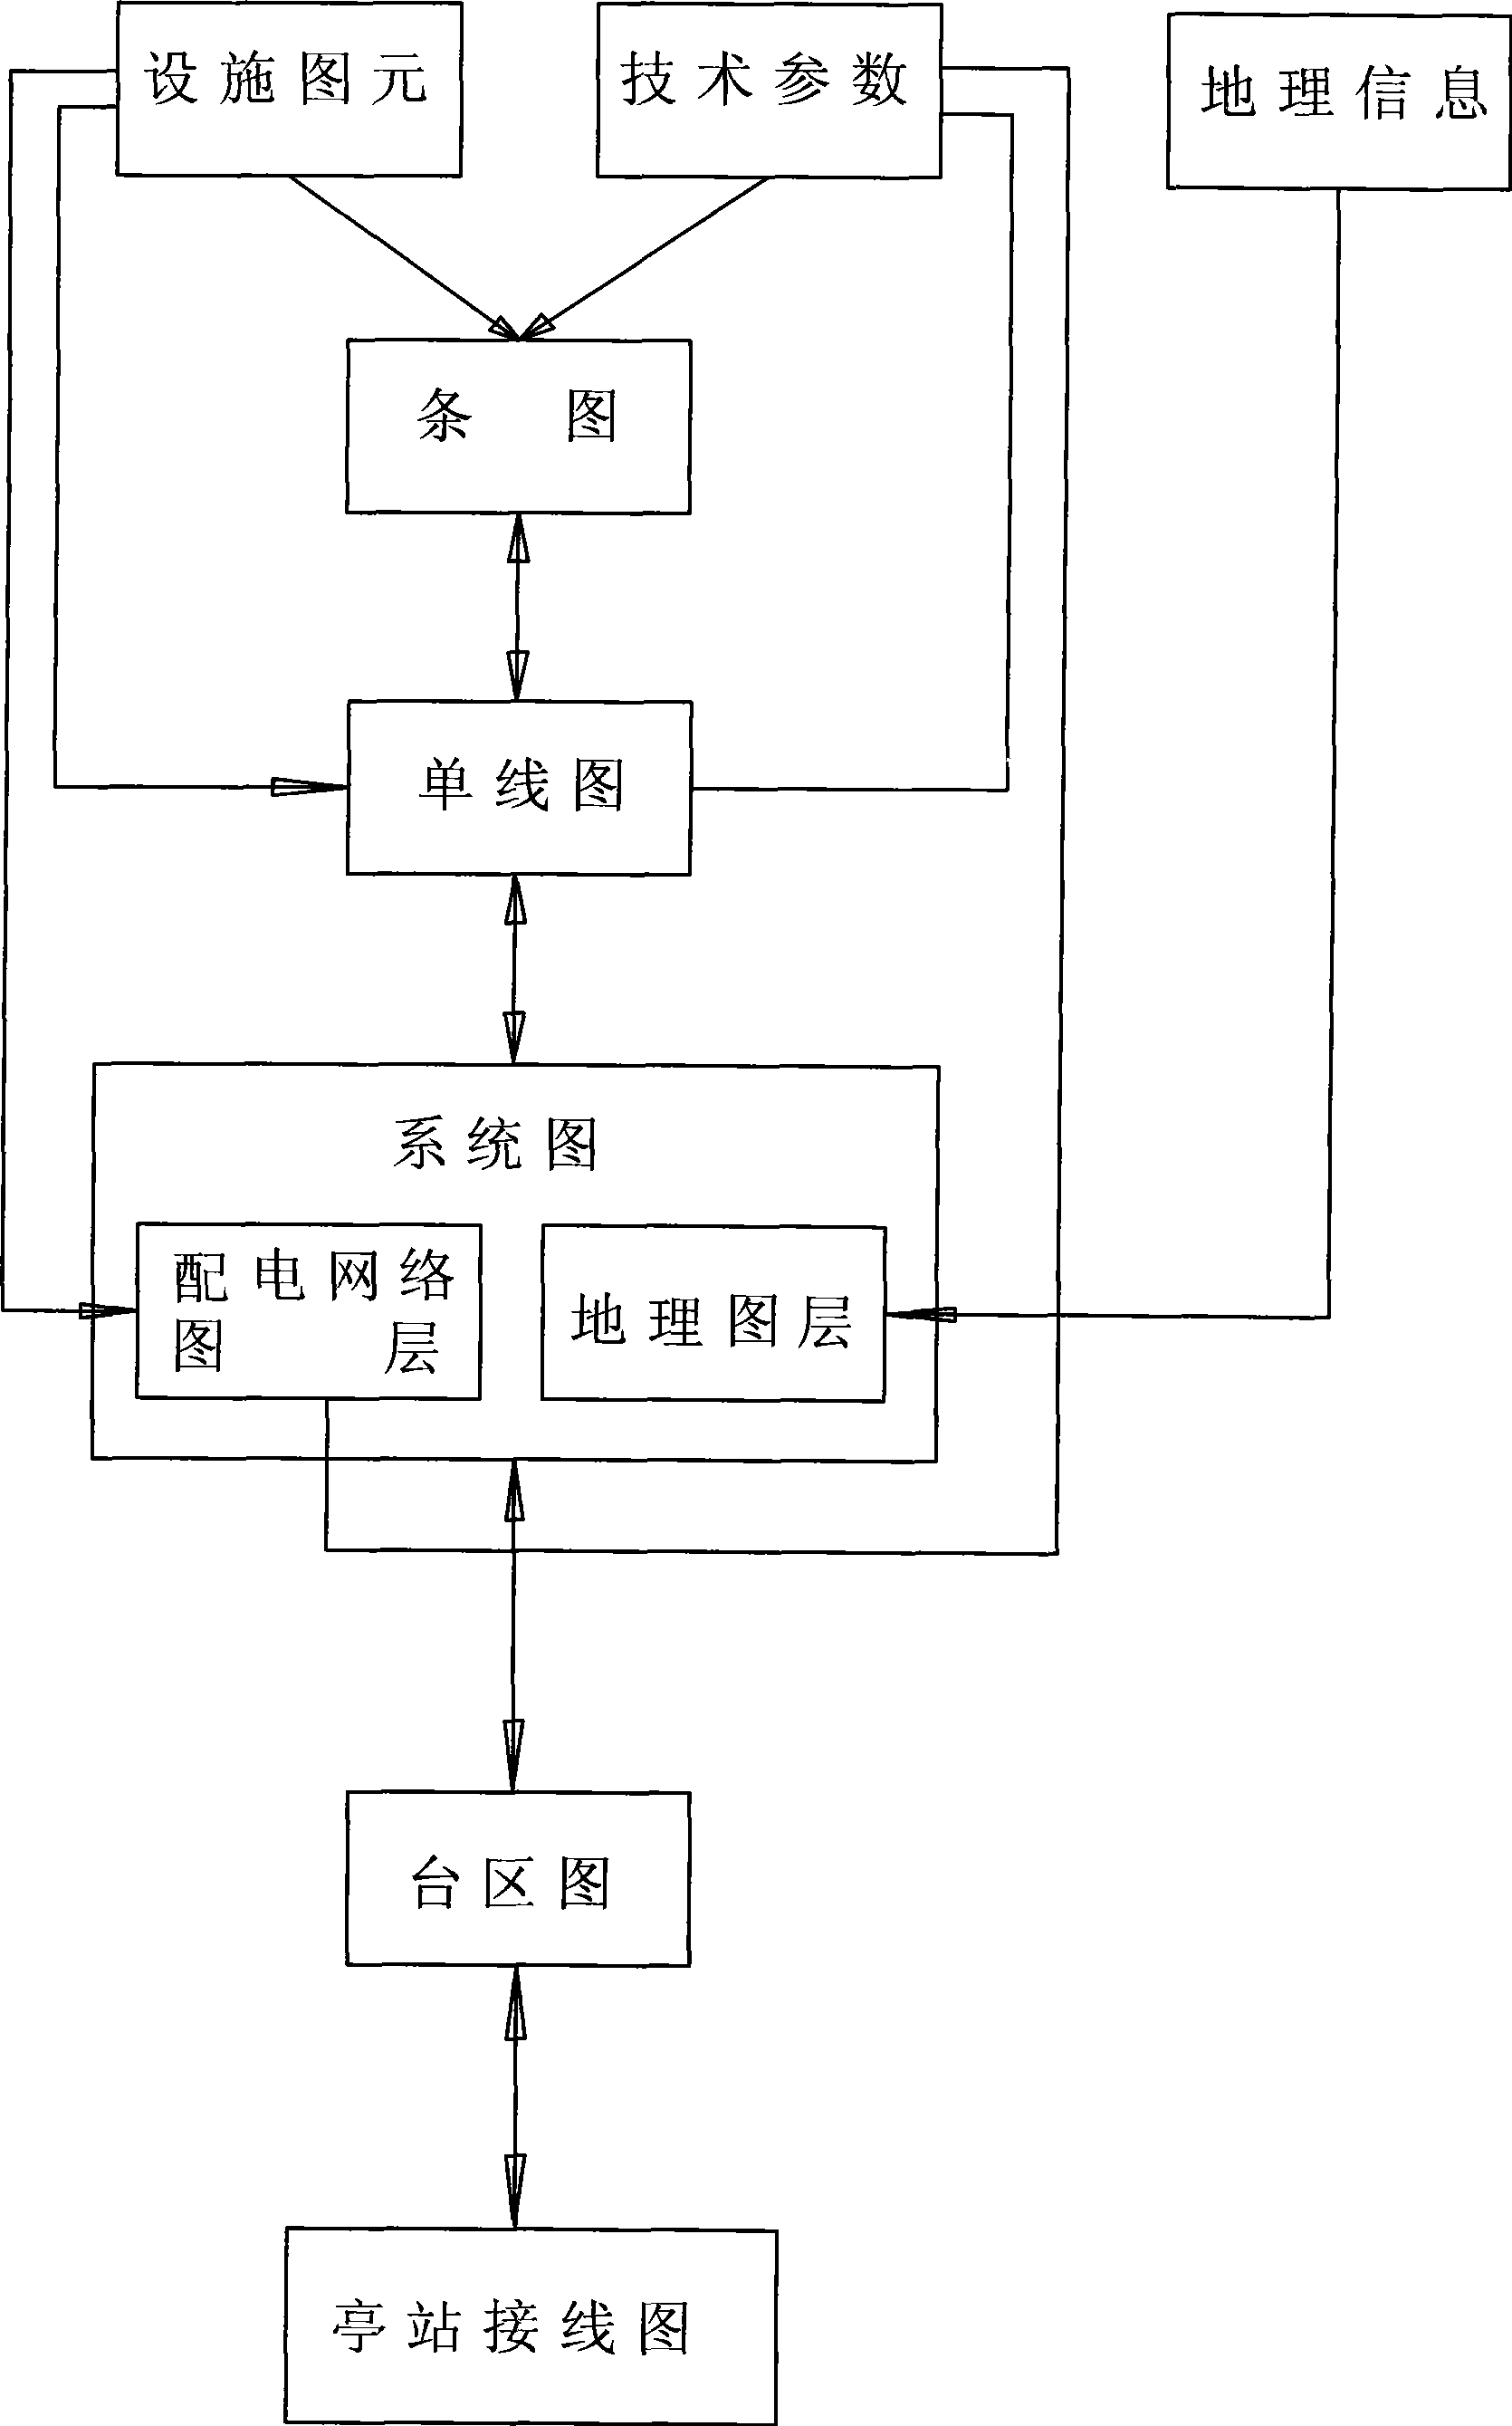
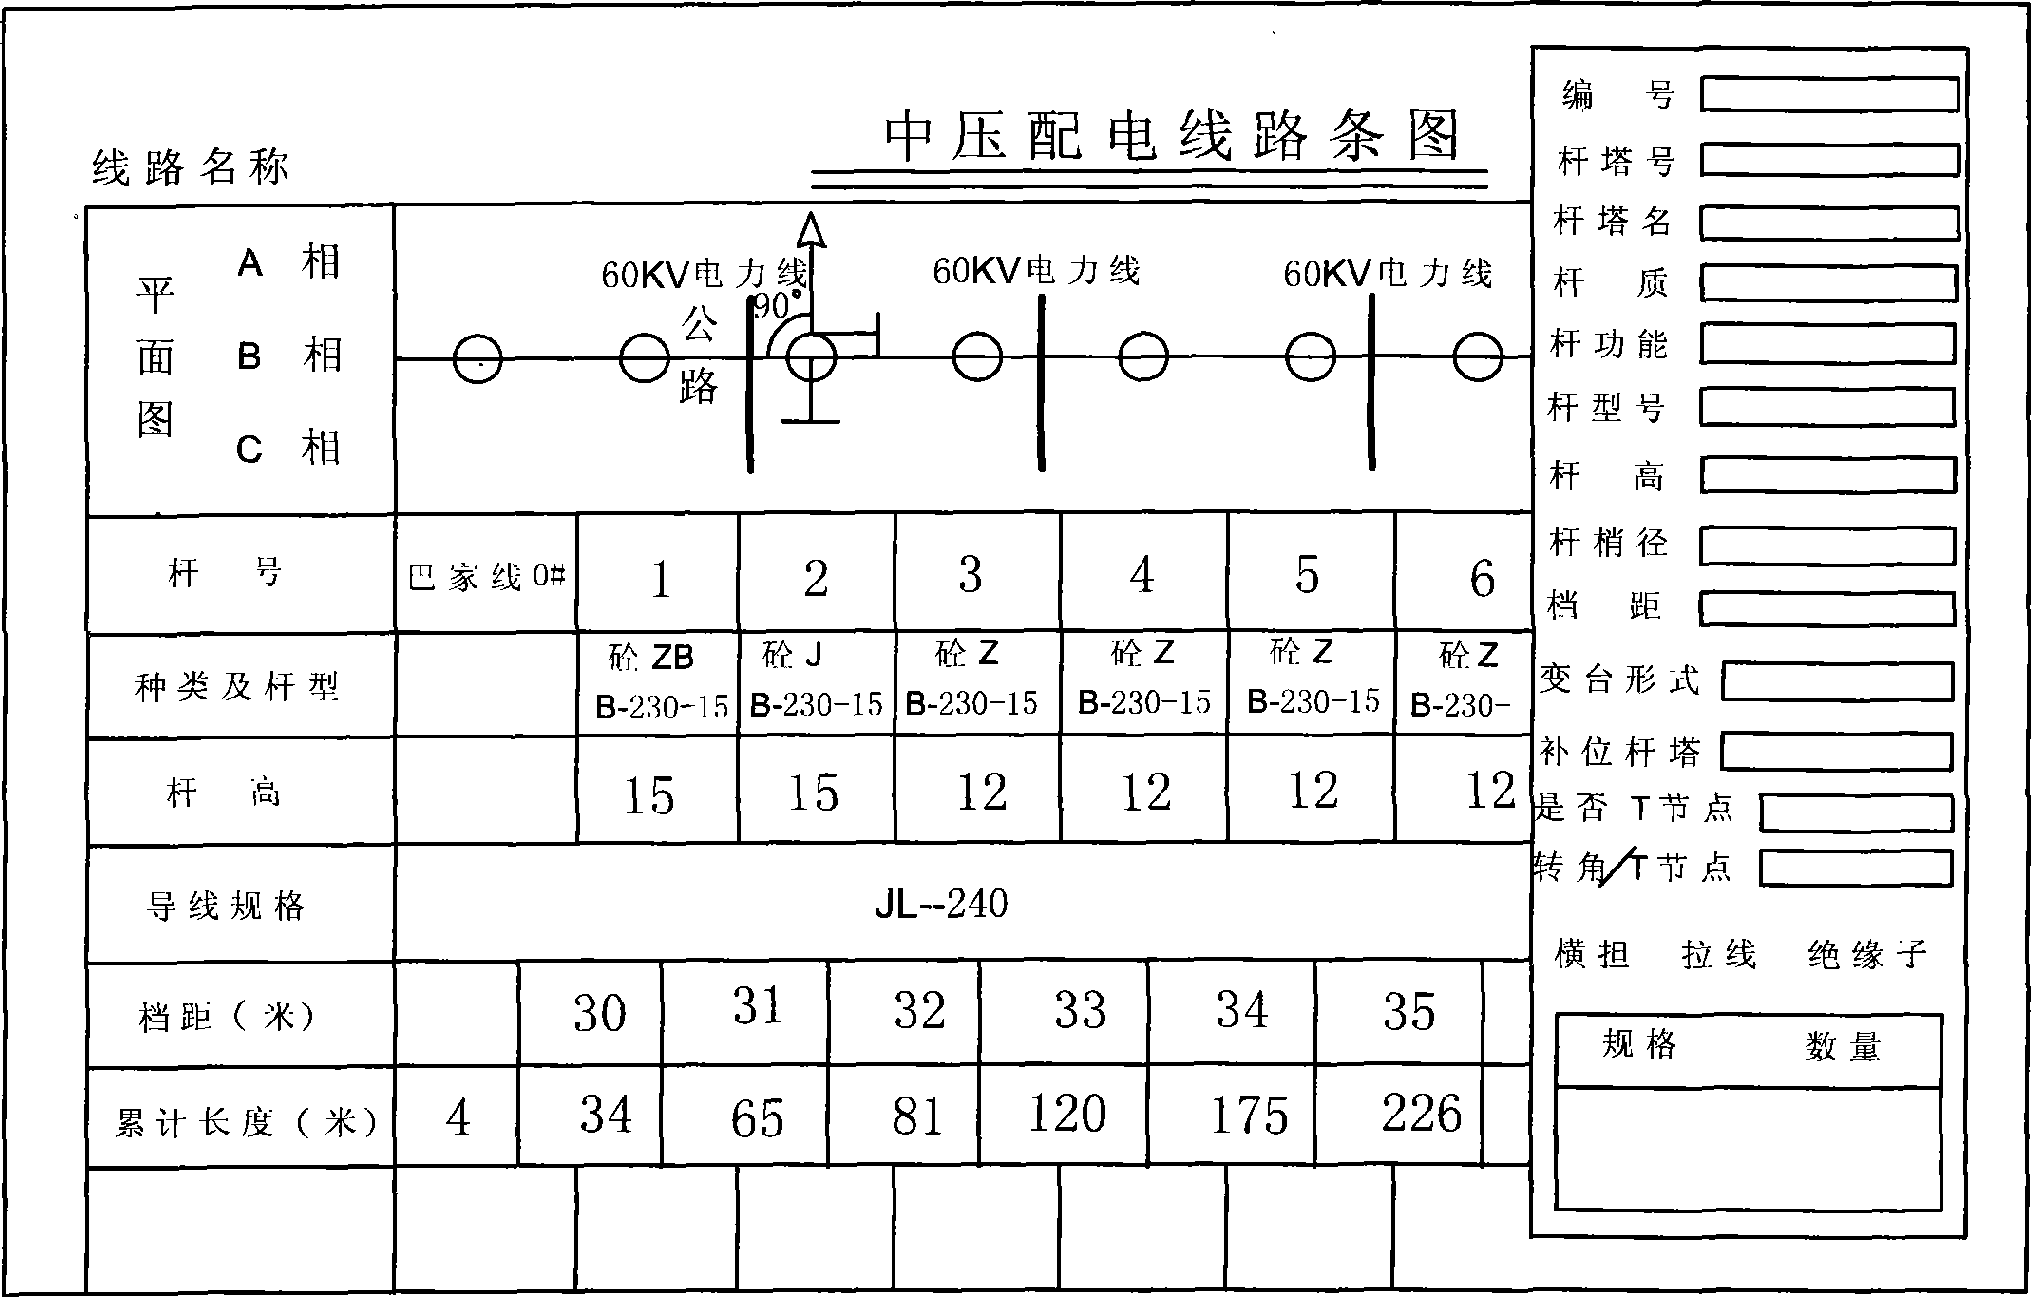
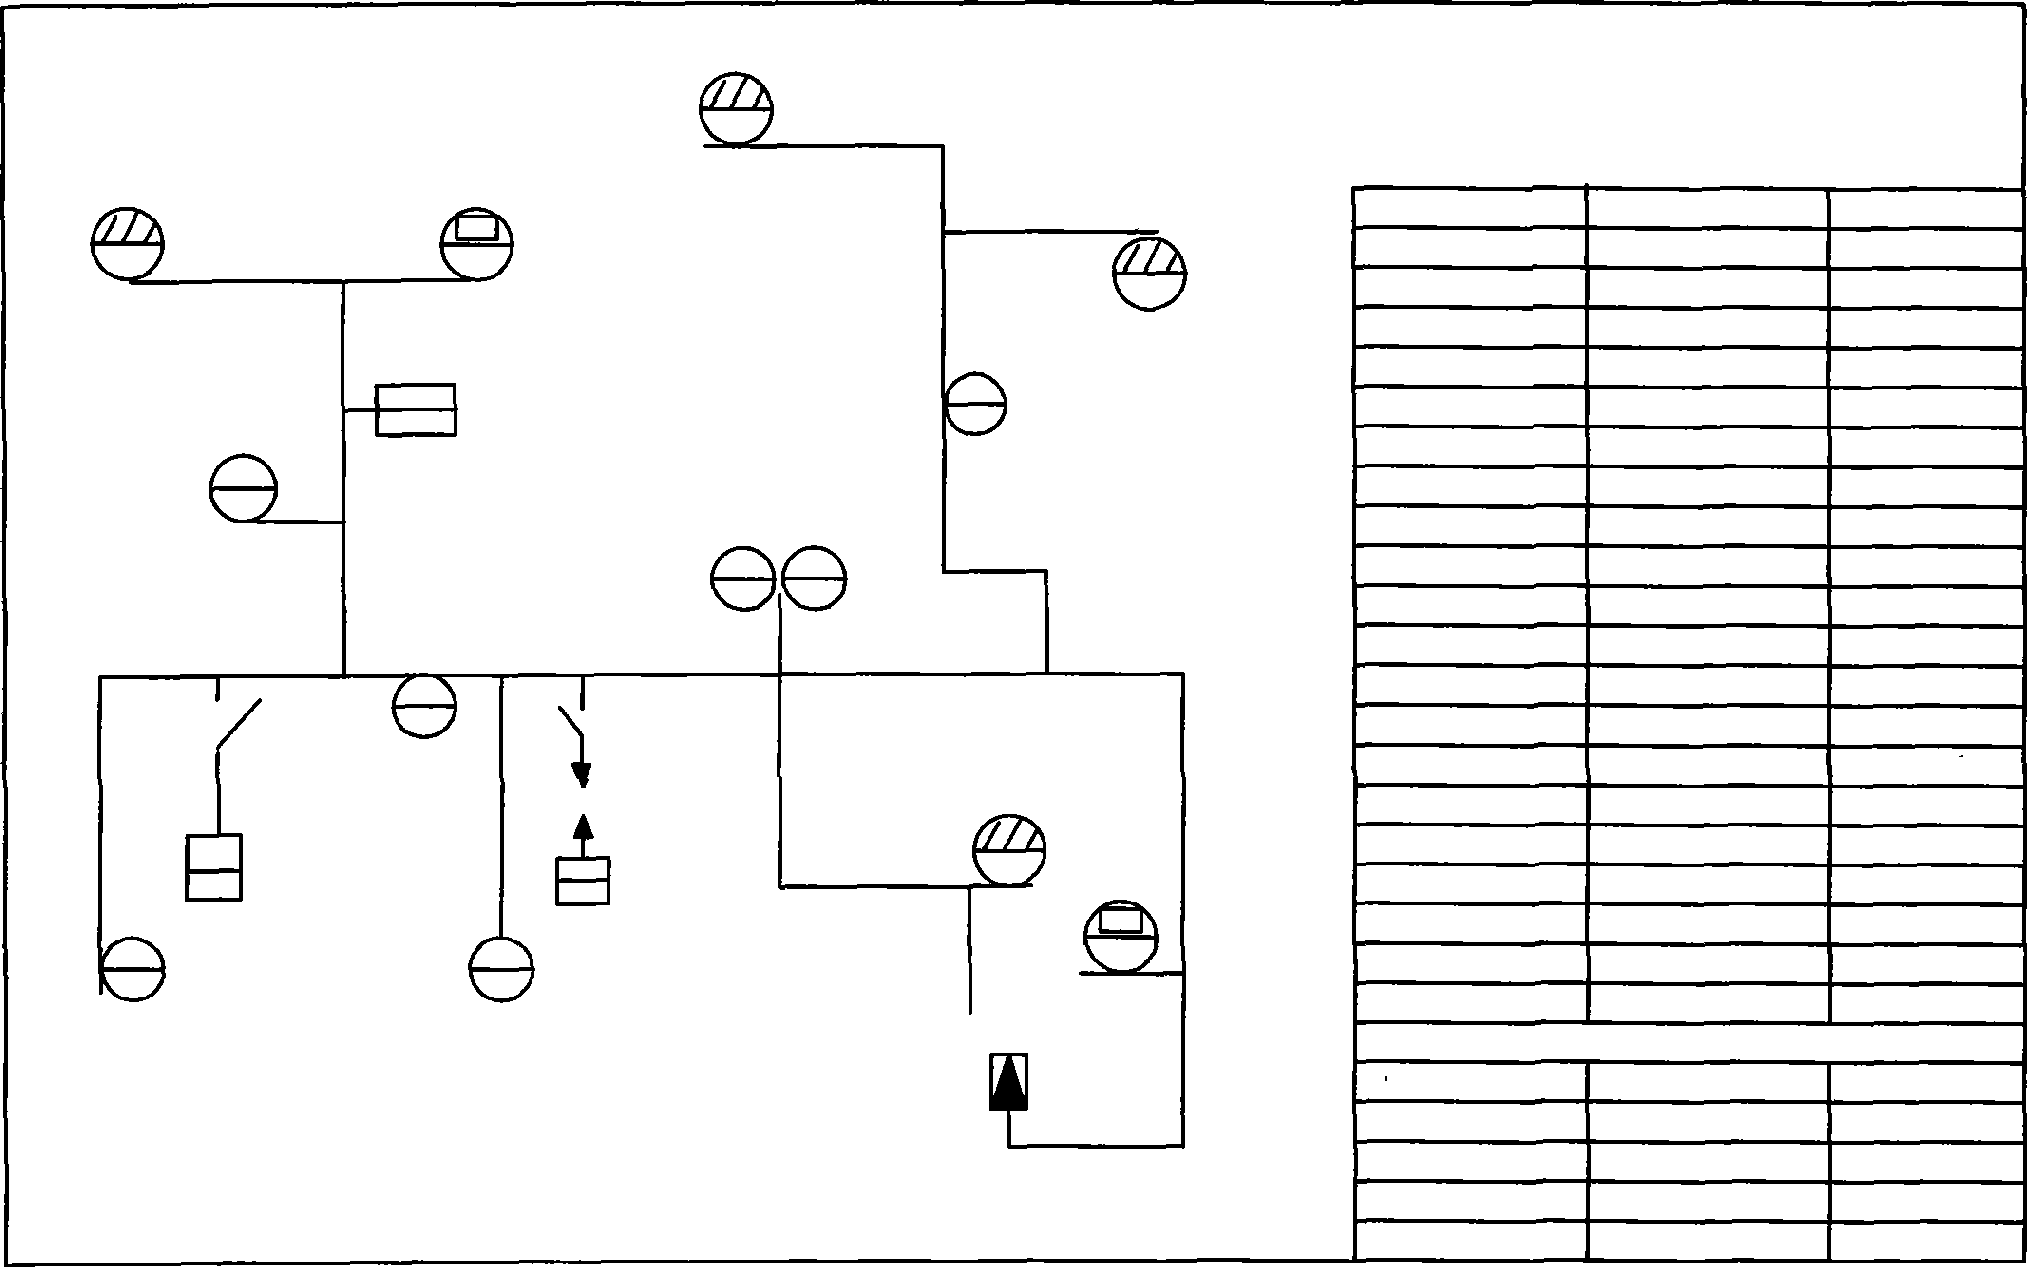
[0021] This graphics system uses graphics and data to reflect the operation of power distribution equipment and distribution network in a timely manner. It is supported by database technology, graphics technology, geographic information technology, network technology, and multimedia technology. It is based on B / S system. Mainly, C / S system as supplementary, a three-layer structure integrated information platform built through WEB services. According to the requirements of distribution operation, maintenance, safety, dispatching and other production management processes, this graphic system sets bar diagram, single-line diagram, system diagram, low-voltage station area network diagram, kiosk station wiring Figure five a subsystem. Each graphics system provides graphics drawing, automatic generation, multi-graphic linkage, and graphics-data linkage functions. Changing data directly affects graphics, adding and deleting graphics affects data at the same time, and closely combine...


PUM


Abstract

The invention relates to an electric power facility computer manage software, namely a power distribution productive management information figure system. The figure system sets a compare geographic entity and a geographical position layer special for existing power distribution network and power distribution facility, establishes five relative figure data modules according with existing management mode, compiles graphics drawing, automatic generating and linkage program. Data in each figure is interrelated, and one data is changed that can realize a plurality of figure data linkage and awoke. The figure system can reflect condition of the power distribution network and facility timely and accurately, particularly a plurality of figure linkage function that can save mass labour resource, increase information instantaneity and reliability, avoid abuse of differ manage information to the figure and easy to oversight, accordingly, provides an advanced computer manage special software to the power distribution productive department. The manage software provided by the invention has important significance for ensuring correctness of power distribution productive commanding and decision-making, realizing scientification and standardization of power distribution productive manage, increasing emergency ability and working efficiency.

Description

technical field [0001] The invention relates to a computer management software for electric power facilities, that is, an information graphics system for power distribution production management. Background technique [0002] Using graphics to represent the status of power distribution facilities is an important means of power distribution production management. In the past, the graphics related to power facilities were mostly drawn by hand, with a heavy workload and unable to reflect changes in time, so the role of guiding decision-making was very limited. In recent years, with the popularization and development of computer technology, the work of drawing graphics has been carried out by electronic computers through corresponding software systems. Obviously, computer software is powerful and has advantages that cannot be compared with manual drawing. However, the existing graphics software are all general-purpose software for multiple industries. Although these software h...

Claims


Application Information

Patent Timeline
IPC IPC(8): G06F19/00G06F9/44G06Q10/06G06Q50/06
Inventor 杨志华
Owner 杨志华
Why Eureka
Try Eureka